UPD1 Fibo Levels
- Indicatori
-
Vitaliy Kuznetsov
 UPD1 MT4 Indicators - https://www.mql5.com/en/market/mt4/indicator?filter=UPD1
Levels
Patterns
Volume
Money Management - Versione: 1.51
- Aggiornato: 1 gennaio 2025
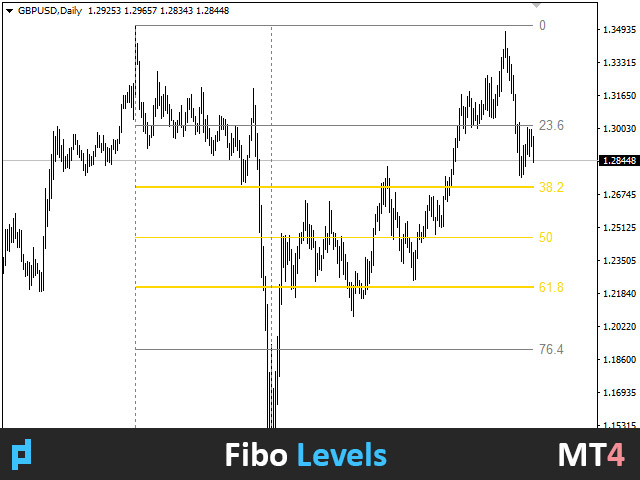
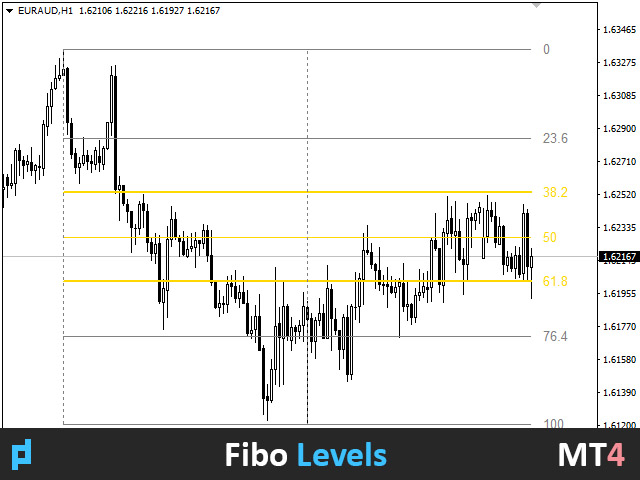
L'indicatore analizza il numero di candele specificato e costruisce i livelli di Fibonacci in base al massimo e al minimo.
Poiché i livelli vengono ricostruiti, siamo interessati al lato destro dell'intervallo. Il prezzo è magnetico rispetto ai livelli e reagisce a un tocco.
Utilizzate questo strumento per trovare un punto di ingresso nel trend dopo una correzione.
Se a sinistra vediamo che i livelli sono perfettamente al rialzo, allora possiamo presumere di aver trovato la fine del movimento nel punto estremo.
Tutte le linee sono tracciate attraverso buffer o oggetti (a scelta).
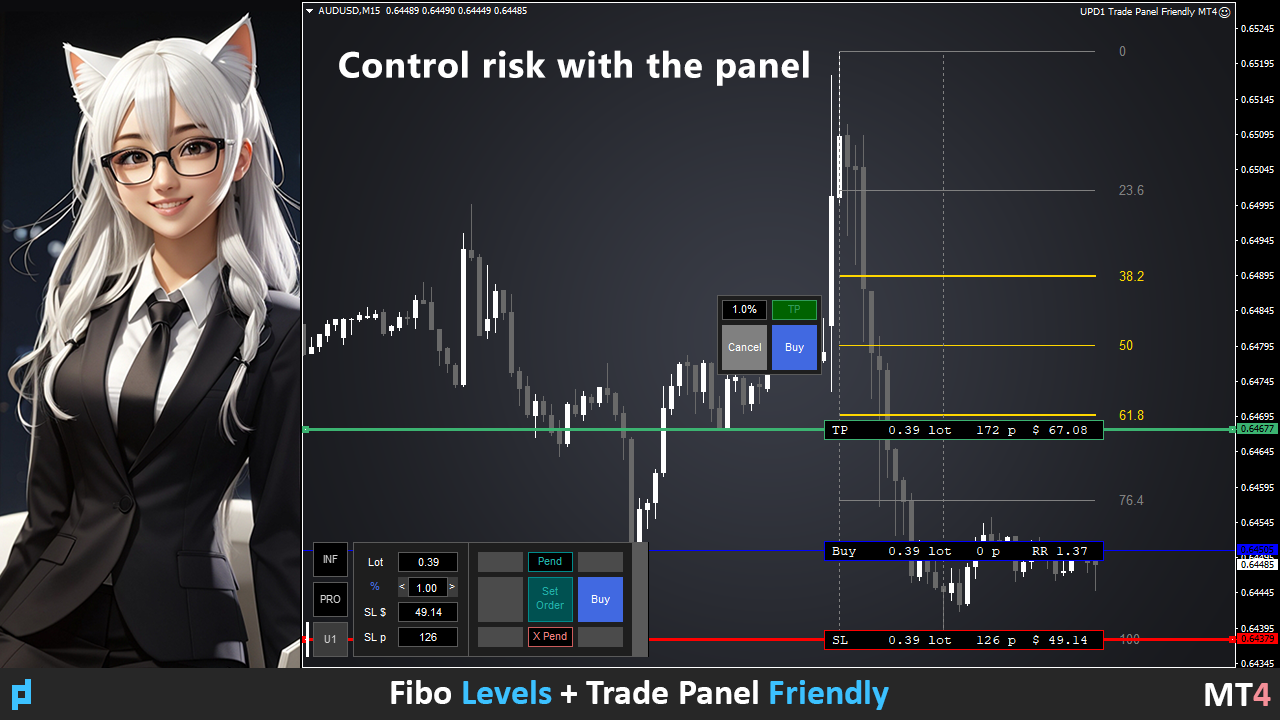
Parametri di ingresso.
Bars Count - intervallo per il calcolo.
Visual Button - visualizzazione del pulsante (on/off).
Corner - Angolo di vincolo del pulsante.
X indent - rientro orizzontale in pixel.
Y indent - rientro verticale in pixel.
Label Visual - visualizza l'etichetta del livello.
Label Font Size - dimensione del carattere.
Label Shift Bars - rientro dell'iscrizione.
Label Tooltip - visualizza l'iscrizione sotto il cursore sopra il livello.
Draw Lines - disegna linee con buffer o oggetti.
Box Visual - abilita/disabilita il box visual.
Box Width - spessore delle linee della casella.
Box Style - stile delle linee del riquadro.
Levels Color - colore delle linee.
Levels Width - spessore delle linee.
Levels Style - stile delle linee.
Alert - abilita/disabilita l'avviso.
Alert Work Time - tempo di lavoro dell'avviso 00:00-23:59 (modificabile).
Alert Pop Up - finestra a comparsa.
Alert Push - avviso nell'applicazione.
Alert Email - notifica per posta elettronica.
Alert Sound - abilita o disabilita il suono.
Alert Sound Name - il file audio.
Line ID - prefisso al nome dell'oggetto.


Thank you. Very good.