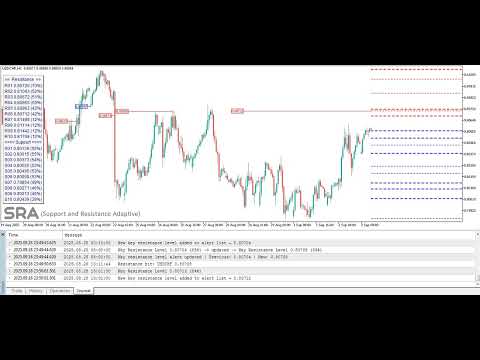
Support and Resistance Adaptive
- Indicatori
- Versione: 1.0
- Attivazioni: 5

SRA (Support & Resistance Adaptive)
Trade with Conviction, Not Guesswork
Support & Resistance Adaptive is a professional-grade analytical engine for MetaTrader 5, designed to cut through market noise and automatically pinpoint the most statistically robust support and resistance levels.
Move Beyond Basic Indicators:
Forget outdated, single-method tools that litter your chart with irrelevant lines. Our indicator employs an advanced multi-source confluence engine, synthesizing data from four distinct analytical perspectives to find levels that truly matter:
- Price Action Pivots: Detect traditional swing highs and lows.
- Volume-Weighted Average Price (VWAP): Locate the true average price where the majority of volume has traded.
- Fibonacci Retracements: Calculate key psychological retracement zones.
- Volume Profile POC: Identify the high-activity price node (Point of Control).
The Result? Unmatched Clarity. Each level is assigned a dynamic Confidence Score based on the strength of its confluence, recent price reactions, and trading volume. This instantly allows you to visually distinguish between weak, noisy levels and high-probability, key levels—so you can focus your attention where it counts.
Key Features Designed for Serious Traders:
- Adaptive to Volatility: The clustering algorithm automatically adjusts using market volatility, ensuring accurate levels in any market condition—from quiet ranges to high-volatility breakouts.
- Smart, Customizable Alerts: Get notified via push, email, or sound alerts when price approaches or reacts from a high-probability key level. Never miss a setup again.
- Clean, Actionable Visualization: Key levels are emphasized with bold, extended lines. A built-in info panel displays all critical data (price & score) directly on your chart, eliminating guesswork.
- Complete Control: Fine-tune every parameter to match your strategy—adjust source weights, visual styles, and alert settings.
- Data Export for Backtesting: Export all level data to CSV for rigorous strategy development and validation in the MT5 Strategy Tester.
Built For Traders Who Demand More:
- Day Traders & Scalpers: Execute with precision by identifying high-probability intraday turning points.
- Swing Traders: Map the broader market structure for optimal trade entry and exit location.
- System Developers: Use the exported data to research, quantify, and build data-driven strategies.
Stop analyzing. Start executing. Add Support & Resistance Adaptive to your MT5 platform today and transform your chart into a strategic roadmap.
Complete Guide to SRA Indicator Inputs
In this section, each input of the SRA indicator is explained in detail and conceptually so that even beginner users can easily understand and use them.
// ------------------- GENERAL SETTINGS -------------------
Timing for recalculating support-resistance levels
This input controls how frequently the indicator recalculates support and resistance levels. every minute, which updates levels every minute, and each new candle, which recalculates only at the start of each new candle.
Minimum score (%) to trigger alerts for key levels
This input sets the minimum score (%) required for a key level to trigger an alert. For example, if set to 80, the indicator will only alert when the price touches levels with a significance score of 80% or higher. This parameter allows you to filter out less important levels and focus on the most reliable ones for your trading decisions.
Enable alerts for price touching key levels
This input specifically controls whether alerts are triggered when the price touches key levels. If set to true, the indicator will generate alerts for these events. If set to false, no alerts will be issued. Importantly, this parameter does not affect email or notification settings; those are controlled separately by Mail and Notification inputs. This allows you to manage sound alerts independently from other alert types.
Name of the alert sound file
This input specifies the name of the sound file that will play when an alert is triggered. For example, if set to "alert.wav", the indicator will play this sound file. Ensure the sound file is placed in the C:\Program Files\MetaTrader 5\Sounds directory for it to work properly.
Number of times the alert sound repeats
This input determines how many times the alert sound will repeat when triggered. For example, if set to 3, the sound will play three times. Adjust this parameter based on your preference for how noticeable you want the alert to be.
Pause (in seconds) between alert sound repetitions
This input sets the delay (in seconds) between each repetition of the alert sound. For example, if set to 3, there will be a 3-second pause between each sound repetition. This parameter helps customize the alert experience to suit your needs.
Enable email alerts
This input determines whether email alerts will be sent when a key level is touched. If set to true, the indicator will send an email notification. Ensure your email settings are properly configured in the platform for this feature to work.
Enable platform notifications
This input controls whether platform notifications will be sent when a key level is touched. If set to true, a notification will appear in the MetaTrader platform. This is useful for traders who want immediate visual alerts without relying on sound or email.
// ------------------ TIMEFRAME & HISTORY -----------------
Base timeframe for calculations and visualization
This input specifies the base timeframe for calculating and displaying support and resistance levels. For example, if set to H1, the indicator calculates levels based on the 1-hour chart data. This parameter helps align your analysis with your desired timeframe.
Number of historical bars to analyze
This input sets the number of historical bars the indicator uses for analysis. For example, if set to 1000, the indicator uses the last 1000 bars to identify levels. A larger number provides deeper analysis but may slightly slow down processing speed.
// -------------------- PIVOT SETTINGS --------------------
Enable Pivot for levels identification
This input determines whether to use the pivot for level identification.
Number of left bars for pivot detection
This input sets the number of bars to the left of a point to identify a pivot (high or low). For example, if set to 5, the indicator checks 5 bars before the point to confirm it as a pivot.
Number of right bars for pivot detection
This input sets the number of bars to the right of a point to identify a pivot. For example, if set to 5, the indicator checks 5 bars after the point to confirm it as a pivot.
Minimum distance between pivots (in pips). [0 = Adaptive]
This input sets the minimum distance between two pivots in pips. For example, if set to 10, the indicator only identifies pivots that are at least 10 pips apart. This reduces redundant levels.
// -------------------- VWAP SETTINGS ---------------------
Enable VWAP for level identification
This input determines whether to use the Volume Weighted Average Price (VWAP) for level identification. VWAP is a powerful tool for identifying key levels based on trading volume.
Timeframe for VWAP session
This input sets the timeframe for VWAP calculation. For example, if set to D1, VWAP is calculated using daily data.
Number of past days for VWAP calculation
This input sets the number of past days for VWAP calculation. For example, if set to 30, the indicator uses data from the last 30 days to calculate VWAP.
// ----------------- FIBONACCI SETTINGS -------------------
Enable Fibonacci levels
This input determines whether to use Fibonacci levels for identifying support and resistance. Fibonacci levels are based on price swings.
Number of bars to look back for Fibonacci swings
This input sets the number of past bars for identifying price swings (highs and lows). For example, if set to 200, the indicator uses the last 200 bars to identify swings.
Fibonacci levels (semicolon-separated)
This input specifies the Fibonacci levels to be used. For example, if set to "0.382;0.5;0.618", the indicator uses these levels for analysis.
// --------------- VOLUME PROFILE SETTINGS ----------------
Enable volume profile
This input determines whether to use the Volume Profile for level identification. The Volume Profile identifies key levels based on trading volume.
Number of bars for volume profile calculation
This input sets the number of past bars for Volume Profile calculation. For example, if set to 500, the indicator uses the last 500 bars for the Volume Profile.
Number of price bins for volume profile
This input sets the number of price levels (bins) for Volume Profile calculation. For example, if set to 50, the indicator divides the price into 50 levels and calculates volume for each.
Use real volume if available
This input determines whether to use real volume instead of tick volume. Real volume counts the number of trades executed within a timeframe.
Use tick volume if real volume is unavailable
This input determines whether to use tick volume instead of real volume. Tick volume counts price changes within a timeframe and is useful in markets where real volume is unavailable.
// --------------- CLUSTER & LEVEL SETTINGS ---------------
Clustering distance for levels (in pips). [0 = Adaptive]
This input sets the minimum distance between levels in pips. For example, if set to 10, the indicator combines levels that are less than 10 pips apart.
Minimum sources required to keep a cluster
This input sets the minimum number of sources (pivot, VWAP, Fibonacci, Volume Profile) a level must have to be displayed. For example, if set to 1, a level is displayed even if it has only one source.
Maximum number of levels to display
This input sets the maximum number of levels the indicator displays. For example, if set to 20, the indicator only displays the top 20 levels.
// ------------------- WEIGHT SETTINGS --------------------
Weight of pivots in level scoring
This input sets the weight of pivots in level scoring. For example, if set to 0.25, pivots contribute 25% to the total level score.
Weight of VWAP in level scoring
This input sets the weight of VWAP in level scoring. For example, if set to 0.20, VWAP contributes 20% to the total level score.
Weight of Fibonacci in level scoring
This input sets the weight of Fibonacci levels in level scoring. For example, if set to 0.20, Fibonacci levels contribute 20% to the total level score.
Weight of volume profile in level scoring
This input sets the weight of the Volume Profile in level scoring. For example, if set to 0.35, the Volume Profile contributes 35% to the total level score.
// ---------------- HIT & SCORING SETTINGS ----------------
Number of bars to count hits for levels
This input sets the number of past bars for counting hits to a level. For example, if set to 200, the indicator checks the last 200 bars to count hits.
Minimum hits required for level validation
This input sets the minimum number of hits required to validate a level. For example, if set to 1, even one hit is enough to validate the level.
Weight of volume in hit scoring
This input sets the weight of trading volume in hit scoring. For example, if set to 0.5, trading volume contributes 50% to the hit score.
Weight of candlestick rejection in scoring
This input sets the weight of price rejection in level scoring. For example, if set to 0.5, price rejection contributes 50% to the level score.
// ---------------- VISUALIZATION SETTINGS ----------------
Color for support lines
This input sets the color for support lines. For example, if set to green, support lines are displayed in green.
Color for resistance lines
This input sets the color for resistance lines. For example, if set to red, resistance lines are displayed in red.
Line style for support/resistance levels
This input sets the style of support and resistance lines. For example, if set to dashed, lines are displayed as dashed.
Enable level labels on the chart
This input determines whether to display informational labels (e.g., price and score) on the chart.
Color for the background of the labels
This input sets the background color for the rectangular box that contains the support and resistance level labels on the chart.
Color for the labels on the chart
This input defines the text color used for the informational labels displayed on the chart, which show the price and confidence score of each support and resistance level.
Extend key level lines until hit
This input will visually extend any level that meets the "Key Level" score threshold across the entire chart to the right, making it persistently visible until the price action breaches it.
Key level lines style
This input sets the visual line style (e.g., solid, dashed, dotted) specifically for the high-confidence "Key Levels".
// -------------------- FILE SETTINGS ---------------------
Save levels to a CSV file
This input determines whether to save identified levels to a CSV file.
Filename for saving levels
This input sets the filename for saving levels. For example, if set to "sr_levels.csv", levels are saved in this file.
// -------------------- DEBUG SETTINGS --------------------
Enable debug mode for additional logging
This input determines whether to enable debug mode. In this mode, useful information is logged in the MetaTrader console.
By carefully configuring these inputs, you can tailor the SRA indicator to your trading needs and benefit from more precise and personalized analysis.