Support and Resistance Adaptive

SRA (Support & Resistance Adaptive)

Trade with Conviction, Not Guesswork

Support & Resistance Adaptive is a professional-grade analytical engine for MetaTrader 5, designed to cut through market noise and automatically pinpoint the most statistically robust support and resistance levels.

Move Beyond Basic Indicators:

Forget outdated, single-method tools that litter your chart with irrelevant lines. Our indicator employs an advanced multi-source confluence engine, synthesizing data from four distinct analytical perspectives to find levels that truly matter:

  • Price Action Pivots: Detect traditional swing highs and lows.
  • Volume-Weighted Average Price (VWAP): Locate the true average price where the majority of volume has traded.
  • Fibonacci Retracements: Calculate key psychological retracement zones.
  • Volume Profile POC: Identify the high-activity price node (Point of Control).

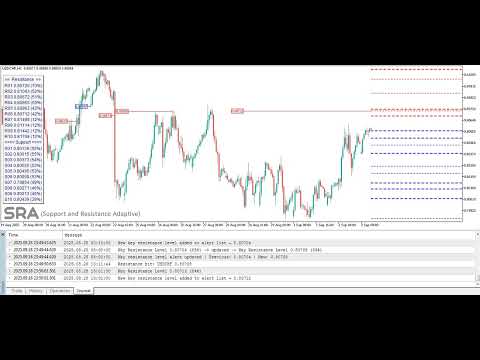
The Result? Unmatched Clarity. Each level is assigned a dynamic Confidence Score based on the strength of its confluence, recent price reactions, and trading volume. This instantly allows you to visually distinguish between weak, noisy levels and high-probability, key levels—so you can focus your attention where it counts.

Key Features Designed for Serious Traders:

  • Adaptive to Volatility: The clustering algorithm automatically adjusts using market volatility, ensuring accurate levels in any market condition—from quiet ranges to high-volatility breakouts.
  • Smart, Customizable Alerts: Get notified via push, email, or sound alerts when price approaches or reacts from a high-probability key level. Never miss a setup again.
  • Clean, Actionable Visualization: Key levels are emphasized with bold, extended lines. A built-in info panel displays all critical data (price & score) directly on your chart, eliminating guesswork.
  • Complete Control: Fine-tune every parameter to match your strategy—adjust source weights, visual styles, and alert settings.
  • Data Export for Backtesting: Export all level data to CSV for rigorous strategy development and validation in the MT5 Strategy Tester.

Built For Traders Who Demand More:

  • Day Traders & Scalpers: Execute with precision by identifying high-probability intraday turning points.
  • Swing Traders: Map the broader market structure for optimal trade entry and exit location.
  • System Developers: Use the exported data to research, quantify, and build data-driven strategies.

Stop analyzing. Start executing. Add Support & Resistance Adaptive to your MT5 platform today and transform your chart into a strategic roadmap.


Complete Guide to SRA Indicator Inputs

In this section, each input of the SRA indicator is explained in detail and conceptually so that even beginner users can easily understand and use them.

// ------------------- GENERAL SETTINGS -------------------

Timing for recalculating support-resistance levels

This input controls how frequently the indicator recalculates support and resistance levels. every minute, which updates levels every minute, and each new candle, which recalculates only at the start of each new candle.

Minimum score (%) to trigger alerts for key levels

This input sets the minimum score (%) required for a key level to trigger an alert. For example, if set to 80, the indicator will only alert when the price touches levels with a significance score of 80% or higher. This parameter allows you to filter out less important levels and focus on the most reliable ones for your trading decisions.

Enable alerts for price touching key levels

This input specifically controls whether alerts are triggered when the price touches key levels. If set to true, the indicator will generate alerts for these events. If set to false, no alerts will be issued. Importantly, this parameter does not affect email or notification settings; those are controlled separately by Mail and Notification inputs. This allows you to manage sound alerts independently from other alert types.

Name of the alert sound file

This input specifies the name of the sound file that will play when an alert is triggered. For example, if set to "alert.wav", the indicator will play this sound file. Ensure the sound file is placed in the C:\Program Files\MetaTrader 5\Sounds directory for it to work properly.

Number of times the alert sound repeats

This input determines how many times the alert sound will repeat when triggered. For example, if set to 3, the sound will play three times. Adjust this parameter based on your preference for how noticeable you want the alert to be.

Pause (in seconds) between alert sound repetitions

This input sets the delay (in seconds) between each repetition of the alert sound. For example, if set to 3, there will be a 3-second pause between each sound repetition. This parameter helps customize the alert experience to suit your needs.

Enable email alerts

This input determines whether email alerts will be sent when a key level is touched. If set to true, the indicator will send an email notification. Ensure your email settings are properly configured in the platform for this feature to work.

Enable platform notifications

This input controls whether platform notifications will be sent when a key level is touched. If set to true, a notification will appear in the MetaTrader platform. This is useful for traders who want immediate visual alerts without relying on sound or email.

// ------------------ TIMEFRAME & HISTORY -----------------

Base timeframe for calculations and visualization

This input specifies the base timeframe for calculating and displaying support and resistance levels. For example, if set to H1, the indicator calculates levels based on the 1-hour chart data. This parameter helps align your analysis with your desired timeframe.

Number of historical bars to analyze

This input sets the number of historical bars the indicator uses for analysis. For example, if set to 1000, the indicator uses the last 1000 bars to identify levels. A larger number provides deeper analysis but may slightly slow down processing speed.

// -------------------- PIVOT SETTINGS --------------------

Enable Pivot for levels identification

This input determines whether to use the pivot for level identification.

Number of left bars for pivot detection

This input sets the number of bars to the left of a point to identify a pivot (high or low). For example, if set to 5, the indicator checks 5 bars before the point to confirm it as a pivot.

Number of right bars for pivot detection

This input sets the number of bars to the right of a point to identify a pivot. For example, if set to 5, the indicator checks 5 bars after the point to confirm it as a pivot.

Minimum distance between pivots (in pips). [0 = Adaptive]

This input sets the minimum distance between two pivots in pips. For example, if set to 10, the indicator only identifies pivots that are at least 10 pips apart. This reduces redundant levels.

// -------------------- VWAP SETTINGS ---------------------

Enable VWAP for level identification

This input determines whether to use the Volume Weighted Average Price (VWAP) for level identification. VWAP is a powerful tool for identifying key levels based on trading volume.

Timeframe for VWAP session

This input sets the timeframe for VWAP calculation. For example, if set to D1, VWAP is calculated using daily data.

Number of past days for VWAP calculation

This input sets the number of past days for VWAP calculation. For example, if set to 30, the indicator uses data from the last 30 days to calculate VWAP.

// ----------------- FIBONACCI SETTINGS -------------------

Enable Fibonacci levels

This input determines whether to use Fibonacci levels for identifying support and resistance. Fibonacci levels are based on price swings.

Number of bars to look back for Fibonacci swings

This input sets the number of past bars for identifying price swings (highs and lows). For example, if set to 200, the indicator uses the last 200 bars to identify swings.

Fibonacci levels (semicolon-separated)

This input specifies the Fibonacci levels to be used. For example, if set to "0.382;0.5;0.618", the indicator uses these levels for analysis.

// --------------- VOLUME PROFILE SETTINGS ----------------

Enable volume profile

This input determines whether to use the Volume Profile for level identification. The Volume Profile identifies key levels based on trading volume.

Number of bars for volume profile calculation

This input sets the number of past bars for Volume Profile calculation. For example, if set to 500, the indicator uses the last 500 bars for the Volume Profile.

Number of price bins for volume profile

This input sets the number of price levels (bins) for Volume Profile calculation. For example, if set to 50, the indicator divides the price into 50 levels and calculates volume for each.

Use real volume if available

This input determines whether to use real volume instead of tick volume. Real volume counts the number of trades executed within a timeframe.

Use tick volume if real volume is unavailable

This input determines whether to use tick volume instead of real volume. Tick volume counts price changes within a timeframe and is useful in markets where real volume is unavailable.

// --------------- CLUSTER & LEVEL SETTINGS ---------------

Clustering distance for levels (in pips). [0 = Adaptive]

This input sets the minimum distance between levels in pips. For example, if set to 10, the indicator combines levels that are less than 10 pips apart.

Minimum sources required to keep a cluster

This input sets the minimum number of sources (pivot, VWAP, Fibonacci, Volume Profile) a level must have to be displayed. For example, if set to 1, a level is displayed even if it has only one source.

Maximum number of levels to display

This input sets the maximum number of levels the indicator displays. For example, if set to 20, the indicator only displays the top 20 levels.

// ------------------- WEIGHT SETTINGS --------------------

Weight of pivots in level scoring

This input sets the weight of pivots in level scoring. For example, if set to 0.25, pivots contribute 25% to the total level score.

Weight of VWAP in level scoring

This input sets the weight of VWAP in level scoring. For example, if set to 0.20, VWAP contributes 20% to the total level score.

Weight of Fibonacci in level scoring

This input sets the weight of Fibonacci levels in level scoring. For example, if set to 0.20, Fibonacci levels contribute 20% to the total level score.

Weight of volume profile in level scoring

This input sets the weight of the Volume Profile in level scoring. For example, if set to 0.35, the Volume Profile contributes 35% to the total level score.

// ---------------- HIT & SCORING SETTINGS ----------------

Number of bars to count hits for levels

This input sets the number of past bars for counting hits to a level. For example, if set to 200, the indicator checks the last 200 bars to count hits.

Minimum hits required for level validation

This input sets the minimum number of hits required to validate a level. For example, if set to 1, even one hit is enough to validate the level.

Weight of volume in hit scoring

This input sets the weight of trading volume in hit scoring. For example, if set to 0.5, trading volume contributes 50% to the hit score.

Weight of candlestick rejection in scoring

This input sets the weight of price rejection in level scoring. For example, if set to 0.5, price rejection contributes 50% to the level score.

// ---------------- VISUALIZATION SETTINGS ----------------

Color for support lines

This input sets the color for support lines. For example, if set to green, support lines are displayed in green.

Color for resistance lines

This input sets the color for resistance lines. For example, if set to red, resistance lines are displayed in red.

Line style for support/resistance levels

This input sets the style of support and resistance lines. For example, if set to dashed, lines are displayed as dashed.

Enable level labels on the chart

This input determines whether to display informational labels (e.g., price and score) on the chart.

Color for the background of the labels

This input sets the background color for the rectangular box that contains the support and resistance level labels on the chart.

Color for the labels on the chart

This input defines the text color used for the informational labels displayed on the chart, which show the price and confidence score of each support and resistance level.

Extend key level lines until hit

This input will visually extend any level that meets the "Key Level" score threshold across the entire chart to the right, making it persistently visible until the price action breaches it.

Key level lines style

This input sets the visual line style (e.g., solid, dashed, dotted) specifically for the high-confidence "Key Levels".

// -------------------- FILE SETTINGS ---------------------

Save levels to a CSV file

This input determines whether to save identified levels to a CSV file.

Filename for saving levels

This input sets the filename for saving levels. For example, if set to "sr_levels.csv", levels are saved in this file.

// -------------------- DEBUG SETTINGS --------------------

Enable debug mode for additional logging

This input determines whether to enable debug mode. In this mode, useful information is logged in the MetaTrader console.

By carefully configuring these inputs, you can tailor the SRA indicator to your trading needs and benefit from more precise and personalized analysis.
おすすめのプロダクト
Pivot Points Classic – L’indicatore essenziale per ogni trader tecnico Questo indicatore disegna automaticamente i livelli di Pivot Point più utilizzati dai trader professionisti, con supporto completo a 4 metodi di calcolo:   Metodi supportati : • Traditional • Fibonacci • Woodie • Camarilla   Caratteristiche principali :  Calcolo su timeframe superiore (multi-timeframe)  Visualizzazione chiara dei livelli P, R1, R2, R3, S1, S2, S3   Etichette dinamiche con nome e valore del livello  Colori per
FREE
Dual Bollinger Session Channel MetaTrader 5 向けプロフェッショナル固定セッション ボリンジャーチャネル リアルなセッションデータを用いた、プライスアクション、ブレイクアウト、機関的マーケット構造分析のために設計されています。 製品概要 Dual Bollinger Session Channel は MetaTrader 5 向けのプロフェッショナルグレードのテクニカルインジケーターであり、直近の 実際の取引セッション (日足または週足)に基づき、2つの独立したボリンジャーバンド計算から固定された統計的価格チャネルを構築します。 従来のボリンジャーバンドが新しい足が形成されるたびに継続的に再計算されるのに対し、本インジケーターは 現在のアクティブセッション全体を通じてすべてのチャネルレベルを固定 し、取引期間中、安定的かつ信頼性の高い統計的枠組みを提供します。 このアプローチにより、以下の要素を正確に可視化できます: 価格の均衡ゾーン 統計的な過伸長領域 ボラティリティの拡大・収縮領域 本インジケーターは すべての時間足 (タイムフレーム
Pattern Vision Ultimate
Shamsan Yahya Muhammad Ali Masad
CandlePatternProUltimate Indicator for MetaTrader 5  Overview The   CandlePatternProUltimate   indicator is an advanced tool for detecting Japanese candlestick patterns on charts in the MetaTrader 5 platform. It features an attractive artistic interface and detects   150+ different patterns   with intelligent AI-based analysis Artistic Design Customizable Colors : Fully customizable artistic color palette Visual Effects : Glows and artistic effects to make patterns more visible Black Backgrou
Market Structure Fractals The structure layer MetaTrader 5 was missing Most traders stare at candles and draw structure manually — imprecisely, inconsistently, and always too late. You know what a fractal high and low look like. The question is whether you can spot every one, mark it cleanly, and track it the moment price breaks through. You can't. Market Structure Fractals can. MetaTrader 5 shows you price. It doesn't show you structure. That gap — between a candle pattern and a confirmed bre
FREE
A Média Móvel é um indicador que faz parte da Análise Técnica. Com ela, é possível identificar o equilíbrio dos preços no mercado, observando tendências de alta, neutra ou baixa. Este indicador customizado traz opções extras pera definir o método de cálculo podendo-se esclolher entre SMA,EMA,SSMA,LWMA,JJMA,JurX,ParMA,T3,Vidya,AMA,HULL MA. Também conta com varias opções para escolher o método de cálculo para o preço base a ser usado no cáculo da média.
Swiss VWAPsimple
Terence Gronowski
4.8 (5)
Swiss VWAPsimple Motivation Did not find free VWAP that works, the one that I found craseh. So I created a VWAP which calculates values only for the actual day. So computer resouces are not over stressed. What is VWAP, how is it used?  VWAP stands for Volume Weighed Average Price, it calculates the running sum of tick volume and the runnung sum of price times tickvolume. The division of these sums result in a weighed price (Sum P*V/Sum V). The calculation starts normally at midnight. The values
FREE
収益性の高い取引機会を簡単に特定するのに役立つ強力な外国為替取引インジケーターをお探しですか?ビースト スーパー シグナル以外に探す必要はありません。 この使いやすいトレンドベースのインジケーターは、市場の状況を継続的に監視し、新しいトレンドを検索したり、既存のトレンドに飛びついたりします。ビースト スーパー シグナルは、すべての内部戦略が一致し、互いに 100% 合流したときに売買シグナルを発するため、追加の確認は不要です。シグナル矢印アラートを受け取ったら、単に売買します。 購入後、プライベート VIP グループに追加されるようにメッセージを送ってください! (完全な製品購入のみ)。 購入後、最新の最適化されたセット ファイルについてメッセージを送ってください。 MT4版は こちらから。 Beast Super Signal EA は こちらから 入手できます。 コメント セクションをチェックして、最新の結果を確認してください。 ビースト スーパー シグナルは、1:1、1:2、または 1:3 のリスクと報酬の比率に基づいて、エントリー価格、ストップ ロス、テイク プ
FluxGate Precision は、MetaTrader 5 向けの不再描画フィボナッチベーストレンド検出インジケーターです。過去のローソク足のローリング分析ウィンドウ(デフォルト:44本)をスキャンし、そのウィンドウ内の最高値と最安値を計算し、三つの動的フィボナッチレベル——Fib Highしきい値、50%トレンドライン、Fib Lowしきい値——を導出します。確定したバーの終値がトレンドラインとFib Highレベルの両方を上抜けると買いシグナルが発火し、強気のトレンド転換を示します。終値がトレンドラインとFib Lowレベルの両方を下抜けると売りシグナルが発火し、弱気の反転を確認します。すべてのシグナルは確定(クローズ済み)バーのみで評価されるため、再描画や消失は一切発生しません。 各シグナルはATR適応型ストップロスと最大4つのテイクプロフィットレベルを自動計算します。プログレッシブなブレイクイーブントレーリングシステムが目標到達時に利益を確定します。リアルタイムダッシュボードは現在のシグナル、エントリー価格、全TP/SLレベルの到達状況、および総合的な取引ステータスを表
Fibonacci Auto Levels Pro MT5 – リトレースメント、エクステンション、ピボットポイント Fibonacci Auto Levels Pro MT5 は、市場のスイングポイントを自動的に検出し、完全なフィボナッチ・リトレースメント、エクステンション、およびピボットポイントの構造をチャート上に描画する高度なテクニカル分析ツールです。 このインジケーターは、いくつかの独立したシステムを統合された単一の分析ツールに組み合わせています。 ピボットポイント (フィボナッチモード) ピボットポイントは、前期間の値幅に基づいて、潜在的なサポートおよびレジスタンスゾーンを特定するために使用されます。 このインジケーターは、前回の高値 (High)、安値 (Low)、終値 (Close) にフィボナッチ比率を適用して計算される フィボナッチ・ピボットポイント を使用します。 ピボットポイントの時間足は、手動で設定することも、以下のロジックを使用して自動で設定することもできます。 日中取引 ≤ 5 分 → 4 時間足 5–45 分 → 日足 45 分–4 時間 → 週足 日足
QuantView Analytics Pro is  An on-chart graphical dashboard that tracks, aggregates, and analyzes your trading history. Calculate Profit Factors, Average Win/Loss, and long/short directional bias splits for every Symbol and Magic Number in your portfolio. Elevate Your Trading Forensics with QuantView Analytics Master You are currently using the free version of QuantView Analytics Pro. If you are a serious algorithmic developer or quantitative trader, it is time to upgrade your risk management wi
FREE
ベータリリース Telegram to MT5 Signal Trader はまもなく正式なアルファ版をリリースします。いくつかの機能はまだ開発中で、小さな不具合に遭遇する可能性があります。問題が発生した場合はぜひご報告ください。皆さまのフィードバックがソフトウェア改善に役立ちます。 Telegram to MT5 Signal Trader は、 Telegram のチャンネルやグループからの取引シグナルを自動的に MetaTrader 5 にコピーする強力なツールです。 パブリックおよびプライベートの両方のチャネルに対応し、複数のシグナル提供元を複数のMT5口座に接続可能です。ソフトウェアは高速で安定し、すべての取引を細かく制御できます。 インターフェースは直感的で、ダッシュボードとチャートは見やすく設計されており、リアルタイムで動作状況をモニターできます。 必要環境 MQL の制限により、EA は Telegram と通信するためのデスクトップアプリが必要です。 インストーラーは公式の インストールガイド にあります。 主な機能 マルチプロバイダー: 複数の Telegram
Daily Volume Profile - See Where Smart Money Trades Stop guessing support and resistance. Start seeing where REAL volume is. The Daily Volume Profile indicator reveals the hidden structure of the market by showing exactly where trading activity concentrates at each price level. While most traders use lagging indicators, you'll see where institutional money positions itself - BEFORE the move happens. What You Get: → POC (Point of Control) - The most powerful S/R level of each day, shown as a cle
PIVOT SCHEMATIC PRO: The Elite Institutional Market Synthesis Module Executive Overview Pivot Schematic Pro is not just a technical indicator; it is a comprehensive Hybrid Decision-Support Engine engineered for the professional trader who operates in today’s volatile global markets. By merging algorithmic precision with structural market theory, it provides a sophisticated "blueprint" of price action, enabling users to execute strategies with institutional-grade clarity. Technical Architecture &
CDV Candle Engine Pro is a MetaTrader 5 indicator designed to visualize Cumulative Delta Volume (CDV) directly on the price chart. It helps traders read market pressure more clearly by showing the balance between buying and selling activity in a clean, customizable layout. If you trade on MetaTrader 4, the MT4 edition is available here:  CDV Candle Engine Pro MT4 Public channel:   CLICK HERE Main Features CDV candle visualization on the main chart for easy reading in real time. Optional subwind
High of the Day and Low of the day Time and Price Fractal Studies is an indicator that will help you identify certain patterns that tend to repeat themseleves at certail times of the day or at certain prices.  It is used to study Daily Highs ad Lows in relation to time and price.  You will get to answer certail questions like: At what time of day does this market usually turn around. At what price does the market turn. Is it at round numbers etc
FREE
MPA Trend Dashboard — Multi-Symbol Signal Indicator for MetaTrader 5 MPA Trend Dashboard is a multi-symbol analytical indicator for MetaTrader 5 designed to provide a fast overview of market direction across several trading instruments at once. The indicator displays BUY, SELL, or WAIT signals in a compact dashboard directly on the chart and uses a set of popular technical indicators to evaluate the current market condition. It is suitable for traders who need to monitor several currency pairs,
HtfCandleProjection
Salama Sarobidy Andrianthary
HTF Candle Projection C'est un outil vraiment utile. Il vous montre, directement sur votre graphique, des bougies d'unités de temps plus grandes ou même des périodes que vous avez définies. Avec lui, vous pouvez voir jusqu'à 3 projections différentes en même temps. Ça vous donne une bonne idée des grandes tendances, sans avoir à changer d'unité de temps. Voici ses principaux atouts : Voir plusieurs unités de temps à la fois : Vous pouvez afficher des bougies H4, D1, W1, ou même des périodes qu
Headline: Stop Guessing, Start Winning. Unleash the Power of the Heiken Ashi Supertrend Indicator. Body: Are you tired of market noise, confusing charts, and missed opportunities? The Heiken Ashi Supertrend Indicator is the ultimate tool designed to bring clarity and confidence to your trading, once and for all. We've combined two of the most powerful concepts in technical analysis into one seamless, easy-to-use indicator: Crystal-Clear Trends with Heiken Ashi: Say goodbye to choppy price action
FOOTPRINTORDERFLOW: The Authoritative Guide ( This indicator is also compatible with economic providers that do not offer DOM data and BID/ASK data, It also supports various foreign exchange transactions, DEMO version,modleling must choose " Every tick based on real ticks"  ) Important notice: Before placing an order, please contact me first, and I will provide you with professional answers and services 1. Overview FOOTPRINTORDERFLOW  is an advanced Order Flow analysis tool designed for MetaTra
Dragos Clean Execution
Dragos-cristian Craciun
5 (1)
Dragos Clean Execution is a price action execution indicator designed to simplify a high-probability intraday workflow based on liquidity sweep, market structure shift, and fair value gap confirmation. The indicator combines a higher-timeframe sweep concept with a lower-timeframe execution model to help traders identify cleaner entry locations, define invalidation clearly, and visualize realistic take-profit targets directly on the chart. Instead of flooding the chart with unnecessary objects, D
Rossi Campos Arrows Indicator – 本当に機能するインジケーターで取引を強化 マーケットへのエントリーやエグジットをもっと明確にしたいなら、このインジケーターはあなたのためのものです。 MetaTrader 5 用に、ボリンジャーバンドと RSI を同時に組み合わせた独自インジケーターを開発しました。 アルゴリズムがすべての重い分析作業を行います: 実際の買いチャンスが現れたとき、チャートに緑の矢印が表示されます。 売りのタイミングでは赤い矢印が表示されます。 シンプルで、分かりやすく、視覚的です。 なぜこれほど効果的なのか? 2つのインジケーターが一致した時だけシグナルを出すからです。 矢印が表示されるのは以下の場合のみです: 有利なボラティリティ(ボリンジャーバンド) トレンドの強さまたは弱さの確認(RSI) この組み合わせによりノイズが減り、シグナルの信頼性が高まります。 スキャルピング、デイトレード、スイングトレードに最適です。 インジケーターの利点: 高速で非常に明確なシグナル インデックス、ドル、株式、FX、暗号資産など、あらゆる資産
DailySessions
Davide Zunino
4.67 (6)
The indicator represents the session boxes for the Asian, European and American sessions. It is possible to change the time of each session, such as color. It is also possible to disable the display of each session. You will find in input parameters variables to modify in format hh:mm. In Colors tab you can change the color of boxes of each sessions. If you need some implementations please contact me.
FREE
VR Pivot - これは、主要なピボットポイント(pivot)の指標です。 ピボットポイントは、最強の価格帯を識別するために使用される特別なタイプのサポートレベル(support)と抵抗(resistance)です。プロのトレーダーは、価格の反転の高い確率がある価格を決定するために逆転のポイントを使用します.レベルは、特別な数式に従って計算され、終了、開口部、最大、前の期間の最小値の価格が考慮されます。最も効果的なのは、毎日の期間です。一見すると、これらのレベルに特別なものは何もないと思われるかもしれませんが、ピボットポイントのレベルの助けを借りて価格の動きを分析すると、ほとんどの場合、これらのレベルが良好で正確な結果を示していることがわかります。 テクニカルサポート、設定およびソフトウェアの体験版は、作者のプロファイルによりリクエスト できます。 逆転ポイントは、ピボットポイントとしてだけでなく、最大利益のために可能な限り効率的に使用できるレベルとして使用することができます, 損失を最小限に抑えるために損失を停止, リスクを軽減するために、損失ゾーンにポジションを転送. インジケ
The Urgently indicator is designed to quickly determine the situation in the market, reflect the state of the market and signal profitable levels for opening trades. Market conditions change quickly enough, requiring constant calibration of trading strategies. Recommended for use in conjunction with any of the oscillators. The Urgently forex market trend indicator shows the trend direction and entry points. It smooths out price fluctuations when generating a signal by averaging the data and the
SMC Donchian Fusion ZigZag This indicator for MetaTrader 5 provides a comprehensive multi-timeframe trend analysis by fusing signals from the ZigZag indicator across three different timeframes (Entry, H1, and H4). It is designed to give you a clear and immediate understanding of trend alignment and potential entry points. Key Features: Multi-Timeframe Analysis: Combines ZigZag data from three user-defined timeframes (defaulting to M15, H1, and H4) to create a powerful, unified trend signal. Nor
The selective pin bar is designed to identify reversals. To use the selective pin bar effectively, traders typically look for Strong Rejection: The tail of the pin bar should extend significantly beyond the surrounding price action. It indicates that there was a sharp rejection of higher or lower prices during the trading period. A strong rejection suggests that the market sentiment may be changing.
FREE
Multi-Timeframe Time Gap Analysis v4.00 Professional Multi-Timeframe Time Gap Detection Indicator PRODUCT DESCRIPTION Multi-Timeframe Time Gap Analysis is a revolutionary indicator for MetaTrader 5 that combines Time Gap analysis across multiple timeframes simultaneously. Based on Smart Money concepts and designed for professional traders who need comprehensive multi-timeframe market structure analysis. MULTI-TIMEFRAME TIME GAP CONCEPT Multi-TF Time Gap is a price zone where price spent mi

Kst pro tools
Vincent Albert Feugier
KST Pro Tools – Smart Momentum Indicator Overview KST Pro Tools is an advanced momentum indicator based on Martin Pring’s classic Know Sure Thing (KST) . It has been redesigned to deliver a clean, instant, and unambiguous momentum reading , thanks to a smart and fully filtered histogram logic. This indicator shows only meaningful momentum , exactly when it matters. Indicator Components KST Line (blue) Measures the true strength of market momentum Built using 4 weighted and smoothed Rate
Phantom Edge SMC — The Ultimate Smart Money Indicator for MT5 Tired of manually drawing structures while trading SMC or ICT concepts? Let Phantom Edge SMC do the heavy lifting for you. Key Features Internal & Swing Structure: Automatically detects BOS and CHoCH across two structural levels. Order Blocks (OB): Identifies Internal and Swing OBs with automated mitigation tracking. Equal Highs / Lows: Highlights EQH / EQL to pinpoint Liquidity pools. Fair Value Gaps (FVG): Displays FVGs with
Pivot Point Supertrend (corresponds to Pivot Point Super Trend indicator from Trading View) Pivot Point Period:    Pivot point defined as highest high and highest low... input 2 = defining highest high and highest low with 2 bars on each side which are lower (for highest high) and are higher (for lowest low calculation) ATR Length  : the  ATR  calculation is based on 10 periods ATR Factor: ATR multiplied by 3
FREE
このプロダクトを購入した人は以下も購入しています
Neuro Poseidon is a new indicator by Daria Rezueva. It combines precise trading signals with adaptive TP/SL levels - creating best possible trades as a result! Message me and get  Neuro Poseidon Assistant  as a gift to automize your trading process! What makes it stand out? 1. Proven profitability on all assets and timeframes 2. Only confirmed BUY and SELL signals present on the chart 3. Adaptive TP & SL levels generated by the software for each trade 4. Easy to understand - suitable for al
SuperScalp Pro
Van Minh Nguyen
4.65 (26)
SuperScalp Pro – 高度なマルチフィルタースキャルピングインジケーターシステム SuperScalp Pro は、クラシックな Supertrend と複数のインテリジェント確認フィルターを組み合わせた高度なスキャルピングインジケーターです。M1 から H4 まで複数の時間足で効率的に動作し、XAUUSD、BTCUSD、主要 Forex 通貨ペア向けに最適化されています。 このインジケーターは明確な Buy / Sell シグナルを提供し、ATR に基づいてエントリー価格、Stop Loss、Take Profit を自動計算します。Fibonacci Take Profit 機能により、重要な価格帯で早期決済し、到達時に通知を送信します。 初期設定では Fibonacci Take Profit が有効化されており、より安定した取引体験を重視しています。チャートに適用するだけですぐ利用可能です。上級者向けに、すべてのパラメータは自由にカスタマイズできます。 EMA、RSI、ADX、Volume、VWAP、Bollinger Bands、MACD Divergence な
まず正直に言いましょう。 どんなインジケーターも、それ単体であなたを利益化させることはできません。もしそう言う人がいるなら、それは夢を売っているだけです。完璧な売買シグナル(矢印)を表示するインジケーターは、いくらでも“完璧に見せる”ことができます。正しい過去の区間を拡大して、勝ちトレードだけを切り取ればいいだけです。私たちはそれをしません。 SMC Intraday Formula はツールです。 市場構造を読み取り、最も高い確率の価格ゾーンを特定し、今この瞬間のスマートマネーの痕跡をシンプルな言葉で正確に示します。最終判断はあなたが行います。トレードを実行するのもあなたです。しかし今は「希望」ではなく「精度」でエントリーできます。 私たちはこのインジケーターを、ゴールド(XAUUSD)および主要FX通貨ペアで約3年間、日々のスキャルピングに使用してきました。M1、M5、M15、M30の主要ツールです。これは未来を予測しようとするのではなく、今まさに形成されている高確率セットアップを示し、その理由を説明します。 他のすべてのインジケーターと何が違うのか? ほとんどのトレーディングイ
Entry In The Zone and SMC Multi Timeframe is a real-time 2-in-1 market analysis tool that combines market structure analysis and a No Repaint BUY / SELL signal system into a single indicator, built on Smart Money Concepts (SMC) — a widely adopted framework used by professional traders to understand market structure. This indicator helps you see the market more clearly, make decisions based on structure rather than guesswork, and focus on high-probability zones where price is more likely to react
このインジケーターを購入された方には、以下の特典を 無料 で提供しています: 各トレードを自動で管理し、ストップロスとテイクプロフィットを設定し、戦略ルールに基づいてポジションを決済する補助ツール 「Bomber Utility」 様々な銘柄に合わせたインジケーターの設定ファイル(セットファイル) 「最小リスク」、「バランスリスク」、「待機戦略」 の3つのモードで使用できる Bomber Utility 用の設定ファイル このトレーディング戦略をすぐに導入・設定・開始できる ステップバイステップのビデオマニュアル ご注意: 上記の特典を受け取るには、MQL5のプライベートメッセージシステムを通じて販売者にご連絡ください。 オリジナルのカスタムインジケーター 「Divergence Bomber(ダイバージェンス・ボンバー)」 をご紹介します。これは、MACDのダイバージェンス(乖離)戦略に基づいた 「オールインワン」型のトレーディングシステム です。 このテクニカルインジケーターの主な目的は、価格とMACDインジケーターの間に発生するダイバージェンスを検出 し、将来の価格の動きを示す
Power Candles V3 - 自己最適化型強弱インジケーター Power Candles V3は 、通貨や銘柄の強さを、適用されたすべてのチャート上で実行可能なトレードプランに変換します。単にローソク足を色分けするだけでなく、バックグラウンドでリアルタイムの自動最適化を実行し、目の前の銘柄に対して最適なストップロス、テイクプロフィット、およびシグナルの閾値を提示します。ワンクリックで実取引に適用でき、エントリーポイント、ストップロス、テイクプロフィットのラインが正確な価格位置にチャート上に表示され、方向性を示すアラートがリアルタイムで発動します。 このツールは、Stein Investmentsのエコシステムの一部です。  18種類以上のツールをすべて閲覧し、AIを活用したセットアップの推奨事項を入手し、  https://stein.investments でコミュニティに参加しましょう クローズしたバーごとに3,000回以上のトレードシミュレーション。9つの強さの状態。2つの戦略を並行してテスト。勝率の高い設定をワンクリックで適用。 なぜこれが必要なのか ほとんどの強
SignalTech MT5 is an unique fully rule based trading system for EURUSD, USDCHF, USDJPY, AUDUSD, NZDUSD, EURJPY, AUDJPY, NZDJPY, CADJPY.  All the winning trades with chart setups are published on the comments page. 2026-05 3690 Pips (Until 05-26 NY Closed) 2026-04 2243 Pips 2026-03 2165 Pips 2026-02 2937 Pips 2026-01 2624 Pips 2025-12 1174 Pips It can generate signals with Buy/Sell Arrows and Pop-Up/Sound Alerts. Each signal has clear Entry and Stop Loss levels, which should be automatically flag
まず第一に、この取引インジケーターは再描画されず、再描画されず、遅延しないことを強調する価値があります。これにより、手動取引とロボット取引の両方に理想的なものになります。 ユーザーマニュアル:設定、入力、戦略。 アトミックアナリストは、価格の強さとモメンタムを利用して市場でより良いエッジを見つけるためのPA価格アクションインジケーターです。ノイズや誤ったシグナルを除去し、取引ポテンシャルを高めるための高度なフィルターを備えています。複雑なインジケーターの複数のレイヤーを使用して、アトミックアナリストはチャートをスキャンし、複雑な数学的計算をシンプルなシグナルと色に変換します。これにより、どのような初心者トレーダーでも理解して使用し、一貫した取引の決定を行うことができます。 「アトミックアナリスト」は、新規および経験豊富なトレーダー向けにカスタマイズされた包括的な取引ソリューションです。プレミアムインジケーターとトップノッチの機能を1つの取引戦略に組み合わせ、すべてのタイプのトレーダーにとって汎用性のある選択肢にします。 デイリートレーディングとスキャルピング戦略:高速で正確なデイ
Azimuth Pro
Ottaviano De Cicco
5 (7)
Azimuth Pro V2:MT5向けシンセティック・フラクタル構造分析と確認済みエントリー 概要 Azimuth Pro は Merkava Labs によるマルチレベルスイング構造インジケーターです。4つのネストされたスイングレイヤー、スイングアンカーVWAP、ABCパターン検出、3タイムフレーム構造フィルタリング、そして確定バーでの確認済みエントリー — 1つのチャートで、ミクロスイングからマクロサイクルまでを網羅するワークフロー。 これはブラインドシグナル製品ではありません。ロケーション、コンテキスト、タイミングを重視するトレーダーのための構造ファーストワークフローです。 V2発売記念オファー — Azimuth Pro V2をUSD 399で(次の100本)。最終価格:USD 499。 1. V2での変更点 シンセティック・マルチタイムフレームエンジン 上位タイムフレーム分析をMeridian Proと同じ独自のシンセティックアーキテクチャで一から再構築。よりクリーンなHTFコンテキスト、安定したライブ動作、従来のMTF同期問題なし。シンセティックエンジンは 固定比率タ
ご紹介     Quantum Breakout PRO は 、ブレイクアウト ゾーンの取引方法を変革する画期的な MQL5 インジケーターです。 13年以上の取引経験を持つ経験豊富なトレーダーのチームによって開発されました。     クォンタム ブレイクアウト プロ   は、革新的でダイナミックなブレイクアウト ゾーン戦略により、あなたのトレーディングの旅を新たな高みに押し上げるように設計されています。 クォンタム ブレイクアウト インジケーターは、5 つの利益ターゲット ゾーンを備えたブレイクアウト ゾーン上のシグナル矢印と、ブレイクアウト ボックスに基づいたストップロスの提案を提供します。 初心者トレーダーにもプロのトレーダーにも適しています。 量子EAチャネル:       ここをクリック 重要!購入後、インストールマニュアルを受け取るためにプライベートメッセージを送ってください。 推奨事項: 時間枠: M15 通貨ペア: GBPJPY、EURJPY、USDJPY、NZDUSD、XAUUSD アカウントの種類: ECN、Raw、またはスプレッドが非常に低い R
この製品は 2026 年の市場向けに更新され、最新の MT5 ビルドに最適化されています。 価格更新のお知らせ: Smart Trend Trading System は現在 $99 で提供されています。 次の 30 件の購入 後、価格は $199 に上がります。 特別オファー: Smart Trend Trading System を購入後、私にプライベートメッセージを送ることで、 Smart Universal EA を無料 で受け取り、Smart Trend のシグナルを自動売買に変えることができます。 Smart Trend Trading System は、リペイントなし、再描画なし、遅延なしの完全なトレーディングシステムです。よりクリーンなシグナル、より明確なトレンド方向、そしてより整理された取引方法を求めるトレーダー向けに作られています。 Online course , manual and download presets . このシステムは、トレンド検出、反転ゾーン、Smart Cloud、トレーリングストップロジック、サポートとレジスタンス、ローソク足の色分け、ア
トレンドキャッチャーインジケーター トレンドキャッチャーインジケーターは、開発者独自の適応型トレンド分析指標を組み合わせることで、市場価格の動きを分析します。短期的なノイズを除去し、根底にあるモメンタムの強さ、ボラティリティの拡大、価格構造の挙動に焦点を当てることで、真の市場方向性を特定します。また、移動平均線、RSI、ボラティリティフィルターなどの平滑化およびトレンドフィルタリング機能を備えたカスタマイズ指標も使用します。 実際の運用状況のモニタリングやその他の製品については、こちらをご覧ください: https://www.mql5.com/en/users/mechanic/seller ご注意ください。私はTelegramでEAや設定を販売していません。詐欺です。すべての設定はブログで無料で公開しています。 重要!ご購入後すぐにご連絡ください。手順とボーナスをお送りします!
Gann Made Easy   は、ミスター・ギャンの理論を使用した取引の最良の原則に基づいた、プロフェッショナルで使いやすい外国為替取引システムです。 W・D・ガン。このインジケーターは、ストップロスとテイクプロフィットレベルを含む正確な買いと売りのシグナルを提供します。 PUSH通知を利用して外出先でも取引可能です。 ご購入後、取引方法の説明と優れた追加インジケーターを無料で入手するには、私にご連絡ください! おそらく、ギャンの取引手法についてはすでに何度も聞いたことがあるでしょう。通常、ギャンの理論は初心者のトレーダーだけでなく、すでにある程度の取引経験がある人にとっても非常に複雑なものです。なぜなら、ギャンの取引手法は理論的にはそれほど簡単に適用できるものではないからです。私はその知識を磨き、最良の原則を私の外国為替インジケーターに組み込むために数年を費やしました。 このインジケーターは非常に簡単に適用できます。必要なのは、それをチャートに添付し、簡単な取引推奨事項に従うだけです。このインジケーターは常に市場分析の仕事を行い、取引の機会を探します。適切なエントリーポイントを検
FX Trend NG:次世代マルチマーケット・トレンドインテリジェンス 概要 FX Trend NG は、複数の時間足に対応したプロフェッショナル向けトレンド分析およびマーケット監視ツールです。 市場全体の構造を数秒で把握することができます。 複数のチャートを切り替える必要はありません。どの銘柄がトレンド中なのか、どこでモメンタムが弱まっているのか、そしてどの時間足で強い整合性があるのかを瞬時に確認できます。 ローンチ特別オファー – FX Trend NG を $30(6ヶ月) または $80 永久ライセンス でご利用いただけます。 すでに Stein Investments のユーザーですか? -> メッセージを送信 して、プライベートグループへアクセスしてください。 セットアップや詳細情報が必要ですか? -> Stein Investments 公式ページ をご覧ください。 1. FX Trend NG が他と異なる理由 3ステート・トレンドロジック ― Buy と Sell だけではない • 多くのインジケーターは Buy または Sell の2状態のみを表示します。
ARIPoint
Temirlan Kdyrkhan
1 (1)
ARIPoint is a powerful trading companion designed to generate high-probability entry signals with dynamic TP/SL/DP levels based on volatility. Built-in performance tracking shows win/loss stats, PP1/PP2 hits, and success rates all updated live. Key Features: Buy/Sell signals with adaptive volatility bands Real-time TP/SL/DP levels based on ATR Built-in MA Filter with optional ATR/StdDev volatility Performance stats panel (Success, Profit/Loss, PP1/PP2) Alerts via popup, sound, push, or email Cu
Quantum TrendPulse を ご紹介します。これは、   SuperTrend   、   RSI   、および Stochastic のパワーを 1 つの包括的なインジケーターに組み合わせて、取引の可能性を最大限に引き出す究極の取引ツールです。精度と効率を求めるトレーダー向けに設計されたこのインジケーターは、市場のトレンド、勢いの変化、最適なエントリー ポイントとエグジット ポイントを自信を持って特定するのに役立ちます。 主な特徴: SuperTrend 統合: 現在の市場動向に簡単に追従し、収益性の波に乗ることができます。 RSI精度: 買われすぎと売られすぎのレベルを検出し、市場の反転のタイミングに最適で、SuperTrendのフィルターとして使用されます。 確率的精度: 確率的振動を活用して、変動の激しい市場で隠れたチャンスを見つけます。SuperTrend のフィルターとして使用されます。 マルチタイムフレーム分析:   M5 から H1 または H4 まで、さまざまなタイムフレームで市場を常に把握します。 カスタマイズ可能なアラート: カスタム取引条件が満たされ
Crystal Heikin Ashi Signals - Professional Trend & Signal Detection Indicator Advanced Heikin Ashi Visualization with Intelligent Signal System for Manual & Automated Trading Final Price: $149 ---------> Price goes up $10 after every 10 sales . Limited slots available — act fast . Overview Crystal Heikin Ashi Signals is a professional-grade MetaTrader 5 indicator that combines pure Heikin Ashi candle visualization with an advanced momentum-shift detection system. Designed for both manual traders
Market Structure Order Block Dashboard MT5 は、市場構造と主要な価格反応ゾーンをチャート上で直接読み取りたいトレーダー向けに設計された MT5 インジケーターです。BOS、ChoCH、オーダーブロック、Fair Value Gap (FVG)、流動性、Kill Zones、Volume Profile、そして素早い分析のためのコンパクトなダッシュボードを組み合わせています。 本インジケーターは、市場構造、ICT、Smart Money の概念を意思決定の枠組みとして使用するトレーダーを対象としています。トレンド継続、反転の可能性、価格の不均衡、流動性ターゲット、注目ゾーンをより構造的に特定する助けとなります。 購入者向けの付属リソース 購入後、MQL5 のプライベートメッセージにてご依頼いただくと、完全な PDF ユーザーガイドとパラメータ設定のヒントを提供いたします。MQL5 のプライベートメッセージによる直接的な技術サポート。 バージョン 1.20 では 2 つの重要な追加機能があります: Pending BOS / Pending Cho
Reversion King Indicator
Eugen-alexandru Zibileanu
5 (3)
新たな王者が登場 - インジケーター + 注文管理表示(TP1 + TP2 + TP3)+ オプションのTelegramシグナル送信機能付き(無料) (完全なトレード&シグナルシステム) ゴールド向け最高のEA: Gold Slayer このインジケーターには、高度な戦略、カスタマイズ可能な注文管理システム、そしてエンベロープ拡張を組み合わせた平均回帰システムが搭載されています。さらに、RSIなど複数のインテリジェントな確認フィルターによって、高確率の反転エントリーをBUY・SELLシグナルとして検出します。 単にトレードを学ぶだけでなく、複数ポジションを効果的に管理し、過去に利益を出しているオープンポジションで損失トレードをカバーする方法も学べます。 M5向けに構築・最適化されており、流動性が高くシグナルの精度が安定しているBTCUSDとXAUUSDで優れたパフォーマンスを発揮します。 このインジケーターは、ATRを基に自動計算されたエントリー、ストップロス、テイクプロフィットレベルを備えた明確なLong・Shortシグナルを提供するため、リスク管理が最初から組み込まれています。 マ
M30/H1/H4スイング版もあります M5/M15では取りきれない大きな波を狙いたい方へ。 Gold Signal Swing Pro(M30/H1/H4対応)を販売中。 1トレードで$20〜$80+の値幅を狙う。 https://www.mql5.com/en/market/product/177643 KURAMA GOLD SIGNAL PRO(MT5版)— 7層フィルター搭載 XAUUSD完全トレードシステム リペイントなし。リドローなし。ラグなし。すべてのサインは確定後に変わりません。 購入者限定特典:買い切りライセンスをご購入いただいた方に、AI Zone Radar($59相当)+PDFマニュアルを無料プレゼント。購入後にMQL5でメッセージをお送りください。 AI Zone Radar: https://www.mql5.com/en/market/product/175834 ゴールドトレーダーのコミュニティで実際に使用され、精度と使いやすさで高評価。 あなたの問題
Trend Forecaster – Since 2023. The Trend Forecaster indicator utilizes a unique proprietary algorithm to determine entry points for a breakout trading strategy. The indicator identifies price clusters, analyzes price movement near levels, and provides a signal when the price breaks through a level. The Trend Forecaster indicator is suitable for all financial assets, including currencies (Forex), metals, stocks, indices, and cryptocurrencies. You can also adjust the indicator to work on any time
まず第一に、この取引ツールはノンリペイント、ノンリドロー、ノンラグの指標であり、プロの取引に理想的ですことを強調する価値があります。 オンラインコース、ユーザーマニュアル、デモ。 スマートプライスアクションコンセプトインジケーターは、新米から経験豊富なトレーダーまで、非常 に強力なツールです。Inner Circle Trader AnalysisやSmart Money Concepts Trading Strategiesなど、20以上の有用な指標を1つに組み合わせています。このインジケーターはスマートマネーコンセプトに焦点を当て、大手機関の取引方法を提供し、彼らの動きを予測するのに役立ちます。 特に、流動性分析に優れており、機関がどのように取引しているかを理解しやすくしています。市場のトレンドを予測し、価格の動きを慎重に分析するのに優れています。機関の戦略とトレードを合わせることで、市場の動向についてより正確な予測ができます。このインジケーターは多目的であり、市場構造を分析し、重要な注文ブロックを特定し、さまざまなパターンを認識するのに優れています。 このインジケーター
Meridian Pro
Ottaviano De Cicco
5 (2)
Meridian Pro 2.00:MT5向けプロ仕様マルチタイムフレーム・トレンドマトリクス Meridian Pro 2.00 は、MetaTrader 5 向けのプロ仕様の適応型トレンドマトリクスです。オリジナルの Meridian トレンドエンジン、クリーンなチャート ribbon、確定足ベースのシグナル矢印、8時間足 dashboard、Fuel momentum、weighted consensus、synthetic HTF processing、そしてチャート上に直接表示される上位足コンテキストラインを統合します。 目的はシンプルです。現在のトレンド、マルチタイムフレーム構造、強度、momentum、EA-ready 状態を、複数チャートに無関係なインジケータを重ねるのではなく、1つの整理された workflow で読むことです。 Meridian Pro の違い 1つの適応型エンジン - 同じ volatility-aware Meridian ロジックを M1 から W1 まで適用します。 Synthetic HTF architecture - 上位足行は下位足デ
FX Power: 通貨の強弱を分析して、より賢い取引を実現 概要 FX Power は主要通貨と金の実際の強弱をあらゆる市場状況で理解するための必須ツールです。強い通貨を買い、弱い通貨を売ることで、 FX Power は取引の意思決定を簡素化し、高い確率の取引機会を見出します。トレンドを追従する場合でも、極端なデルタ値を使用して反転を予測する場合でも、このツールはあなたの取引スタイルに完全に適応します。ただ取引するだけではなく、 FX Power で賢く取引をしましょう。 1. なぜ FX Power がトレーダーにとって非常に有益なのか 通貨と金のリアルタイム強弱分析 • FX Power は主要通貨と金の相対的な強弱を計算し、マーケットダイナミクスに関する明確な洞察を提供します。 • どの資産がリードしているか、または後れを取っているかを監視して、取引するペアを賢く選びましょう。 マルチタイムフレームの包括的なビュー • 短期、中期、長期のタイムフレームで通貨と金の強弱を追跡し、マーケットトレンドに基づいて取引戦略を調整できます。 • スキャルピングからスイングトレード
BTMM State Engine Pro is a MetaTrader 5 indicator for traders who use the Beat The Market Maker approach: Asian session context, kill zone timing, level progression, peak formation detection, and a multi-pair scanner from a single chart. It combines cycle state logic with a built-in scanner dashboard so you do not need the same tool on many charts at once. What it does Draws the Asian session range; session times can follow broker server offset or be set in inputs. Tracks level progression (L
FX Levels: あらゆる市場における非常に高精度なサポート&レジスタンス 概要 通貨ペア、株式指数、個別銘柄やコモディティなど、どのような市場でも信頼できるサポートとレジスタンスを特定したいですか? FX Levels は伝統的な “Lighthouse” メソッドと先進的な動的アプローチを融合し、ほぼ汎用的な精度を実現します。ブローカーの実務経験を活かし、自動化されたデイリー更新とリアルタイム更新を組み合わせることで、 FX Levels は反転ポイントを見つけ、利益目標を設定し、自信をもってトレードを管理するための手助けをします。今すぐ試してみて、サポート/レジスタンス分析の正確性がどれほどトレードを向上させるかを実感してください! 1. FX Levels がトレーダーにとって非常に有用な理由 非常に正確なサポート&レジスタンスゾーン • FX Levels は異なるブローカー環境でもほぼ同一のゾーンを生成するよう設計されており、データフィードの差異や時刻設定のずれによる不一致を解消します。 • つまり、どのブローカーを利用していても一貫したレベルが得られるため、戦
トレンドトレーディング は、タイミングのプルバックとブレイクアウトにより、市場で起こっているトレンドから可能な限り利益を得るように設計された指標です。確立されたトレンドの中で価格が何をしているかを分析することにより、取引の機会を見つけます。 [ インストールガイド | 更新ガイド | トラブルシューティング | よくある質問 | すべての製品 ] 自信を持って効率的に金融市場を取引する むち打ちにならずに確立されたトレンドから利益を得る 収益性の高いプルバック、ブレイクアウト、早期の逆転を認識する この指標は、独自の品質とパフォーマンスを分析します 複数時間枠のダッシュボードを実装します インジケーターは再描画されていません 電子メール/音声/視覚アラートを実装します 確立されたトレンドは多くの取引機会を提供しますが、ほとんどのトレンド指標はそれらを完全に無視しています。インジケーターの解釈はかなり簡単です: (1) トレンドの変化 (2) トレンドの方向への後退 (3) トレンドの方向へのブレイクアウト 赤いダッシュ は下降トレンド中の修正です 青いダッシュ は上昇トレンド中
RelicusRoad Pro: 定量的市場オペレーティングシステム 【期間限定】無制限アクセス 70% OFF - 2,000人超のトレーダーと共に なぜ多くのトレーダーは「完璧な」インジケーターを使っても失敗するのでしょうか? それは、文脈を無視して 単一の概念 だけでトレードしているからです。文脈のないシグナルは単なるギャンブルです。勝ち続けるには、 根拠の重なり(コンフルエンス) が必要です。 RelicusRoad Proは単なる矢印インジケーターではありません。完全な 定量的市場エコシステム です。独自のボラティリティモデリングを用いて、価格が推移する「適正価値の道(Fair Value Road)」をマッピングし、ノイズと真の構造的ブレイクを判別します。 推測はやめましょう。機関投資家レベルの「ロード・ロジック」でトレードを。 コアエンジン:「Road」アルゴリズム システムの中心となる Road Algo は、市場環境にリアルタイムで適応するダイナミックなボラティリティチャネルです。 安全ライン(平衡点) と、価格が数学的に反転しやすい 拡張レベル を投影します。 Si
多くの矢印インジケーターは、シグナルだけを表示して、その後の判断をすべてトレーダーに任せてしまいます。KT Alpha Hunter Arrows は、完整なトレードプランをチャート上に提示します。 各シグナル矢印が表示されるたびに、エントリーライン、ストップロス、4つのテイクプロフィット水準、そして現在の銘柄と時間足が今トレードに値するかどうかを示すリアルタイムのエッジ判定が、すでに描画された状態で表示されます。付属の Trade Manager EA は、あなたが手動でエントリーした後の実行管理を担当し、相場が荒れて判断がぶれやすい場面でも規律あるトレードを保ちやすくします。リペイントなし。確定足シグナルのみ。Forex、ゴールド、指数、その他あなたが取引するあらゆる銘柄に対応します。 主な機能 リペイントしない買い矢印と売り矢印を、足の確定後にのみ表示。 各シグナルに、エントリーライン、構造的ストップロス、4つのテイクプロフィット水準を表示。 Edge Dashboard が、現在のチャートで買いセットアップと売りセットアップを別々に評価。 判定システム:No Edge、Mar
サポート線と抵抗線のプロットにうんざりしていませんか? サポートレジスタンス は、非常に興味深いひねりを加えてチャート内のサポートとレジスタンスラインを自動検出およびプロットするマルチタイムフレームインジケーターです。価格レベルは時間とともにテストされ、その重要性が高まるにつれて、ラインは太くなり、暗くなります。 [ インストールガイド | 更新ガイド | トラブルシューティング | よくある質問 | すべての製品 ] 一晩でテクニカル分析を強化 チャートを閲覧せずに重要な価格レベルを検出 一目ですべての価格レベルの相対的な強さを認識する すべての取引で最大30時間のプロットラインを節約 インジケーターは、すべての価格レベルの年齢を表示します インジケーターは再描画されていません 過去および現在の価格レベルは近接によって崩壊し、現在の市場行動に合わせて調整されます。動作は、必ずしもピークではない場所に線が引かれます。 価格レベルは、時間とともに拒否されるにつれて、より暗く、より広くなります ノイズを避けるために、重要でない価格レベルは定期的にクリアされます カスタマイズ可能な時間枠の
フィルタ:
レビューなし
レビューに返信