KT Market Structure MT4

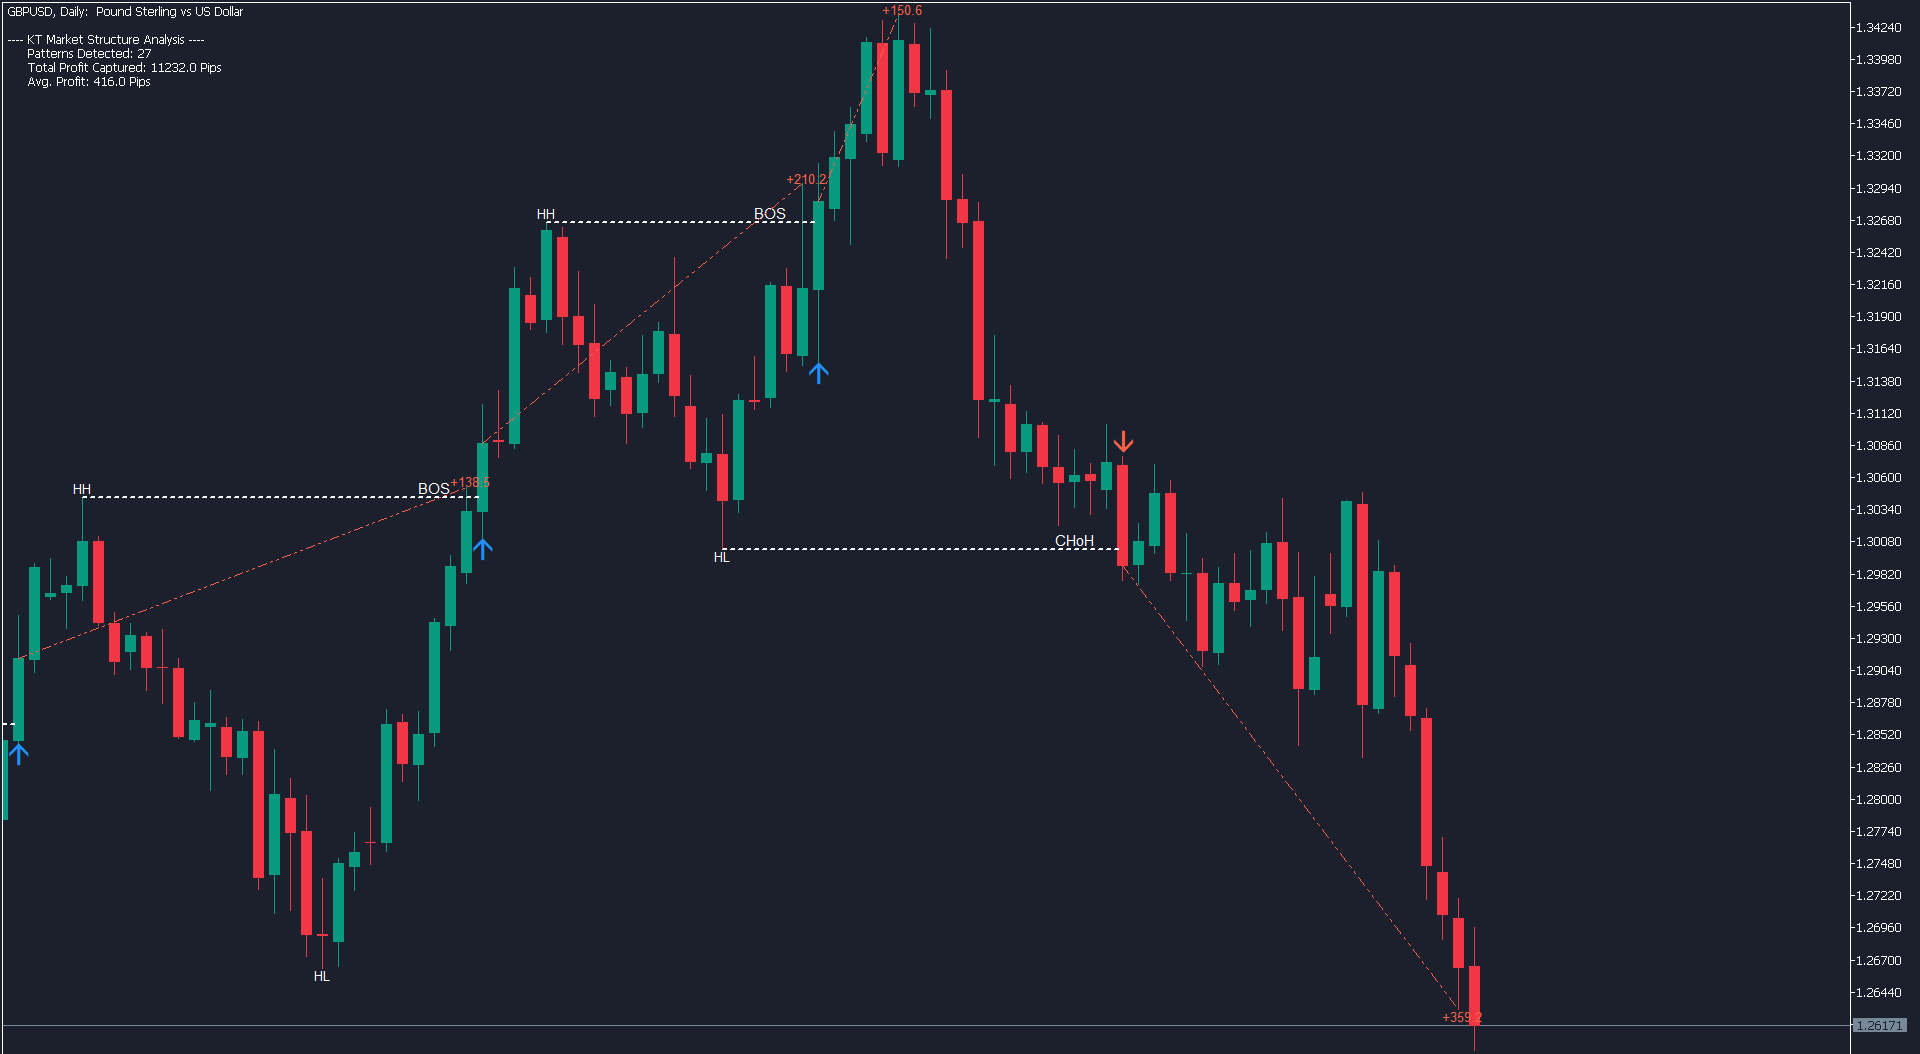
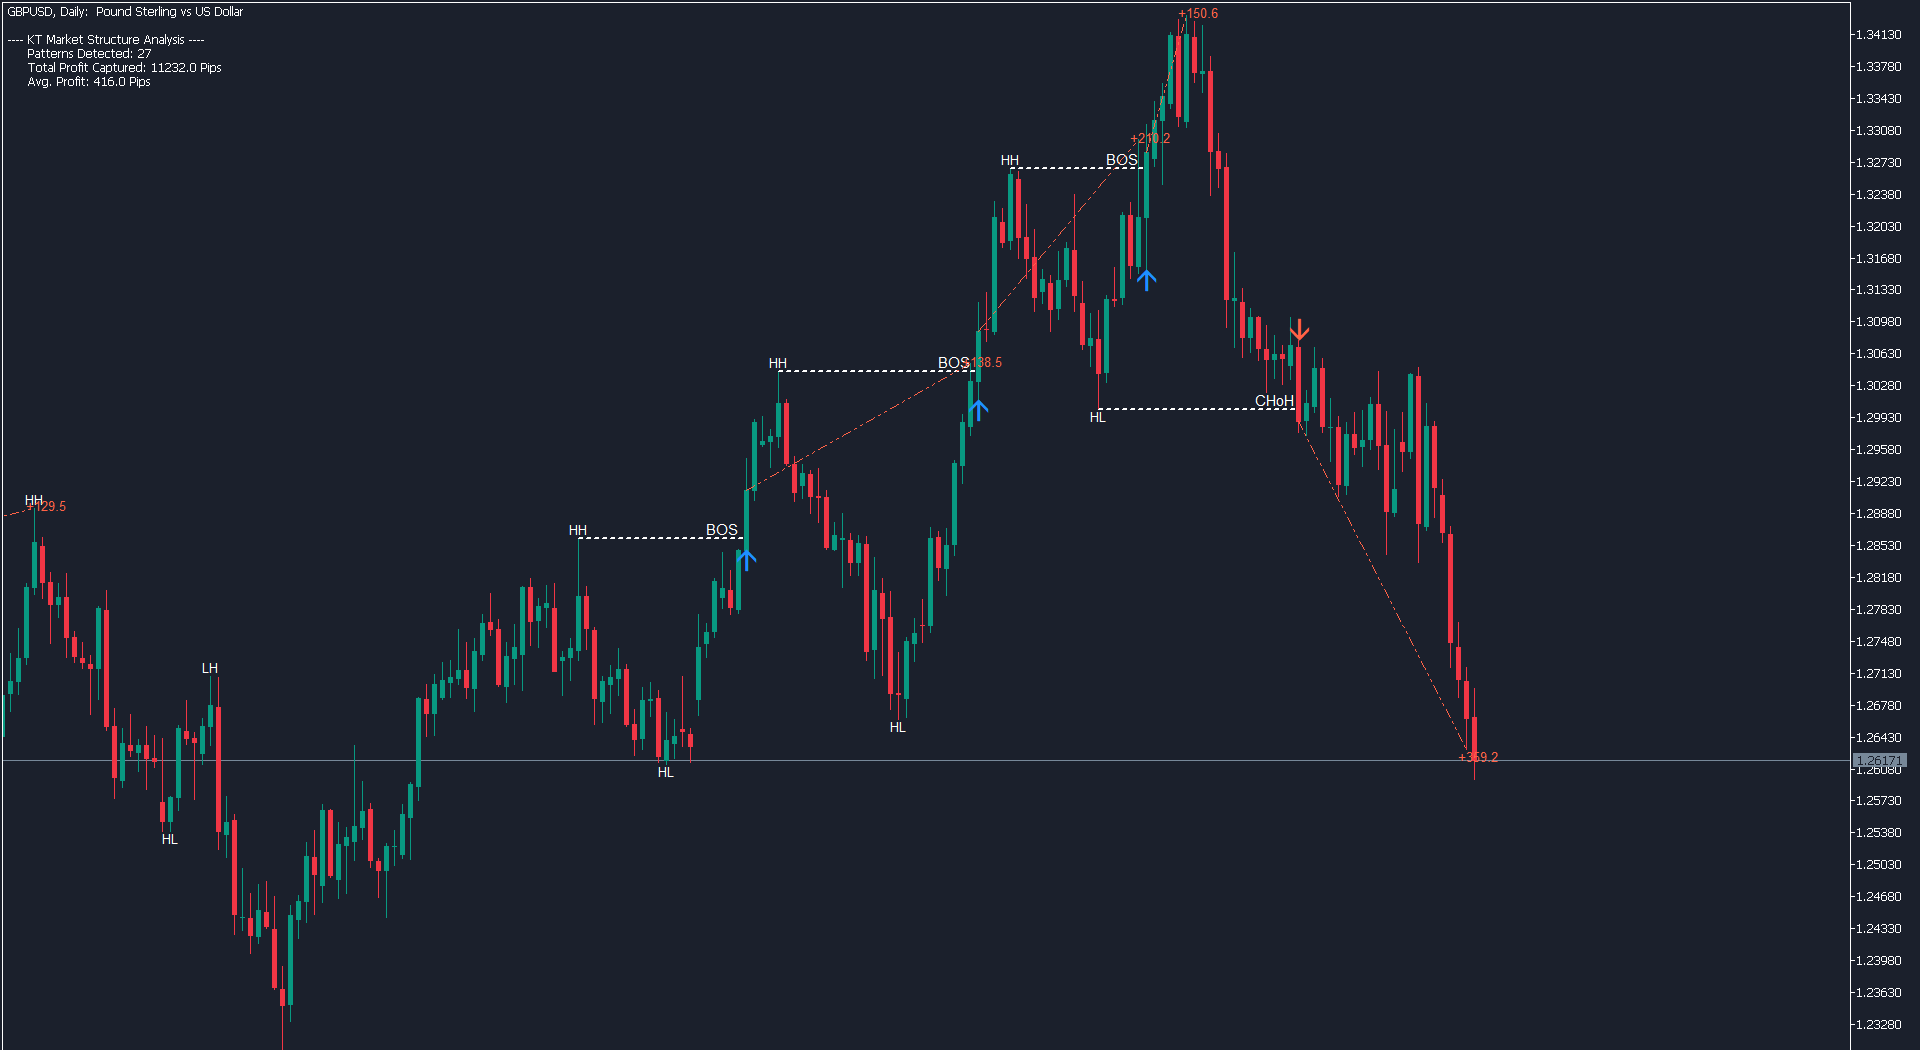
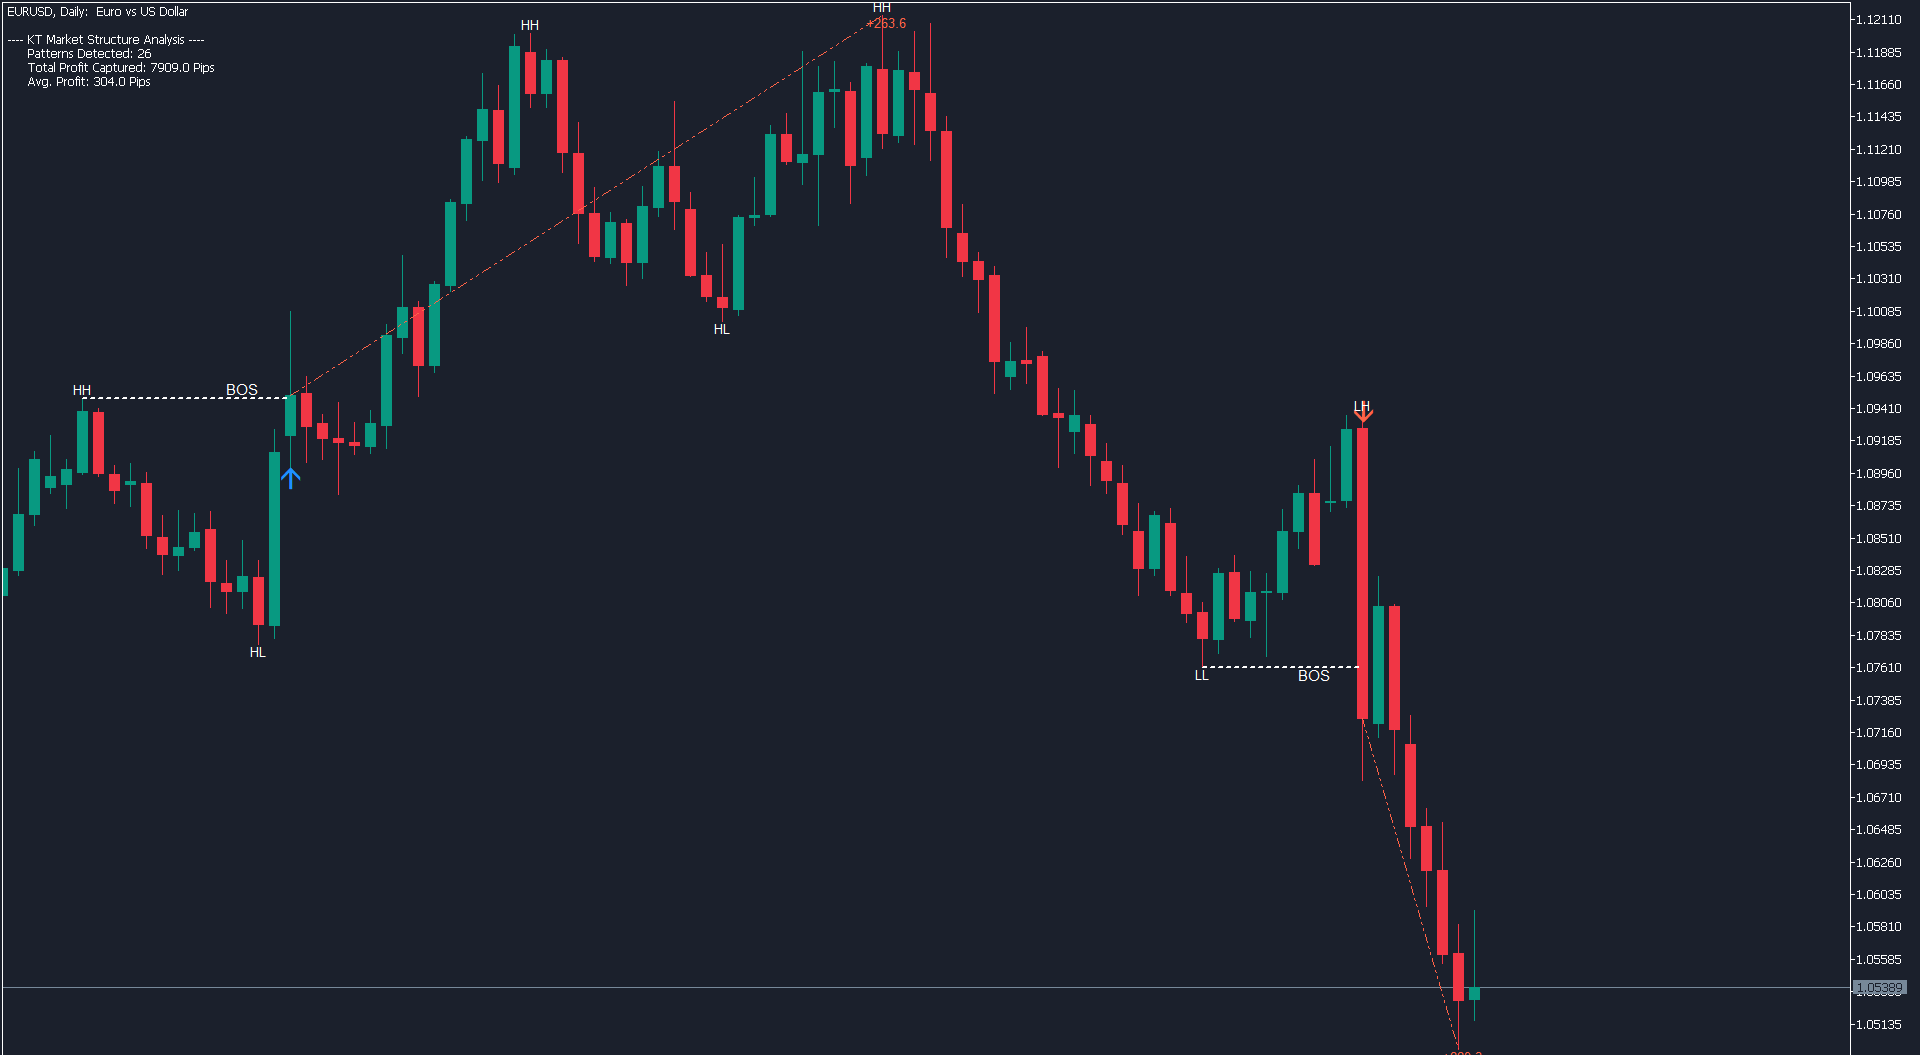
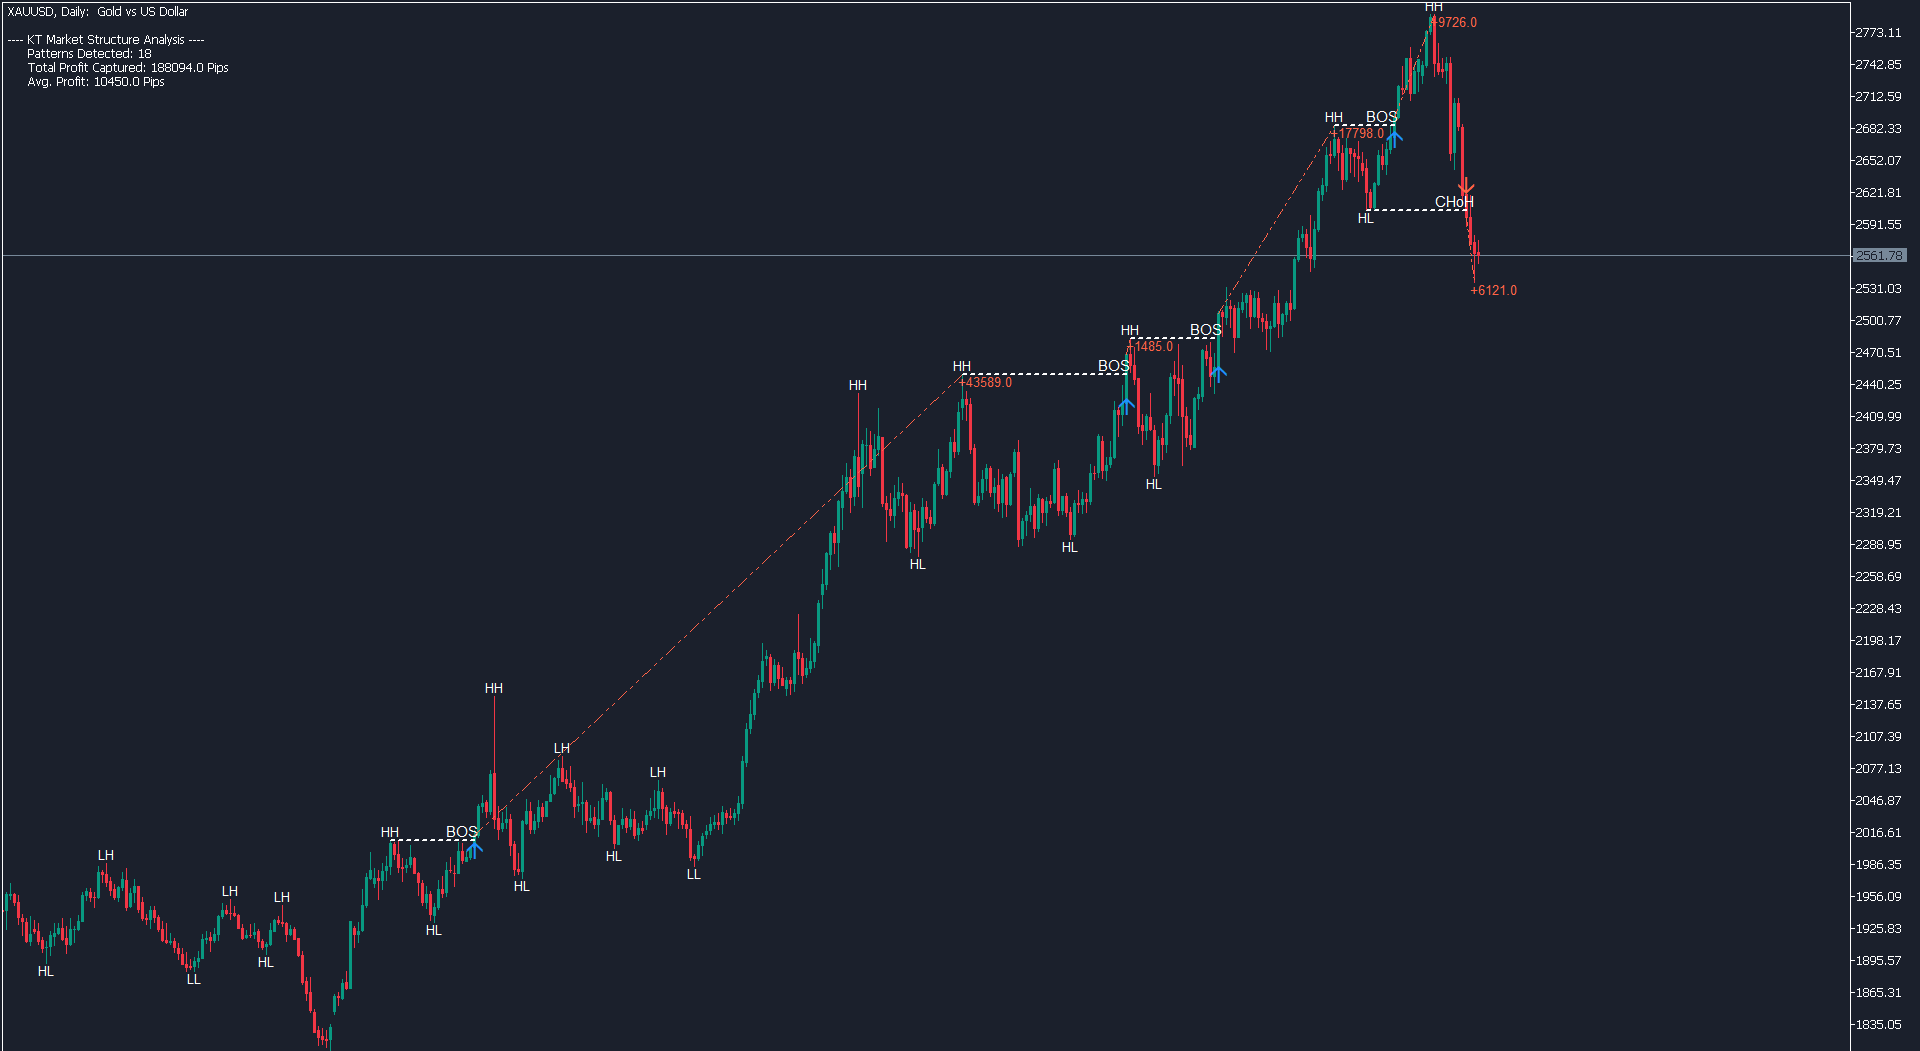
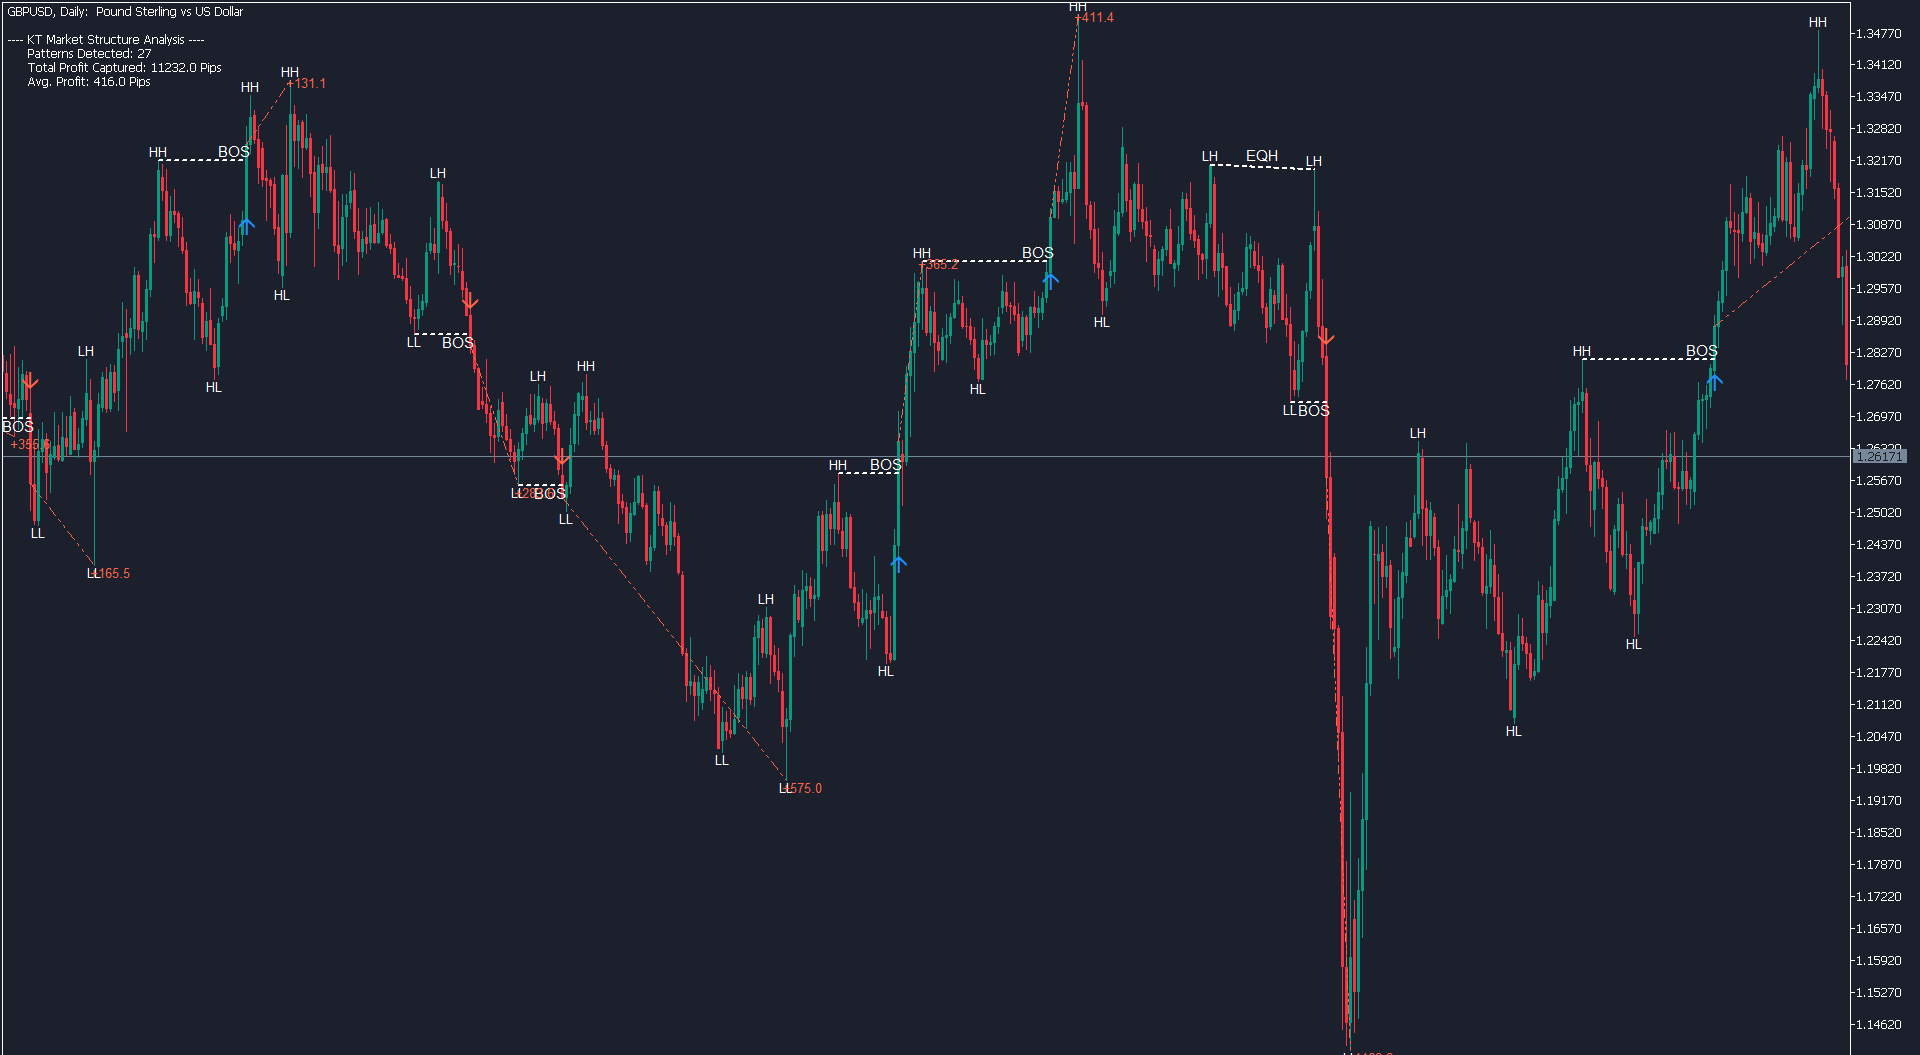
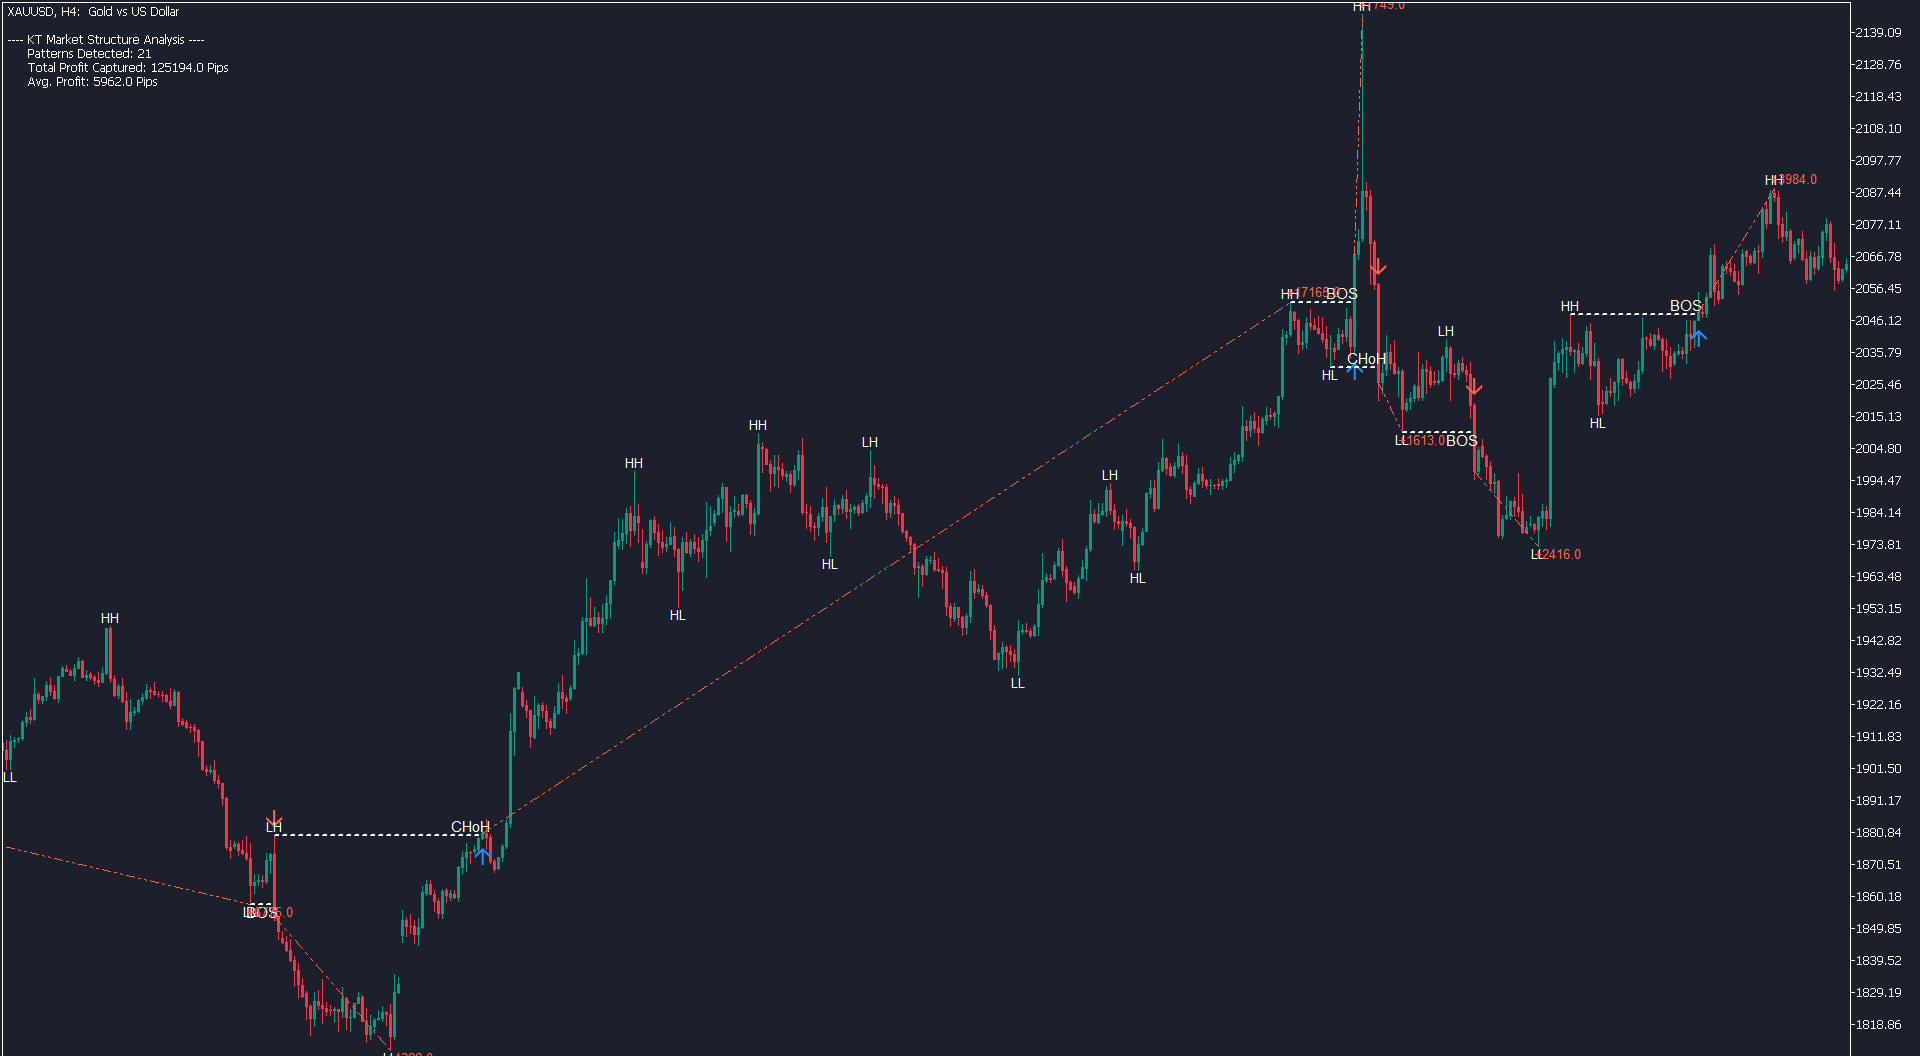
The KT Market Structure intelligently detects and displays Break of Structure (BOS), Change of Character (CHoCH), Equal Highs/Lows (EQL), and various significant swing high/low points using our proprietary algorithm for accurate pattern detection.

It also offers advanced pattern analysis by effectively demonstrating the captured profit for each pattern.

A fully automated EA based on this indicator is available here: KT Market Structure EA MT4


Features

  • Accurate Pattern Detection: Our advanced algorithm analyzes multiple data points to ensure precise identification of market structure patterns.
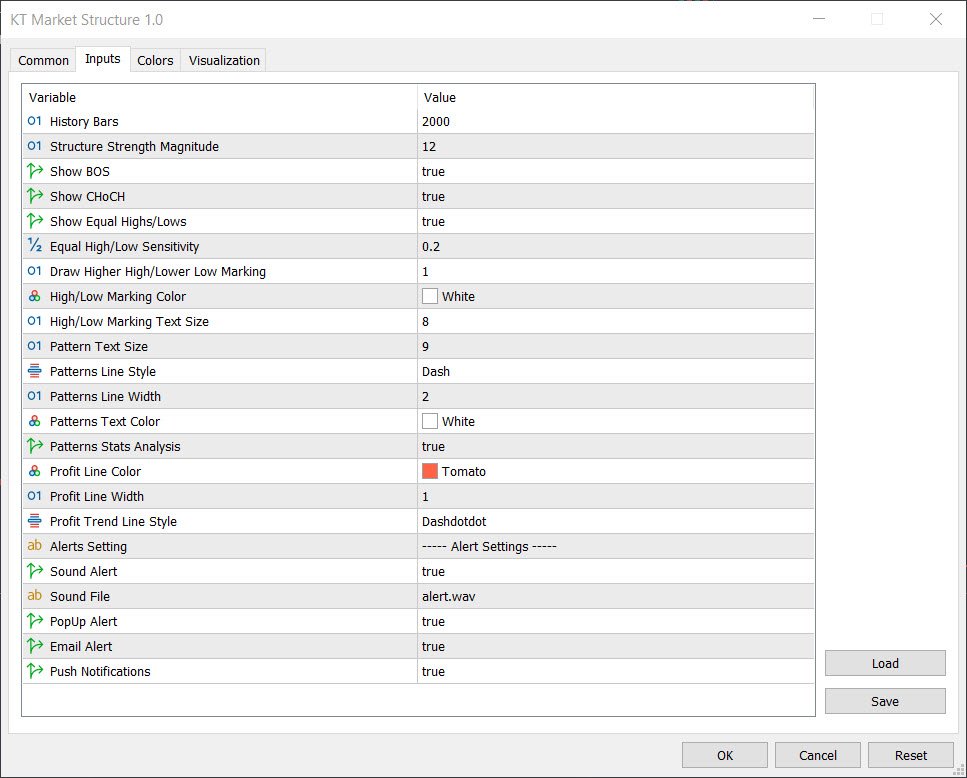
  • Customizable Structure Magnitude: Adjust the structure magnitude to suit both day trading and swing trading strategies.
  • Comprehensive Market Markings: Alongside BOS and CHoCH, the indicator also displays EQL (Equal Highs/Lows) and marks significant swing points such as LH (Lower High), HH (Higher High), HL (Higher Low), and LL (Lower Low).
  • Clutter-Free Design Enhancing SMC Strategies: The indicator boasts a minimalist design that enhances Smart Money Concepts (SMC) strategies by reducing chart clutter, allowing traders to focus on essential market structures.
  • Fully Customizable and Compatible: The indicator is fully customizable and compatible with third-party indicators, allowing seamless integration into your existing trading strategies.
  • Comprehensive MetaTrader Alerts: Stay informed with full support for all MetaTrader alerts, ensuring you never miss a critical market movement.

What is BOS?

Break of Structure (BOS) is a fundamental concept in technical analysis that signifies a significant shift in market trends or momentum. It occurs when the price action breaks through a previous higher high or lower low, indicating a potential reversal or continuation of the current trend.

Identifying BOS patterns helps traders anticipate market movements and adjust their strategies to capitalize on emerging opportunities.

What is CHoCH?

Change of Character (CHoCH) is a technical analysis term used to identify potential reversals in market trends. It occurs when the price action shifts from making higher highs and higher lows to making lower highs and lower lows, or vice versa.

This change signifies a transition in market sentiment, indicating that buyers or sellers are gaining control. Detecting CHoCH helps traders anticipate trend reversals early, allowing them to adjust their trading strategies to capitalize on new market directions.

What is EQL?

Equal Highs and Lows (EQL) refer to instances in the market where the price reaches the same high or low multiple times. This repetition indicates strong support or resistance zones in technical analysis.

Identifying EQL is crucial for traders as it highlights potential reversal points or consolidation areas, allowing them to anticipate market movements and adjust their trading strategies accordingly.

Key Takeaways

  • Understanding market structure is essential for effective Forex trading and strategy development.
  • Market structure provides clear visualizations of market dynamics, helping traders identify key levels, reduce losses, and improve trading accuracy.
  • Combining market structure with other indicators and aligning them to your unique trading style is key to achieving greater trading success.
Prodotti consigliati
I  recommend you to read the   product's blog  (manual) from start to end so that it is clear from the beginning what the indicator offers. This multi time frame and multi symbol indicator scans for engulfing and tweezer formations. The indicator can also be used in single chart mode. Combined with your own rules and techniques, this indicator will allow you to create (or enhance) your own powerful system. Features Can monitor all symbols visible in your Market Watch window at the same time. Ap
Trend Divergence Indicator: Your Essential Tool for Market Analysis The Trend Divergence Indicator is a powerful tool designed to assist traders in identifying market trends and pinpointing entry points with precision. By leveraging price divergence, this indicator enhances your trading strategy, offering reliable insights and filtering unnecessary signals. Key Features and Benefits of the Trend Divergence Indicator Accurate Trend Analysis: The Trend Divergence Indicator uses price divergence t
Fibonacci Trend Marker   — è un indicatore di tendenza che analizza il comportamento della candela corrente rispetto all’intervallo Alto-Basso (High-Low, HL) delle candele precedenti utilizzando i livelli di ritracciamento di Fibonacci. Monitora visivamente la forza del trend, segnalando un possibile indebolimento o inversione attraverso un cambio di colore della candela. Caratteristiche: Progettato per trader orientati al trend, aiuta a identificare rapidamente i cambiamenti di tendenza basat
Signal Eskiya
Vitalii Zakharuk
Signal Eskiya, in addition to channel lines, reflects entry signals in the form of arrows. Trading strategies using the channel indicator belong to the classic methods of technical analysis, are easy to execute, and therefore available even to beginners. Price ranges work equally well on any trading assets and timeframes, they can be used both independently and with additional confirmation from oscillators and market volumes. American traders say: “Trend is your friend”, which means “Trend is
I recommend you to read the   product's blog  (manual) from start to end so that it is clear from the beginning what the indicactor offers. This multi time frame and multi symbol supply and demand zone dashboard indicator sends alerts when the price has reached a supply/demand zone. It is also possible to use it to be alerted about regular double tops/bottoms instead of zones. It can be used with all time frames from M1 to MN. It is possible to use RSI, divergence (MACD, OsMA, RSI or Awesome) a
A simple and powerful trading indicator that provides clear Buy and Sell signals using large, easy-to-read arrows. The indicator is designed to help traders quickly identify potential market entries without cluttering the chart. Non-repainting signals Clear Buy (Up Arrow) and Sell (Down Arrow) alerts Works on all timeframes Clean and simple to use Ideal for both beginners and experienced traders who want straightforward trading signals.
ReSu mt4
Daniel Opoku
The Wamek Support and Resistant (WSR) Indicator is a remarkable tool that stands out in the world of technical analysis. It sets itself apart by cleverly combining price action and leading indicators to delineate support and resistance levels with a high degree of accuracy. Its unique feature is its adaptability; users can fine-tune the indicator by adjusting input parameters, enabling them to create customized support and resistance levels that suit their trading strategies. Notably, one of WSR
Super Trend Channels MT4 Indicator Looking for a versatile and powerful channel indicator for your MetaTrader 4 trading platform? Look no further than the "Super Trend Channels" indicator! This advanced tool is designed to help traders identify trend channels accurately, enabling you to make informed trading decisions with confidence. Key Features: Multi-Channel Support: The "Super Trend Channels" indicator supports multiple channels simultaneously. You can visualize various channel types, inclu
The   Angle Prices   indicator is a tool that calculates the price angle based on price analysis, interpreting the time vector in the form of price points on the price chart. In other words, the X axis and Y axis are represented as price points, so you can actually calculate the angle with two axes of the same dimension. This allows traders to obtain information about the direction of price movement and possible entry or exit points for trades. Let's look at the main characteristics and interpr
EARLY REMINDER: The Starting price is 65 price will rise soon up to 365$ and then 750$ after first 10 copies of sales. Grab this offer now! Introduction Hello, traders! Welcome to the demonstration of the Forex Beast Indicator , a comprehensive tool designed to assist aspiring traders in navigating the complexities of the forex market. This indicator incorporates seven essential components to provide a well-rounded trading experience: Moving Averages Colored Zones Support and Resistance Levels
Power Flow Binary
Ganesh Tanaji Lohar
POWER FLOW PRO — Binary Options Edition For the first time ever, the POWER FLOW PRO cumulative dominance logic is specially optimized for Binary Options trading. POWER FLOW PRO is a smart real-time pressure-flow indicator designed to detect aggressive market momentum and short-term directional dominance for fast Binary Options entries. The system analyzes: Real-time buying pressure Real-time selling pressure Momentum candle strength Cumulative dominance flow Continuation pressure to generate hig
Breakout Trend Lines
Alexander Nikolaev
5 (2)
The indicator draws lines based on the price Highs and Lows, as well as slant trend lines. Break through the trend line, High or Low usually indicates trend change (or continuation). Once the price moves through a line, and the candlestick closes, the indicator draws an appropriate arrow (also, you can enable alerts). This indicator is easy to use, but nevertheless, there are many trading strategies, which are based on a breakthrough of the trend lines. The number of candlesticks used to determi
CRT Candle Range Theory HTF MT4.   Ultimate CRT Indicator: Advanced ICT Concepts and Malaysian SnR Trading System Discounted   Price   $50  !!     Secure your lifetime access   now   before it switches to   subscription-only ! Master the Market Maker's Footprints with the Most Advanced Candle Range Theory Indicator Unlock the true power of   Smart Money Concepts (SMC)   and trade precisely like the institutions with the   Ultimate CRT Indicator . Built exclusively for serious traders, this indic
NO REPAINT ADVANCED CHART PATTERN INDICATOR By definition, a price ( chart)  pattern is a recognizable configuration of price movement that is identified using a series of  trendlines  and/or curves. When a price pattern signals a change in trend direction, it is known as a reversal pattern; a continuation pattern occurs when the trend continues in its existing direction following a brief pause. Advanced Chart Pattern Tracker is designed to find the MOST ACCURATE patterns. A special script is a
I  recommend you to read the   product's blog  (manual) from start to end so that it is clear from the beginning what the indicator offers. This multi time frame and multi symbol indicator identifies double top/bottom, head & shoulders, pennant/triangle and flag patterns. It is also possible to setup alerts only when a neckline/triangle/flagpole breakout has occured (neckline breakout = confirmed signal for top/bottoms and head & shoulders).  The indicator can also be used in single chart mode.
ROC acceleration-deceleration is the manual system for medium-term scalping. Indicator based on custom ROC system which defines bullish/bearish market and especially  acceleration-deceleration of tendention in the market's main direction. Buy arrow is plotted during bearish market when current trend decelerates and sell  arrow is plotted during bullish market when current trend decelerates. Main Indicator's Features Signals are not repaint,non-late or disappear(exept cases when system recalculat
-   Real price is 90$   - 50% Discount ( It is 45$ now ) Contact me for instruction, any questions! Introduction V Bottoms and Tops (or Fibonacci Retracement) are popular   chart patterns   among traders due to their potential for identifying trend reversals. These patterns are characterized by sharp and sudden price movements, creating a V-shaped or inverted V-shaped formation on the   chart . By recognizing these patterns, traders can anticipate potential shifts in market direction and posi
PZ Mean Reversion MT4
PZ TRADING SLU
3 (4)
Indicatore unico che implementa un approccio professionale e quantitativo al trading di reversione. Sfrutta il fatto che il prezzo devia e ritorna alla media in modo prevedibile e misurabile, il che consente regole di entrata e uscita chiare che superano di gran lunga le strategie di trading non quantitative. [ Installation Guide | Update Guide | Troubleshooting | FAQ | All Products ] Segnali di trading chiari Incredibilmente facile da scambiare Colori e dimensioni personalizzabili Implementa l
The indicator draws trend lines based on Thomas Demark algorithm. It draws lines from different timeframes on one chart. The timeframes can be higher than or equal to the timeframe of the chart, on which the indicator is used. The indicator considers breakthrough qualifiers (if the conditions are met, an additional symbol appears in the place of the breakthrough) and draws approximate targets (target line above/below the current prices) according to Demark algorithm. Recommended timeframes for t
My Point MT4
Claudia Ramona Angerer
4 (1)
Diagnosis of major and minor pivot Trend detection with many signals Can be used in all symbols Can be used in all time frames Settings: Back Show: The number of candles it displays If you need any adjustments, or have any questions or suggestions, message me How to trade: Blue: sell signal Red: buy signal Blue and red at the same time: no signal Exit signal: Opposite signal
KT Horizontal Lines MT4
KEENBASE SOFTWARE SOLUTIONS
Su MetaTrader, tracciare più   linee orizzontali   e monitorare i rispettivi livelli di prezzo può essere un’attività noiosa. Questo indicatore disegna automaticamente più linee orizzontali a intervalli uguali per impostare avvisi di prezzo, tracciare livelli di supporto e resistenza, e per altri usi manuali. Questo indicatore è perfetto per i trader Forex alle prime armi che cercano opportunità per ottenere profitti rapidi tramite acquisto e vendita. Le linee orizzontali aiutano a identificare
Ross Hook is a price pattern indicator that help traders to forecast market inversions. The activation of the pattern could identify turning points by finding the breakout SR levels or technical analysis figures like triangles, rectangles or head and shoulder. The Indicator runs in  all Brokers  using  Metatrader 4  platform and can be used in an Expert Advisor or as a support of manual trading. This indicator is composed by the OnChart and OnWindow parts: OnChart : Draws the points 1, 2 and 3 t
Implement
Vitalii Zakharuk
5 (1)
Implement analyzes market dynamics for pivot points. If you want to learn how to spot the correct reversals for consistently likely profitable trading, buy this indicator. Shows favorable moments of entering the market in stripes. Ready-made trading system. The principle of operation of the indicator is to automatically determine the current state of the market when placed on a chart, analyze historical data based on historical data and display instructions for further actions on the trader's
This indicator is suitable for seeing trends and determining the time to open a position. It is equipped with a Stop Loss position. Easy to use. Just watch the arrows provided. Indicator parameters Shift - the number of bars used for the indicator shift to Right." Step Point per Period - the number of pips for down or Up trend lines" Time Frame - Calculate @ this Time Frame." Max_Bar - the number of bars used for calcuulate indicators (if '0' then All bars to calcuulate)." Alert_On - On or Off
Questo indicatore è un indicatore per l'analisi automatica delle onde perfetto per il trading pratico! Caso... Nota:   non sono abituato a usare nomi occidentali per la classificazione delle onde a causa dell'influenza della convenzione di denominazione di Tang Lun (Tang Zhong Shuo Zen), ho chiamato l'onda base come   penna   e la banda dell'onda secondaria come   segmento   At allo stesso tempo, il segmento ha la direzione del trend. La denominazione   è principalmente segmento di trend   (que
XFibo Auto Fibonacci
Welinton Dos Reis Goncalves
5 (1)
Use with disciplined risk management. Fibonacci entry system based on the golden zone 38.2 - 61.8 where the entry is confirmed at 23.6 with indications of Take Profit 3:1. Automatically plotted Fibonacci contains retracement and expansion Fibonacci in a single indicator. Up to 77% win rate with this system. FTMO challenge pass with 0.50% risk and 1.50% R:R.
Transition Trend
Tatiana Savkevych
The Transition Trend indicator shows the points of potential market reversal. The indicator's smart algorithm detects the trend, filters out market noise and generates entry signals and exit levels. Simple, visual and efficient trend detection. Uses just one parameter for settings. The indicator does not redraw and does not lag. You can set up message alerts as sound or email. Works on all currency pairs and all timeframes. Ready-made trading system.
Italo Volume Indicator
Italo Santana Gomes
4.94 (78)
BUY INDICATOR AND GET EA FOR FREE AS A BONUS + SOME OTHER GIFTS! ITALO VOLUME INDICATOR  is the best volume indicator ever created, and why is that? The Indicator works on all time-frames and assets, indicator built after 7 years of experience on forex and many other markets. You know many volume indicators around the internet are not complete, does not help, and it's difficult to trade, but the Italo Volume Indicator is different , the Italo Volume Indicator shows the wave volume, when market
Indicator Support and Resistence plain in your chart seven lines; Red line=Resistence 3. Red line=Resistence 2. Red line=Resistence 1. Yellow line= Pivot. Green line= Support 1. Green line= Support 2. Green line= Support 3. adattable in all timeframe (minute 1, minute   5, minute   15, minute   30, Hour 1, Hour 4,Day 1,Week 1,Mounth 1); Buy under support and sell over the resistence;
Multicurrency and multitimeframe indicator of the Standard Deviation Channel. Displays the current direction of the market. On the panel, you can see breakouts and touches (by price) of the levels of the linear regression channel. In the parameters, you can specify any desired currencies and timeframes. Also, the indicator can send notifications when levels are touched. By clicking on a cell, this symbol and period will be opened. This is MTF Scanner. The key to hide the dashboard from the char
Gli utenti di questo prodotto hanno anche acquistato
Neuro Poseidon MT4
Daria Rezueva
4.94 (32)
Neuro Poseidon is a new indicator by Daria Rezueva. It combines precise trading signals with adaptive TP/SL levels - creating best possible trades as a result! Message me and get  Neuro Poseidon Assistant  as a gift to automize your trading process! What makes it stand out? 1. Proven profitability on all assets and timeframes 2. Only confirmed BUY and SELL signals present on the chart 3. Adaptive TP & SL levels generated by the software for each trade 4. Easy to understand - suitable for all
Gann Made Easy
Oleg Rodin
4.84 (165)
Gann Made Easy è un sistema di trading Forex professionale e facile da usare che si basa sui migliori principi del trading utilizzando la teoria di mr. WD Gann. L'indicatore fornisce segnali ACQUISTA e VENDI accurati, inclusi i livelli di Stop Loss e Take Profit. Puoi fare trading anche in movimento utilizzando le notifiche PUSH. CONTATTAMI DOPO L'ACQUISTO PER RICEVERE GRATUITAMENTE LE ISTRUZIONI DI TRADING E OTTIMI INDICATORI EXTRA! Probabilmente hai già sentito parlare molte volte dei metodi d
M1 Sniper
Oleg Rodin
5 (24)
M1 SNIPER è un sistema di indicatori di trading facile da usare. Si tratta di un indicatore a freccia progettato per l'intervallo temporale M1. L'indicatore può essere utilizzato come sistema autonomo per lo scalping sull'intervallo temporale M1 e come parte del tuo sistema di trading esistente. Sebbene questo sistema di trading sia stato progettato specificamente per il trading sull'intervallo temporale M1, può comunque essere utilizzato anche con altri intervalli temporali. Inizialmente ho pro
Dynamic Forex28 Navigator
Bernhard Schweigert
4.43 (7)
Dynamic Forex28 Navigator - Lo strumento di trading Forex di nuova generazione. ATTUALMENTE SCONTATO DEL 49%. Dynamic Forex28 Navigator è l'evoluzione dei nostri indicatori popolari di lunga data, che combinano la potenza di tre in uno: Advanced Currency Strength28 Indicator (695 recensioni) + Advanced Currency IMPULSE con ALERT (520 recensioni) + CS28 Combo Signals (Bonus). Dettagli sull'indicatore https://www.mql5.com/en/blogs/post/758844 Cosa offre l'indicatore di forza di nuova generazione?
Trend Catcher ind
Ramil Minniakhmetov
5 (2)
INDICATORE TREND CATCHER L'indicatore Trend Catcher analizza i movimenti dei prezzi di mercato, utilizzando una combinazione di indicatori di analisi del trend proprietari dell'autore e personalizzati. Identifica la vera direzione del mercato filtrando il rumore a breve termine e concentrandosi sulla forza del momentum sottostante, sull'espansione della volatilità e sul comportamento della struttura dei prezzi. Utilizza inoltre una combinazione di indicatori personalizzati di smoothing e filtr
KT Alpha Hunter Arrows MT4
KEENBASE SOFTWARE SOLUTIONS
La maggior parte degli indicatori a frecce ti dà un segnale e poi ti lascia capire da solo tutto il resto. KT Alpha Hunter Arrows ti offre un piano di trading completo. Ogni freccia di segnale viene visualizzata con un piano già tracciato: linea di ingresso, stop loss, quattro livelli di take profit e un verdetto edge in tempo reale che ti indica se quel simbolo e quel timeframe meritano di essere tradati in quel momento. Il pacchetto include un Trade Manager EA che gestisce l’esecuzione dopo il
Scalper Inside PRO
Alexey Minkov
4.74 (68)
Scalper Inside PRO Scalper Inside PRO is an intraday trend and scalping indicator for MetaTrader 4 that uses an exclusive algorithm to quickly detect market direction and key target levels. It automatically calculates entry, exit and multiple profit targets, and shows detailed performance statistics so you can see how different instruments and strategies performed. This helps you choose the most suitable trading instruments for the current market conditions. Additionally, you can easily integrat
Neo Wave PRO
Nikolay Raykov
5 (1)
Price & Time Market Structure Indicator A professional market structure tool that analyzes waves through both price and time — not price alone. Main Description NeoWave PRO is a professional market structure indicator for MetaTrader 4 designed for traders who want to move beyond traditional one-dimensional wave tools such as ZigZag, swing indicators, and basic high/low systems. Most wave indicators analyze only one thing: Price. But a real market wave is not only a price movement. A true wave de
PRO Renko System
Oleg Rodin
5 (30)
PRO Renko System è un sistema di trading altamente accurato appositamente progettato per il trading di grafici RENKO. Questo è un sistema universale che può essere applicato a vari strumenti di trading. Il sistema neutralizza efficacemente il cosiddetto rumore di mercato che consente di accedere a segnali di inversione accurati. L'indicatore è molto facile da usare e ha un solo parametro responsabile della generazione del segnale. Puoi facilmente adattare lo strumento a qualsiasi strumento di
Current event:  https://c.mql5.com/1/326/A2SR2025_NoMusic.gif R. Cos'è l'A2SR ?   * È un indicatore tecnico leader (nessuna riverniciatura, nessun ritardo). -- Guida : -- su https://www.mql5.com/en/blogs/post/734748/page4#comment_16532516 -- e https://www.mql5.com/en/users/yohana/blog A2SR ha una tecnica speciale per determinare i livelli di supporto (domanda) e resistenza (offerta). A differenza del modo ordinario che abbiamo visto in rete, A2SR ha un concetto originale nel determinare i li
MetaBands M4
Vahidreza Heidar Gholami
3.5 (6)
MetaBands uses powerful and unique algorithms to draw channels and detect trends so that it can provide traders with potential points for entering and exiting trades. It’s a channel indicator plus a powerful trend indicator. It includes different types of channels which can be merged to create new channels simply by using the input parameters. MetaBands uses all types of alerts to notify users about market events. Features Supports most of the channel algorithms Powerful trend detection algorith
Genesis Matrix Pro is a professional multi-timeframe trend detection indicator designed to help traders identify high-quality market alignment with clarity and structure. It combines 12 different technical indicators into one visual alignment matrix, allowing traders to quickly see when market conditions are bullish, bearish, or neutral. A signal is generated only when the selected strategies are aligned, helping reduce noise and improve decision-making. PLEASE CONTACT ME AFTER PURCHASE TO GET
Questo prodotto è stato aggiornato per il mercato 2026 e ottimizzato per le ultime build di MT5. AVVISO DI AGGIORNAMENTO PREZZO: Smart Trend Trading System è attualmente disponibile a $99 . Il prezzo aumenterà a $199 dopo i prossimi 30 acquisti . OFFERTA SPECIALE: Dopo aver acquistato Smart Trend Trading System, inviami un messaggio privato per ricevere Smart Universal EA GRATIS e trasformare i tuoi segnali Smart Trend in operazioni automatiche. Smart Trend Trading System è un sistema di tradin
Advanced Supply Demand
Bernhard Schweigert
4.91 (300)
Speciale Trading- SCONTO DEL 40% La soluzione migliore per qualsiasi trader principiante o esperto! Questo indicatore è uno strumento di trading unico, di alta qualità e conveniente, perché abbiamo incorporato una serie di funzionalità proprietarie e una nuova formula. Con questo aggiornamento, potrai visualizzare doppie zone di timeframe. Non solo potrai visualizzare un TF più alto, ma anche entrambi, il TF del grafico e il TF più alto: MOSTRA ZONE ANNIDATE. Tutti i trader che operano con Of
IQ FX Gann Levels a precision trading indicator based on W.D. Gann’s square root methods . It plots real-time, non-repainting support and resistance levels to help traders confidently spot intraday and scalping opportunities with high accuracy. William Delbert Gann (W.D. Gann) was an exceptional market analyst, whose trading technique was based on a complex blend of mathematics, geometry, astrology, and ancient mathematics which proved to be extremely accurate. Setup & Guide:  Download  MT5 Ver
PZ Swing Trading
PZ TRADING SLU
5 (3)
Protect against whipsaws: revolutionize your swing trading approach Swing Trading is the first indicator designed to detect swings in the direction of the trend and possible reversal swings. It uses the baseline swing trading approach, widely described in trading literature. The indicator studies several price and time vectors to track the aggregate trend direction and detects situations in which the market is oversold or overbought and ready to correct. [ Installation Guide | Update Guide | Tro
Scalper Vault
Oleg Rodin
5 (37)
Scalper Vault è un sistema di scalping professionale che ti fornisce tutto il necessario per scalping di successo. Questo indicatore è un sistema di trading completo che può essere utilizzato dai trader di forex e opzioni binarie. L'intervallo di tempo consigliato è M5. Il sistema fornisce segnali di freccia accurati nella direzione della tendenza. Ti fornisce anche i segnali più alti e più bassi e i livelli di mercato di Gann. Gli indicatori forniscono tutti i tipi di avvisi, comprese le notifi
Market Structure Order Block Dashboard MT4 è un indicatore MetaTrader 4 progettato per i trader che vogliono leggere la struttura di mercato e le principali zone di reazione del prezzo direttamente sul grafico. Combina BOS, ChoCH, Order Blocks, Fair Value Gaps (FVG), Liquidità, Kill Zones, Volume Profile e una dashboard compatta per un'analisi rapida. Questo indicatore è destinato ai trader che utilizzano la struttura di mercato, i concetti ICT e Smart Money come quadro decisionale. Può aiutare
L'indicatore " Dynamic Scalper System " è progettato per il metodo di scalping, ovvero per il trading all'interno di onde di trend. Testato sulle principali coppie di valute e sull'oro, è compatibile con altri strumenti di trading. Fornisce segnali per l'apertura di posizioni a breve termine lungo il trend, con ulteriore supporto al movimento dei prezzi. Il principio dell'indicatore. Le frecce grandi determinano la direzione del trend. Un algoritmo per generare segnali per lo scalping sotto fo
Versione Swing M30/H1/H4 disponibile Vuoi catturare i grandi movimenti? Gold Signal Swing Pro (M30/H1/H4). Obiettivo: $20-$80+ per trade. https://www.mql5.com/en/market/product/177643 KURAMA GOLD SIGNAL PRO (MT4) — Sistema di Trading XAUUSD Completo con Filtro a 7 Strati, TP/SL Automatico e Punteggio di Qualità NESSUN REPAINT. NESSUN RIDISEGNO. NESSUN RITARDO. Ogni segnale è permanente. Ciò che vedi è ciò che ottieni. BONUS: Acquista la licenza a vit
PZ 123 Pattern
PZ TRADING SLU
1 (1)
Unlock powerful breakout opportunities The 123 Pattern is one of the most popular, powerful and flexible chart patterns. The pattern is made up of three price points: a bottom, a peak or valley, and a Fibonacci retracement between 38.2% and 71.8%. A pattern is considered valid when the price breaks beyond the last peak or valley, moment at which the indicator plots an arrow, rises an alert, and the trade can be placed. [ Installation Guide | Update Guide | Troubleshooting | FAQ | All Products  ]
MonsterDash Harmonic Indicator is a harmonic pattern dashboard. It recognizes all major patterns. MonsterDash is a dashboard that displays all detected patterns for all symbols and (almost) all timeframes in sortable and scrollable format. Users can add their own user defined patterns . MonsterDash can open and update charts with the pattern found. Settings MonsterDash's default settings are good enough most of the time. Feel free to fine tune them to your needs. The color settings are for thos
Apollo SR Master è un indicatore di Supporto/Resistenza con caratteristiche speciali che rendono il trading con le zone di Supporto/Resistenza più semplice e affidabile. L'indicatore calcola le zone di Supporto/Resistenza in tempo reale senza alcun ritardo, rilevando i massimi e i minimi dei prezzi locali. Quindi, per confermare la nuova area SR formata, l'indicatore mostra un segnale speciale che segnala che la zona SR può essere presa in considerazione e utilizzata come un vero e proprio segna
Il rilevatore di terremoti del mercato  del sismografo. Description in English : https://www.mql5.com/en/market/product/113869?source=Site+Market+Product+Page#description How to use the Seismograph : https://www.mql5.com/en/market/product/113869#!tab=comments&page=2&comment=52806941 Create an EA : https://www.mql5.com/en/market/product/113869#!tab=comments&page=3&comment=52816509 Qualunque sia il modo in cui fai trading, vuoi assolutamente evitare di entrare nel mercato a bassa liquidità.
ATTUALMENTE SCONTATO DEL 40% La soluzione migliore per ogni principiante o trader esperto! Questo indicatore è uno strumento di trading unico, di alta qualità e conveniente perché abbiamo incorporato una serie di caratteristiche proprietarie e una nuova formula. Con un solo grafico è possibile leggere la forza delle valute per 28 coppie Forex! Immaginate come migliorerà il vostro trading perché sarete in grado di individuare l'esatto punto di innesco di una nuova tendenza o di un'opportunità
Enigmera
Ivan Stefanov
5 (8)
ENIGMERA: Il cuore del mercato Importante: La demo di MQL5.com funziona nel Strategy Tester e potrebbe non riflettere completamente le funzionalità di Enigmera. Consulta la descrizione, gli screenshot e il video per maggiori dettagli. Non esitare a inviarmi un messaggio se hai domande! Il codice dell'indicatore è stato completamente riscritto. La versione 3.0 aggiunge nuove funzionalità e corregge i bug accumulati dall'inizio dell'indicatore. Introduzione Questo indicatore e sistema di trading
Introduction to Fractal Pattern Scanner Fractal Indicator refers to the technical indicator that makes use of the fractal geometry found in the financial market. Fractal Pattern Scanner is the advanced Fractal Indicator that brings the latest trading technology after the extensive research and development work in the fractal geometry in the financial market. The most important feature in Fractal Pattern Scanner is the ability to measure the turning point probability as well as the trend probabi
Auto Optimized Parabolic RSI: Motore di Momentum 3D Avanzato La maggior parte degli indicatori per trader privati fallisce perché si affida a parametri statici che smettono di funzionare nel momento in cui la volatilità del mercato cambia. Auto Optimized Parabolic RSI risolve il problema dell'"obsolescenza dell'indicatore" ricalcolando continuamente il proprio vantaggio matematico, portando un adattamento quantitativo di livello istituzionale direttamente sul tuo terminale MT5. Il Vantaggio Prin
Trend Lines PRO
Roman Podpora
5 (1)
LINEE DI TENDENZA PRO       Aiuta a capire dove il mercato sta realmente cambiando direzione. L'indicatore mostra reali inversioni di tendenza e punti in cui i principali attori rientrano. Vedi  Linee BOS   Cambiamenti di tendenza e livelli chiave su timeframe più ampi, senza impostazioni complesse o rumore inutile. I segnali non vengono ridisegnati e rimangono sul grafico dopo la chiusura della barra. VERSIONE MT 5     -      Svela il suo massimo potenziale se abbinato all'indicatore   RFI LEVE
The Propfolio Master Suite is the ultimate all-in-one analytical workstation for professional traders. Combining the power of the Beat The Market Maker (BTMM) methodology, Smart Money Concepts (SND/Liquidity), and Advanced Volume Profile, this suite replaces multiple different indicators with one optimized engine. Monitor up to 14 pairs simultaneously from a single chart, instantly identify market cycles, and seamlessly map institutional footprints with the click of a button. The Command Center
Altri dall’autore
ACB Breakout Arrows MT5
KEENBASE SOFTWARE SOLUTIONS
3.5 (2)
L’indicatore ACB Breakout Arrows fornisce un segnale di ingresso fondamentale nel mercato rilevando uno specifico pattern di breakout. L’indicatore analizza costantemente il grafico per individuare un momentum stabile in una direzione e fornisce un segnale preciso subito prima del movimento principale. Ottieni lo scanner multi-simbolo e multi-timeframe da qui - Scanner per ACB Breakout Arrows MT5 Caratteristiche principali I livelli di Stop Loss e Take Profit sono forniti automaticamente dall’
KT Auto Support Resistance Levels: S&R multi-timeframe, Smart Zones e pannello dei livelli per MetaTrader 4/5 Massimi di swing. Pivot. Order block. Massimi e minimi precedenti. Ogni trader marca il mercato in modo leggermente diverso, e alla fine è il grafico a pagarne il prezzo. Se accumuli troppi metodi su una sola schermata, smette di essere una mappa. Diventa rumore. KT Auto Support Resistance Levels risolve questo problema. Scansiona contemporaneamente il timeframe mensile, settimanale, gio
ACB Trade Filter MT5
KEENBASE SOFTWARE SOLUTIONS
ACB Trade Filter indicator provides a way to filtering out the low probability trading entries in a trading strategy. The indicator uses a sophisticated filtration algorithm based on the market sentiment and trend. The MT4 version of the same indicator is available here ACB Trade Filter MT4 Applications Works great with our indicator ACB Breakout Arrows MT5 Filter out low probability signals from any indicator. Avoid over-trading and minimize the losses. Trade in the direction of market sentime
KT Heiken Ashi Smoothed MT4
KEENBASE SOFTWARE SOLUTIONS
KT Heiken Ashi Smoothed è una versione smussata dello Heiken Ashi standard e disegna frecce di acquisto/vendita quando la tendenza cambia. Viene tracciata una freccia di acquisto quando si passa da stato ribassista a rialzista. Viene tracciata una freccia di vendita quando si passa da rialzista a ribassista. Notifiche mobile, email, audio e pop-up incluse. Cosa è esattamente Heiken Ashi Smoothed? Filtra i falsi segnali e il rumore del Heiken Ashi standard applicando due medie mobili per render
KT Auto Support Resistance Levels: S&R multi-timeframe, Smart Zones e pannello dei livelli per MetaTrader 4/5 Massimi di swing. Pivot. Order block. Massimi e minimi precedenti. Ogni trader marca il mercato in modo leggermente diverso, e alla fine è il grafico a pagarne il prezzo. Se accumuli troppi metodi su una sola schermata, smette di essere una mappa. Diventa rumore. KT Auto Support Resistance Levels risolve questo problema. Scansiona contemporaneamente il timeframe mensile, settimanale, gio
Se fai trading nel Forex, avere informazioni dettagliate sulla forza delle valute e sulla correlazione tra coppie di valute può portare il tuo trading a un livello superiore. La correlazione ti aiuterà a dimezzare il rischio, mentre l'analisi della forza ti permetterà di massimizzare i profitti. Questo indicatore offre un approccio ibrido per selezionare le coppie di valute più appropriate, combinando l'analisi della forza delle valute e la correlazione tra coppie di valute. Come utilizzare l'a
KT Asian Breakout
KEENBASE SOFTWARE SOLUTIONS
4 (1)
KT Asian Breakout carefully analyzes the range-bound market during the Asian session and then fires a long or short trade after doing some preassessment based on its inbuilt technical analysis module. The executed orders are closed within a day before the completion of the next day session. The inbuilt technical analysis module checks for the session range and compares it with the last 20 days price movement. If it finds any erratic price movement within the session, the orders are not executed
KT Momentum Arrows MT5
KEENBASE SOFTWARE SOLUTIONS
5 (2)
L'indicatore KT Momentum Arrows si basa su una rottura momentanea calcolata utilizzando la deviazione delle bande e la volatilità emergente in una determinata direzione. Un segnale di acquisto viene generato quando il prezzo chiude al di sopra della banda superiore, mentre un segnale di vendita viene generato quando chiude al di sotto della banda inferiore. Viene utilizzato un coefficiente di magnitudo come input, che influenza sia la deviazione delle bande sia la misurazione della volatilità. I
KT Auto Fibo MT5
KEENBASE SOFTWARE SOLUTIONS
5 (1)
KT Auto Fibo traccia automaticamente i livelli di ritracciamento di Fibonacci basandosi sulla direzione della tendenza in corso. I massimi e i minimi vengono selezionati automaticamente utilizzando i punti massimi e minimi disponibili sul grafico. Puoi ingrandire, ridurre e scorrere il grafico per regolare i livelli di Fibonacci di conseguenza. Modalità Automatico:  Traccia automaticamente i livelli di Fibonacci in base all'area visibile del grafico. Manuale: Traccia i livelli di Fibonacci una
KT Heiken Ashi Smoothed MT5
KEENBASE SOFTWARE SOLUTIONS
KT Heiken Ashi Smoothed è una versione smussata dello Heiken Ashi standard e disegna frecce di acquisto/vendita quando la tendenza cambia. Viene tracciata una freccia di acquisto quando si passa da stato ribassista a rialzista. Viene tracciata una freccia di vendita quando si passa da rialzista a ribassista. Notifiche mobile, email, audio e pop-up incluse. Cosa è esattamente Heiken Ashi Smoothed? Filtra i falsi segnali e il rumore del Heiken Ashi standard applicando due medie mobili per render
KT Psar Arrows
KEENBASE SOFTWARE SOLUTIONS
KT Psar Arrows traccia frecce sul grafico utilizzando l'indicatore standard Parabolic SAR. Una freccia rialzista viene tracciata quando il massimo della candela tocca il SAR. Una freccia ribassista viene tracciata quando il minimo della candela tocca il SAR. I segnali vengono generati in tempo reale senza attendere la chiusura della candela.  Funzionalità Uno strumento utile per i trader che desiderano sperimentare strategie di trading che includono l'uso dell'indicatore Parabolic SAR.  Può ess
KT Round Numbers MT5
KEENBASE SOFTWARE SOLUTIONS
KT Round Numbers plots the round number levels which are also commonly known as psychological levels in the Forex world. In the context of Forex trading, round number levels are those levels in which there are two or more zeroes at the end. They are named as 00 levels on the chart. Some traders also consider the halfway points as a valid round number level. They are named as 50 levels on the chart. Use of round number levels in trading Round number levels work as strong support and resistance
ACB Breakout Arrows
KEENBASE SOFTWARE SOLUTIONS
4.15 (34)
L’indicatore ACB Breakout Arrows fornisce un segnale di ingresso cruciale rilevando uno specifico pattern di breakout. Monitora costantemente il grafico alla ricerca di un momentum stabile in una direzione e segnala con precisione l’ingresso poco prima del movimento principale.  Ottieni lo scanner multi-simbolo e multi-timeframe qui - Scanner per ACB Breakout Arrows MT4 Caratteristiche principali Lo Stop Loss e il Take Profit sono calcolati automaticamente dall'indicatore. Include una dashboard
ACB Trade Filter MT4
KEENBASE SOFTWARE SOLUTIONS
5 (1)
The ACB Trade Filter indicator provides a solution for filtering out the low probability trading setups in a trading strategy. The indicator uses a sophisticated filtration algorithm based on the market sentiment and trend. Applications Works great with our indicator " ACB Breakout Arrows ". Filter out low probability signals from any indicator. Avoid overtrading and minimize the losses. Trade in the direction of market sentiment and trend. Avoid the choppiness in the market. How to use Only L
KT Momentum Arrows
KEENBASE SOFTWARE SOLUTIONS
L'indicatore KT Momentum Arrows si basa su una rottura momentanea calcolata utilizzando la deviazione delle bande e la volatilità emergente in una determinata direzione. Un segnale di acquisto viene generato quando il prezzo chiude al di sopra della banda superiore, mentre un segnale di vendita viene generato quando chiude al di sotto della banda inferiore. Viene utilizzato un coefficiente di magnitudo come input, che influenza sia la deviazione delle bande sia la misurazione della volatilità. I
KT COG Advanced MT4
KEENBASE SOFTWARE SOLUTIONS
1 (1)
KT COG is an advanced implementation of the center of gravity indicator presented by John F. Ehlers in the May 2002 edition of Technical Analysis of Stocks & Commodities magazine. It's a leading indicator which can be used to identify the potential reversal points with the minimum lag. The COG oscillator catches the price swings quite effectively. MT5 version of the same indicator is available here KT COG Advanced MT5 Calculation of COG The COG indicator is consist of the two lines. The main l
KT Pin Bar
KEENBASE SOFTWARE SOLUTIONS
KT Pin Bar identifies the pin bar formation which is a type of price action pattern which depicts a sign of reversal or rejection of the trend. When combined with support and resistance, BRN and other significant levels, Pin Bar pattern proved to be a very strong sign of reversal. Basically, a pin bar is characterized by a small body relative to the bar length which is closed either in upper or lower 50% part of its length. They have very large wicks and small candle body. A pin bar candlestic
KT Trend Magic
KEENBASE SOFTWARE SOLUTIONS
KT Trend Magic shows the trend depiction on chart using the combination of market momentum and volatility. A smoothing coefficient is used to smooth out the noise from the signal.It can be used to find out the new entries or confirm the trades produced by other EA/Indicators. Usage Drag n drop MTF scanner which scans for the new signals across multiple time-frames. Find new entries in the trend direction. Improve the accuracy of other indicators when used in conjunction. Can be used as a dynami
KT Auto Fibo
KEENBASE SOFTWARE SOLUTIONS
KT Auto Fibo traccia automaticamente i livelli di ritracciamento di Fibonacci basandosi sulla direzione della tendenza in corso. I massimi e i minimi vengono selezionati automaticamente utilizzando i punti massimi e minimi disponibili sul grafico. Puoi ingrandire, ridurre e scorrere il grafico per regolare i livelli di Fibonacci di conseguenza. Modalità Automatico:  Traccia automaticamente i livelli di Fibonacci in base all'area visibile del grafico. Manuale: Traccia i livelli di Fibonacci una
KT Ichimoku Trader
KEENBASE SOFTWARE SOLUTIONS
1 (1)
KT Ichimoku Trader is a fully automated expert advisor that offers five popular trading strategies based on the Ichimoku indicator. Each strategy has it's own entry and exit method without any interference to other strategies. The Ichimoku system can be applied to all major currency pairs and metals. However, we found that it performs reasonably well mainly on two pairs.   MT5 Version is available here  https://www.mql5.com/en/market/product/35043 Features Trade up to 5 famous trading strategi
KT Volatility Oscillator
KEENBASE SOFTWARE SOLUTIONS
L'Oscillatore di Volatilità KT analizza i dati di mercato passati e presenti utilizzando una formula matematica per mostrare il risultato sotto forma di oscillatore. Le onde crescenti e decrescenti corrispondono rispettivamente a un'elevata e a una bassa volatilità dell'asset.  In poche parole, la volatilità è semplicemente una misura delle fluttuazioni di prezzo di un asset in un certo periodo di tempo. Senza volatilità, ci sarebbero pochi movimenti di mercato e i trader non potrebbero trarre p
KT COG Robot
KEENBASE SOFTWARE SOLUTIONS
KT COG Robot is a fully automated Expert Advisor based on the KT COG Indicator . The COG indicator was originally presented by John F. Ehlers in the May 2002 edition of Technical Analysis of Stocks & Commodities magazine. The EA fires a long trade when COG line cross above the signal line and a short trade is fired when the COG line cross below the signal line.  Adaptive Filtration Our adaptive filtration algorithm combines the original COG formula with the major trend direction and market acce
ACB Breakout Arrows EA
KEENBASE SOFTWARE SOLUTIONS
Questo è un Expert Advisor completamente automatizzato basato sul nostro indicatore personalizzato chiamato "ACB Breakout Arrows" . Le entrate si basano su un pattern di breakout che si verifica costantemente in entrambe le direzioni. L’intensità dei segnali può essere regolata tramite il parametro esterno "Signal Sensitivity". Conferma delle operazioni ACB Breakout Arrows EA consente di filtrare gli ingressi utilizzando un altro nostro indicatore personalizzato chiamato ACB Trade Filter . For
KT London Breakout
KEENBASE SOFTWARE SOLUTIONS
First thirty minutes are essential for a trading session. The early reaction of traders and market players sets a path for the rest of the day. KT London Breakout EA takes advantage of this phenomenon, and after analyzing the first thirty minutes of London session, it places two bidirectional pending orders. One of pending order is eventually canceled after realizing the market direction with certainty. It has been strictly tested and developed for EUR/JPY using 30-Min Time Frame. You can expe
MACD Divergence Seeker
KEENBASE SOFTWARE SOLUTIONS
KT MACD Divergence Seeker trades the regular and hidden divergence signals generated by our free indicator named KT MACD Divergence indicator. Trading the standalone divergences can be a risky affair that's why the KT MACD Divergence Seeker combines the standard divergence signals with an advanced analysis module to exploit the price inefficiencies on some FX pairs. What is the Divergence exactly? As a general conception if the price is making higher highs, then macd should also be making hig
KT Asian Breakout Indicator
KEENBASE SOFTWARE SOLUTIONS
L'indicatore KT Asian Breakout analizza una parte cruciale della sessione asiatica per generare segnali di acquisto e vendita in entrambe le direzioni, in base alla rottura del prezzo. Un segnale di acquisto si verifica quando il prezzo supera il massimo della sessione, mentre un segnale di vendita si verifica quando il prezzo scende al di sotto del minimo della sessione. Cose da ricordare Se la scatola della sessione è troppo ampia verticalmente, è consigliabile evitare di entrare in nuovi tra
MACD Divergence MT4
KEENBASE SOFTWARE SOLUTIONS
KT MACD Divergence mostra le divergenze regolari e nascoste che si formano tra il prezzo e l’oscillatore. Se la tua strategia di trading prevede un'inversione di tendenza, puoi utilizzare la divergenza regolare del MACD per identificare possibili punti di svolta. Se invece la tua strategia si basa sulla continuazione del trend, la divergenza nascosta del MACD sarà più adatta. Limitazioni di KT MACD Divergence Usare la divergenza del MACD come unico segnale d'ingresso può essere rischioso. Non
KT Bollinger Bands Trader MT4
KEENBASE SOFTWARE SOLUTIONS
KT Bollinger Bands Trader è un Expert Advisor completamente automatizzato che utilizza una strategia di ritorno alla media basata sulle bande di Bollinger durante i periodi di bassa volatilità. Il prezzo spesso reagisce sulla linea superiore o inferiore delle bande, ma non sempre si verifica un'inversione. Tuttavia, la probabilità di un’inversione è maggiore quando la volatilità è bassa. Ingressi Un trade long viene attivato quando il prezzo si posiziona correttamente al di sotto della banda in
KT CCI Divergence MT4
KEENBASE SOFTWARE SOLUTIONS
KT CCI Divergence shows the regular and hidden divergence created between the price and CCI oscillator. Divergence is one of the vital signals that depicts the upcoming price reversal in the market. Manually spotting the divergence between price and CCI can be a hectic and ambiguous task. Limitations of KT CCI Divergence   Using the CCI divergence as a standalone entry signal can be risky. Every divergence can't be interpreted as a strong reversal signal. For better results, try to combine it w
KT MA Crossover MT4
KEENBASE SOFTWARE SOLUTIONS
KT MA Crossover disegna frecce di acquisto e vendita in base all'incrocio delle medie mobili selezionate. Inoltre, genera gli avvisi appropriati e visualizza il valore MFE (Escursione Più Favorevole) per ogni segnale consecutivo. L’incrocio delle medie mobili è una delle strategie più utilizzate dai trader di tutto il mondo. Di solito si basa su una media mobile veloce e una lenta per determinare segnali di ingresso in acquisto o vendita in base alla direzione dell’incrocio. Segnale di acquisto
Filtro:
Nessuna recensione
Rispondi alla recensione