ON Trade Gann Squares

L'indicatore Quadrato di Gann è uno strumento potente di analisi di mercato basato sull'articolo "Formula Matematica per le Previsioni di Mercato" scritto da W.D. Gann. Questo strumento utilizza concetti matematici e teorie di Gann per effettuare un'analisi precisa del mercato. Utilizza i quadrati di 144, 90, 52 e anche il quadrato di 9. Inoltre, integra il metodo del  per il quadrato di 9 e la sua relazione con canali e modelli stellari di quel quadrato.

Manuale Utente e Applicazione:

Prima di utilizzare questo indicatore, è consigliabile leggere il manuale utente e contattare in caso di domande. Il manuale completo è disponibile sul nostro sito web.

È possibile acquistare la versione completa per MT5 o testare la versione gratuita per MT4. I link per entrambe le versioni sono disponibili.

Principali Caratteristiche e Funzioni:

L'indicatore Quadrato di Gann offre un set completo di strumenti per l'analisi di mercato, utilizzando concetti geometrici e teorie di Gann per decisioni precise. Le principali caratteristiche sono le seguenti:

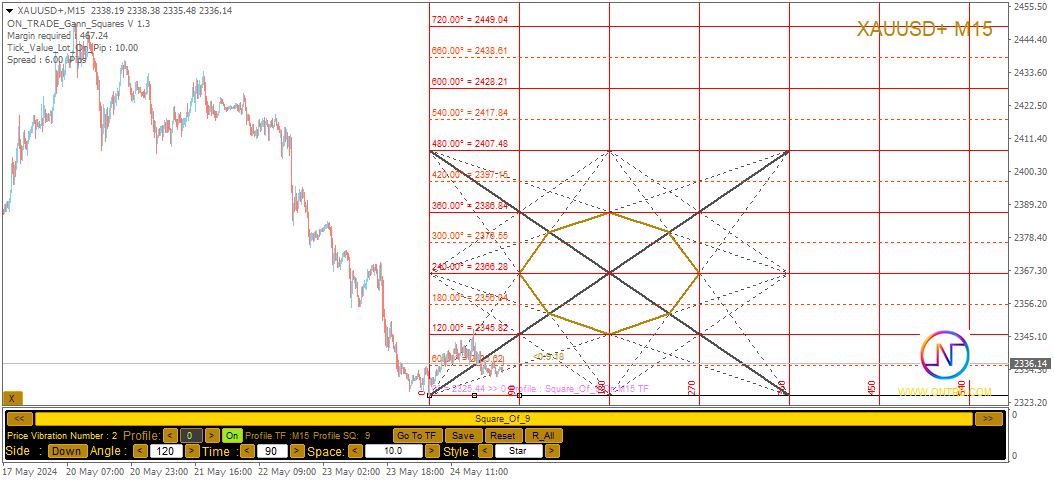
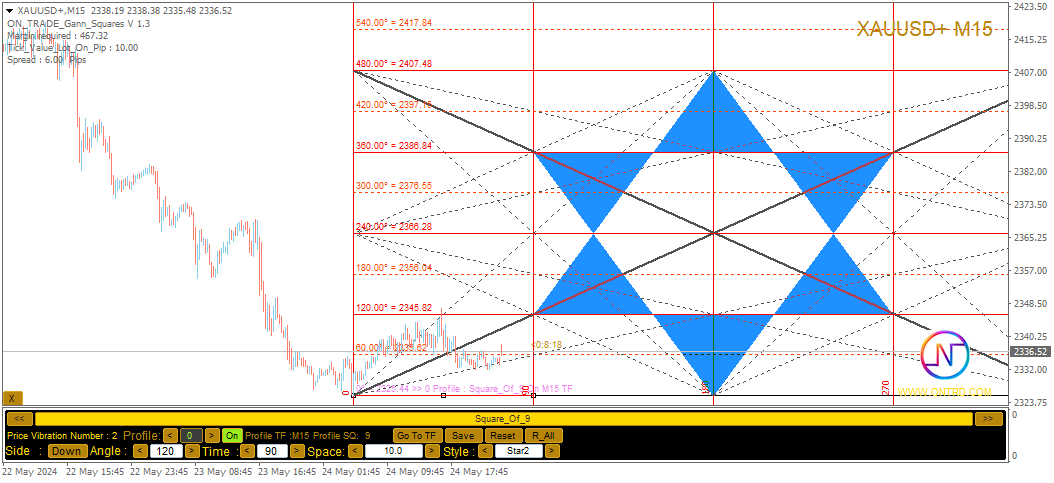
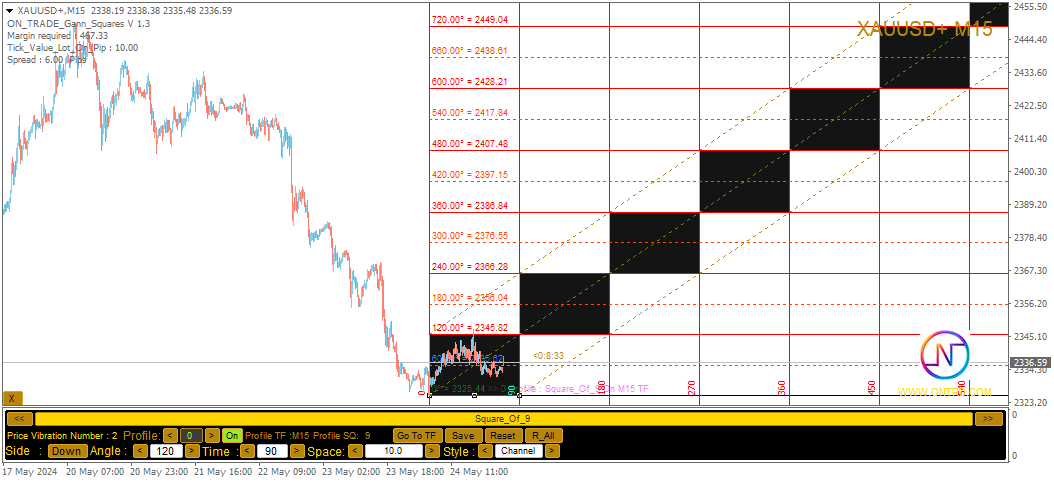
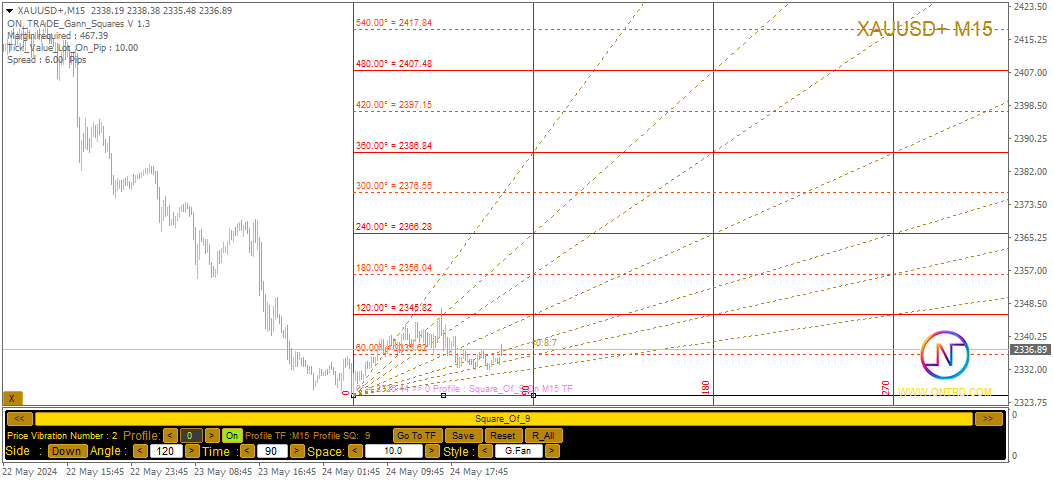
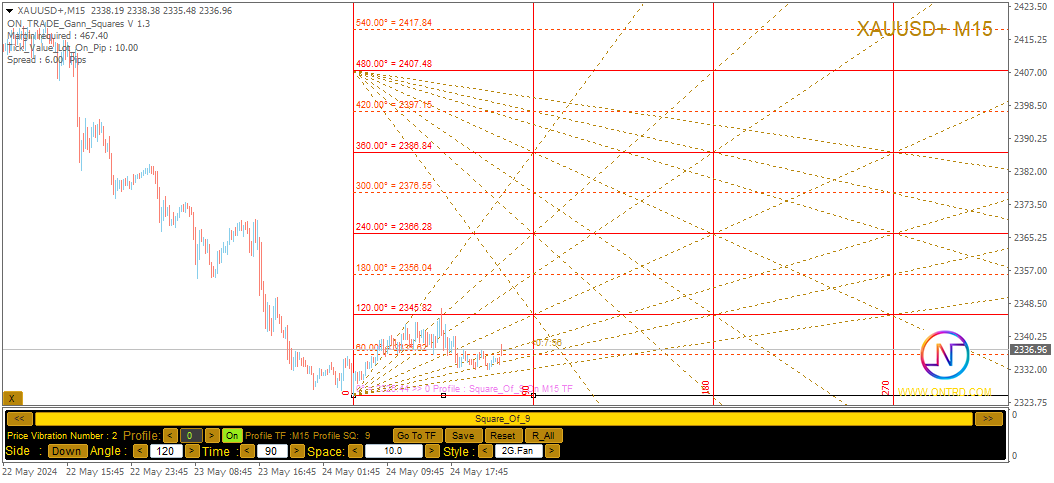
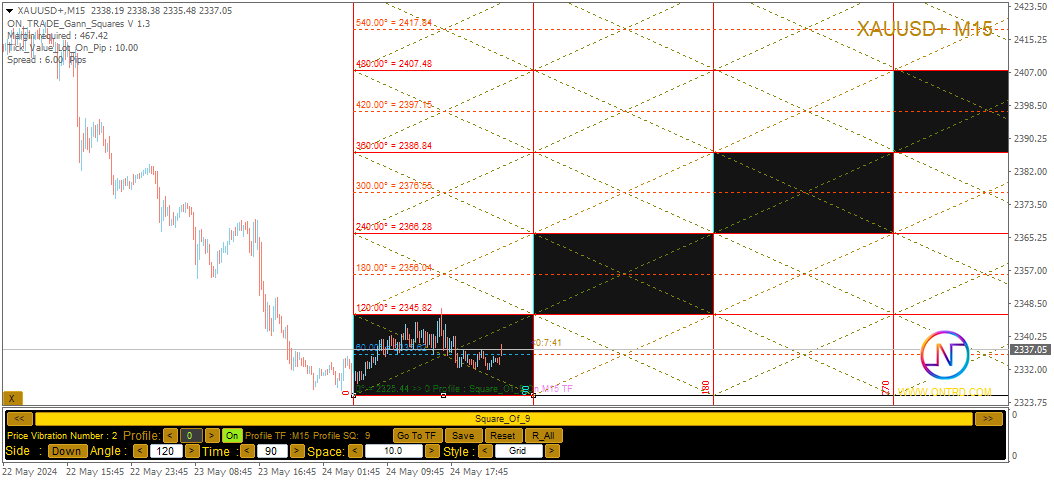
  1. Analisi del Quadrato di 9: L'indicatore può disegnare diversi elementi come linee orizzontali, modelli stellari, griglie e ventagli di Gann per il quadrato di 9. Ciò consente di visualizzare concetti geometrici di Gann sul grafico.

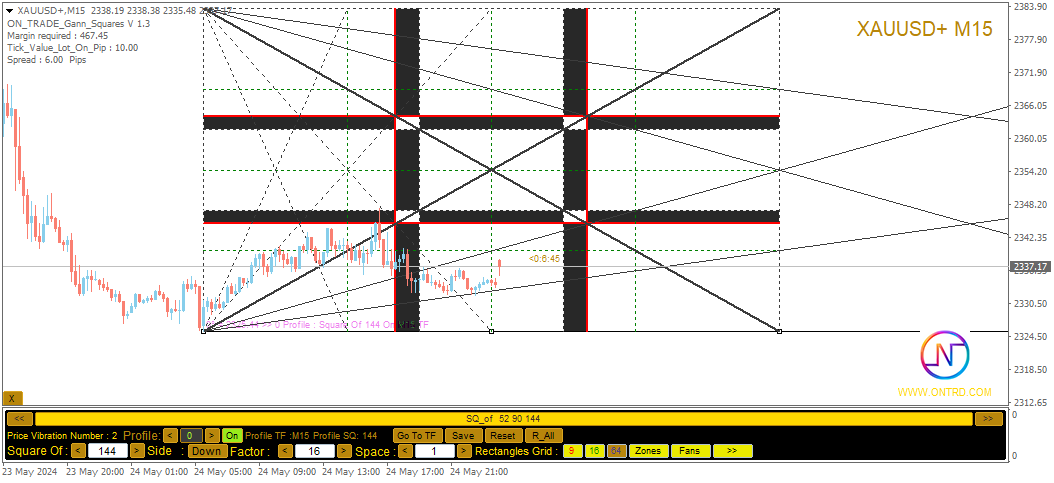
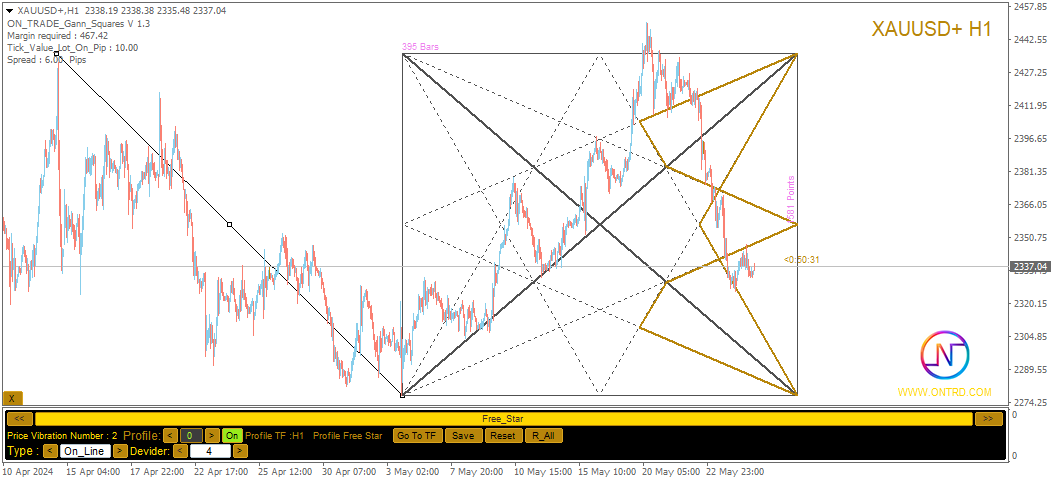
  2. Quadrati di Gann: L'indicatore disegna i quadrati di Gann di 52, 90 e 144 per visualizzare la relazione tra i movimenti dei prezzi e questi quadrati.

  3. Stelle di Gann Libere: L'indicatore può disegnare stelle di Gann libere direttamente sul grafico. Questo offre uno strumento dinamico per identificare potenziali cambiamenti di tendenza e punti di inversione.

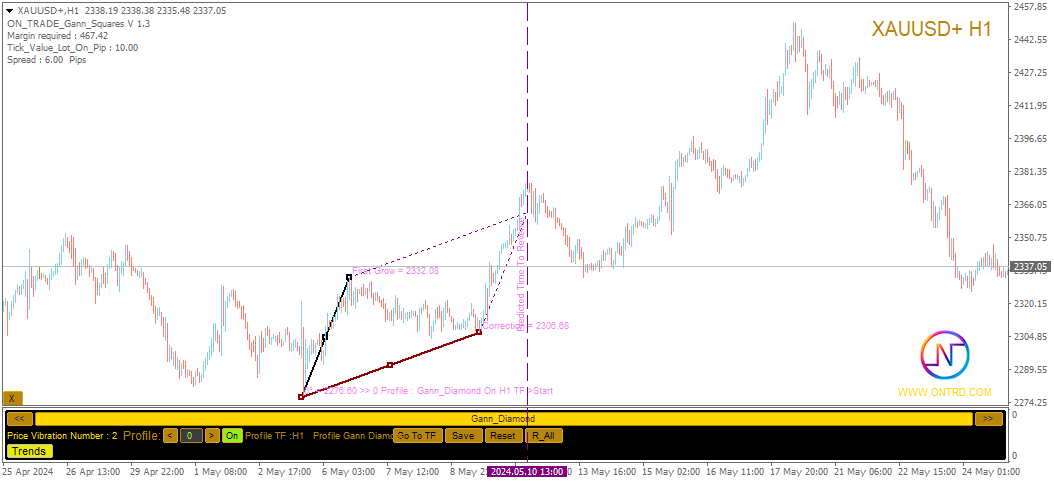
  4. Diamante di Gann: Oltre ad altri elementi, l'indicatore può disegnare anche il diamante di Gann per identificare modelli unici.

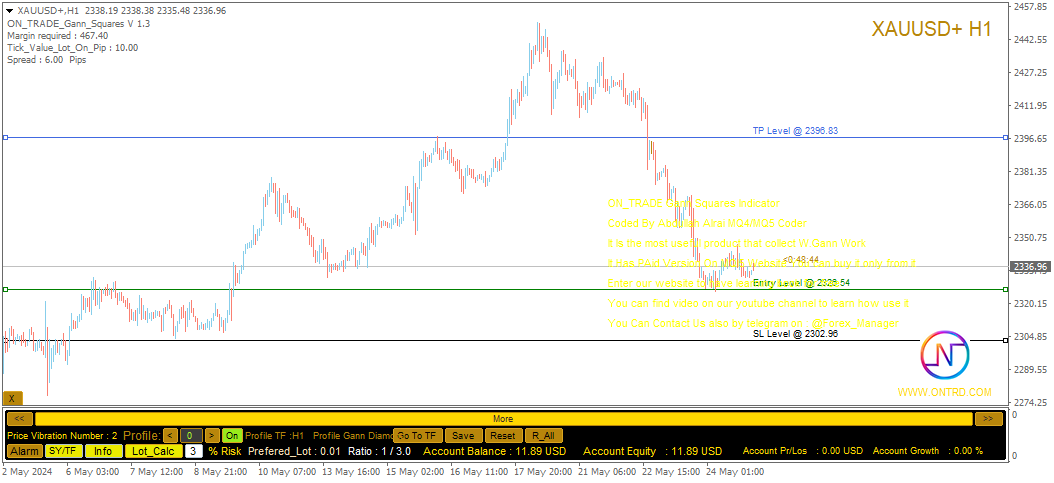
  5. Calcolatrice del Lotto: L'indicatore include una calcolatrice per determinare la dimensione ottimale del lotto per le vostre transazioni.

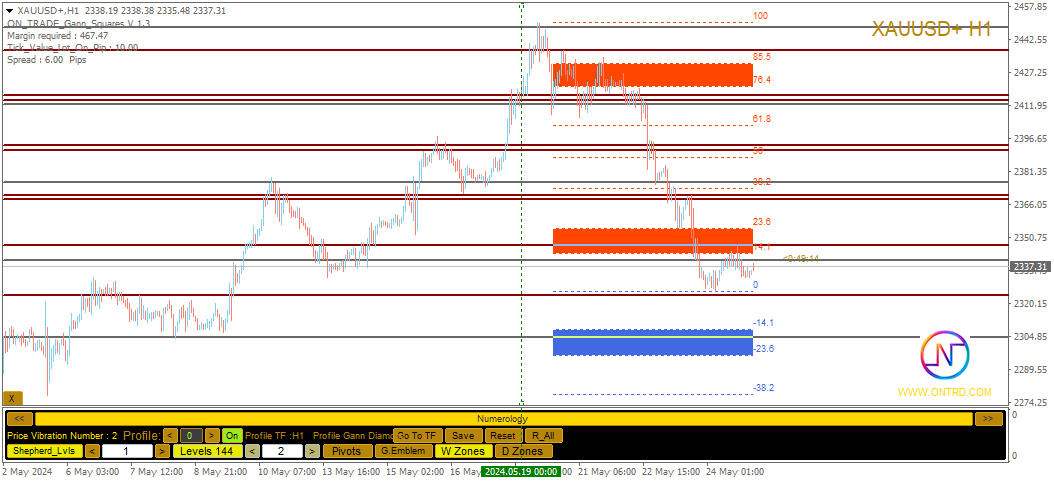
  6. Pannello User-Friendly: L'indicatore include un pannello user-friendly che consente di passare tra diverse opzioni, inclusi "Quadrato 144/90/52", "Quadrato 9", "Stella di Gann Libera", "Diamante di Gann", "Strumenti di Numerologia", "Calcolatrice del Lotto" e "Informazioni sull'Account".

  7. Gestione dei Dati: Tutte le azioni dell'indicatore vengono registrate nel profilo di trading, consentendo di caricare o eliminare questi dati in qualsiasi momento. È inoltre possibile ripristinare tutti i dati registrati con un clic.

Personalizzazione e Parametri:

L'indicatore Quadrato di Gann offre una vasta gamma di parametri per personalizzare l'aspetto e il comportamento. È possibile regolare i parametri per gli angoli, i quadrati, le stelle, i canali, le linee orizzontali, ecc., compresi i colori, gli stili e le larghezze.

Sintesi:

L'indicatore Quadrato di Gann è uno strumento versatile per i trader interessati all'analisi di Gann e ai concetti numerologici. Combinando i principi matematici e i concetti geometrici di Gann, i trader possono individuare opportunità di trading potenziali e prendere decisioni precise. Per sfruttare appieno questo strumento, si consiglia di consultare i tutorial video disponibili sul nostro sito web e di leggere le risorse in formato PDF fornite.

Ogni strumento di trading richiede una comprensione dell'applicazione efficace, oltre alla formazione con dati storici e al monitoraggio delle situazioni di mercato attuali. Come ogni indicatore o strategia di trading, una gestione responsabile del rischio è essenziale.


Prodotti consigliati
Questo indicatore è un indicatore per l'analisi automatica delle onde perfetto per il trading pratico! Caso... Nota:   non sono abituato a usare nomi occidentali per la classificazione delle onde a causa dell'influenza della convenzione di denominazione di Tang Lun (Tang Zhong Shuo Zen), ho chiamato l'onda base come   penna   e la banda dell'onda secondaria come   segmento   At allo stesso tempo, il segmento ha la direzione del trend. La denominazione   è principalmente segmento di trend   (que
Pyro Trend
Oleksii Ferbei
Pyro Trend is a new product that allows you to identify the current market phase (uptrend, downtrend or flat). The indicator is applicable for any data and periods. The middle of the trend wave, as well as the edges, are places of special heat and market behavior; when writing the indicator, an attempt was made to implement precisely finding the middle. Pyro Trend is a trend indicator that uses an original calculation algorithm. This indicator paints arrows in different colors depending on the
Introduction to Fractal Pattern Scanner Fractal Indicator refers to the technical indicator that makes use of the fractal geometry found in the financial market. Fractal Pattern Scanner is the advanced Fractal Indicator that brings the latest trading technology after the extensive research and development work in the fractal geometry in the financial market. The most important feature in Fractal Pattern Scanner is the ability to measure the turning point probability as well as the trend probabi
Algo Pumping MT4
Ihor Otkydach
4.69 (16)
PUMPING STATION – La tua strategia personale "all inclusive" Ti presentiamo PUMPING STATION — un indicatore Forex rivoluzionario che trasformerà il tuo modo di fare trading in un’esperienza efficace ed entusiasmante. Non si tratta solo di un assistente, ma di un vero e proprio sistema di trading completo con potenti algoritmi che ti aiuteranno a operare in modo più stabile. Acquistando questo prodotto, riceverai GRATUITAMENTE: File di configurazione esclusivi: per un'impostazione automatica e pr
Pisces TheProfitZone "Pisces TheProfitZone MT4 Indicator Powered byFxGangster" This indicator will calculate new support and resistant zone everyday, and that give us a trading zone such as thats telling us TP and SL, So it still telling us for where should the price will go reach? Fore Example. Uptrend : If Price can stay upper a Line and price close higher above a Line, then the price will continue go up to reach next Line. Downtrend : If Price can't pass to stay upper a Line and the price
RSI Jurik
Augustine Kamatu
Introducing RSI Jurik—an innovative indicator designed to revolutionize your forex trading strategy by combining custom moving averages based on the Relative Strength Index (RSI) with the MetaTrader 4 indicator, RSI. Jurik moving averages are renowned for their accuracy and reliability in analyzing price movements in the forex market. They provide traders with smoother representations of price action, reducing noise and offering clearer signals for identifying trends and potential reversals.
FREE
Elliott Wave Trend was designed for the scientific wave counting. This tool focuses to get rid of the vagueness of the classic Elliott Wave Counting using the guideline from the template and pattern approach. In doing so, firstly Elliott Wave Trend offers the template for your wave counting. Secondly, it offers Wave Structural Score to assist to identify accurate wave formation. It offers both impulse wave Structural Score and corrective wave Structure Score. Structural Score is the rating to sh
Signal Eskiya
Vitalii Zakharuk
Signal Eskiya, in addition to channel lines, reflects entry signals in the form of arrows. Trading strategies using the channel indicator belong to the classic methods of technical analysis, are easy to execute, and therefore available even to beginners. Price ranges work equally well on any trading assets and timeframes, they can be used both independently and with additional confirmation from oscillators and market volumes. American traders say: “Trend is your friend”, which means “Trend is
Cupid Signal Fx
Damrongwit Kongtong
The principle of this indicator is very simple: detecting the return point with Stochastic Oscillator, then monitoring the trend by using the Moving Average and finally predicting BUY and SELL signal with arrows, alerts and notifications. The parameters are fixed and automatically calculated on each timeframe. Example: If you install indicator on EURUSD, the indicator will detect the return point when the Stochastic Oscillator show "cross up" of the main line/signal line at the below position of
Sell Signall
Dmitriy Kashevich
This indicator is named so for a reason, because it will show the reverse side of the market. It has several math indicators built in that are tuned to show the best signals for currency pairs! Ideally proved to be in work on the M5-M15 no more and no less! Only at the same time it shows up to 86.5% of correct signals! The settings include the colors of the arrows, the alert, and the same parameters so that you can reconfigure the indicator and trade on cryptocurrency and raw materials! If
Introduction to Harmonic Volatility Indicator Harmonic Volatility Indicator is the first technical analysis applying the Fibonacci analysis to the financial volatility. Harmonic volatility indicator is another level of price action trading tool, which combines robust Fibonacci ratios (0.618, 0.382, etc.) with volatility. Originally, Harmonic Volatility Indicator was developed to overcome the limitation and the weakness of Gann’s Angle, also known as Gann’s Fan. We have demonstrated that Harmonic
Moving Pivot Average    The pivot indicator compares the selected period with its counterpart from the previous period. The indicator uses very flexible algorithm for pivot value calculating. It allows you to allocate in days a certain time intervals (custom bars) and calculate the average pivot value based on High, Low and Close prices of these bars. How many custom bars will be taken into account is determined by the "Days" setting. The pivot line can be considered an average trend line and us
This is  a dashboard indicator that displays the Average Level of each selected currency pairs that filters and gives us a signal for overbought (>=90%) or if price at extreme peak above 90, and/or oversold (<=10%) or if price at extreme peak below 10. The calculation is using Relative Strength Index default periods (2 & 9) applied to three different higher time frames H4,D1,&W1. This won't change or altered even if you change symbol or switch to lower time frames or even in monthly and year
This Indicator is use the ZigZag to calculate the Upper and  Lower Bound and the uptrend and the downtrned. Red for downtrend, Green for uptrend and Yellow is for the horizontal trend this horizontal trend also bookmarked the upper limited and the lower limited the the price swings.  Or in simple the Support and the Resistance level. However, You may use the Heikin Ashi to confirm the trend of the buy sell signal above. I cannot guarantee the win rate, Nevertheless, you must study well the timef
Introduction to Chart Pattern MT Chart Pattern MT is a chart pattern scanner to detect the triangle pattern, falling wedge pattern, rising wedge pattern, channel pattern and so on. Chart Pattern MT uses highly sophisticated chart pattern detection algorithm. However, we have designed it in the easy to use with intuitive user interface. Chart Pattern MT will show all the patterns in your chart in the most efficient format for your trading. You do not have to do tedious manual pattern detection an
Dear traders I am happy to introduce to you my new tool called "Brilliant Oscillator" Indicator. This is one of the indicators that can be used as a stand alone indicator. WHAT I LIKE ABOUT THIS TOOL IS Fast and reliable signals Purpose The purpose of this tool is to assist both newbie and Advanced traders to analyze the market with high level of accuracy in both bearish and bullish market trends. The inputs In the input section you will be able to change colors of the indicator only. Currency p
I speak in Hungarian. Magyarul beszélek benne. - You can find the indicator by my name. Which is in the picture and the video. On mql5.com.  " Utam MA High Low" - Megkeresheti az indikátort a nevemnél. Ami a képen és a videóban van. Az mql5.com-on.  " Utam MA High Low" Első felvétel. https://www.youtube.com/watch?v=YzmcyO50YdM&amp ;ab_channel=GyulaKlein (Első felvétel.   https://www.youtube.com/watch?v=FfqvT-i9TPk&feature=youtu.be Első felvétel. https://www.youtube.com/watch?v=MapbQrJ0uPU&t=
Questo indicatore funziona con la teoria delle onde di Elliott in due modi: Modalità automatica: In questa modalità, l'indicatore rileverà automaticamente le cinque onde motrici sul grafico in conformità alla teoria delle onde di Elliott. Fornirà previsioni e individuerà potenziali zone di inversione. Inoltre, avrà la capacità di generare avvisi e messaggi push per informare i trader sugli sviluppi importanti. Questa funzionalità automatica semplifica il processo di identificazione e analisi dei
My indicator is 1000%, it never repaints, it works in every time period, there is only 1 variable, it sends notifications to your phone even if you are on vacation instead of at work, in a meeting, and there is also a robot version of this indicator With a single indicator you can get rid of indicator garbage It is especially suitable for scalping in the m1 and m5 time frames on the gold chart, and you can see long trends in the h1 time frame.
Algo Trading Indicaor  With this indicator , you’ll have zones and trends that hight probability the price will reverse from it. so will gives you all the help that you need  Why should you join us !?  1-This indicator is logical since it’s working in previous days movement , to predict the future movements. 2-Algo trading indicator will help you to draw trends which is special and are too strong than the basics trend , trends will change with the frame time that you work on . 3-We can use
Fibonacci Currency Strength Meter (FCSM) Early Access Sale!! This new product is still in the process of adding new features and settings. For early bird buyers. The Price will be 50% Sale. In a few weeks, the product will be done. Go Grab your copy while it's still cheap. More details will be added soon. Things to be added. Alert Levels Mobile and Email Alert From it's name, Fibonacci Currency Strength Meter is a combination of Fibonacci levels and Currency Strength Meter. The plot of Fibona
Breakout Hunter SR
Mazhar Ul Hassan Noorul Hassan Noor Ul Hassan
Overview Breakout Hunter is a powerful automated trading bot designed to identify and capitalize on breakouts from key Support & Resistance levels. It continuously scans the market for high-probability breakout opportunities, allowing traders to capture strong price movements with precision. Key Features Support & Resistance Detection: Identifies strong market levels to pinpoint breakout opportunities. Breakout & Fakeout Detection: Differentiates between true breakouts and false moves to impr
Discover the Power of Trend Strength Pro Unlock a new level of clarity in your trading with Trend Strength Pro , the ultimate tool for visualizing market momentum. Stop guessing and start seeing the true strength of a trend with a single glance. Our elegant and intuitive indicator helps you make smarter, more confident trading decisions. Key Advantages & Features Instantly See Trend Strength : Our color-coded histogram tells you whether the trend is getting stronger or weaker. Green means moment
FREE
Market Profile
Artem Titarenko
5 (1)
The "Market Profile" indicator displays the profiles and volumes of periods – weekly, daily, session (8-hour), 4-hour, hour, summary. The VAH/VAL price area is automatically highlighted by a dotted line for each profile (except for the summary). The indicator includes chroma Delta, which colors the profile areas. The areas of prevailing Buys is colored in green, that of Sells - in red. The intensity histogram features blue/red respectively. In the filter mode, the indicator displays the volume a
The Momentum Standard/Hidden Divergence indicator will plot the momentum, and will also identify and plot standard (regular) divergences between the indicator and the price action, OR it can be set to identify and plot hidden (reverse) divergences between the indicator and the price action. The divergences themselves are implemented as lines (default green for bullish divergence and red for bearish divergence) drawn in the indicator pane. If activated via the Inputs dialog, alerts will be genera
HTF Power of Three (ICT) -  MT4 Indicator - Version 1.1 Overview The   HTF Power of Three   indicator is a professional implementation of the Inner Circle Trader's (ICT) Power of Three concept, inspired by Larry Williams. This indicator visualizes higher timeframe (HTF) candle development in real-time on any lower timeframe chart, making it an essential tool for ICT traders who study institutional price movement patterns. What is Power of Three (PO3)? Power of Three represents a three-staged Sma
Ultimate Dynamic Levels
Hispraise Chinedum Abraham
4.7 (10)
Attualmente in sconto per le vacanze a 399 dollari! I prezzi potrebbero aumentare in futuro. Leggete la descrizione qui sotto!  Vi presentiamo Ultimate Dynamic Levels - il MIGLIORE indicatore di entrata per l'Ultimate Sniper Dashboard! Entrate tempestive a bassissimo rischio e alto RR!!! Trovate l'Ultimate Sniper Dashboard QUI. L'abilità più importante sia per i trader principianti che per quelli professionisti è quella di capire esattamente dove e quando un mercato è più probabile che si tras
I recommend you to read the   product's blog  (manual) from start to end so that it is clear from the beginning what the indicactor offers. This multi time frame and multi symbol supply and demand zone dashboard indicator sends alerts when the price has reached a supply/demand zone. It is also possible to use it to be alerted about regular double tops/bottoms instead of zones. It can be used with all time frames from M1 to MN. It is possible to use RSI, divergence (MACD, OsMA, RSI or Awesome) a
Voenix
Lorentzos Roussos
4.58 (12)
Modelli armonici ,scanner e trader Modelli inclusi: Modello ABCD Modello Gartley Modello pipistrello Modello cifrato 3Modello di guida Motivo cigno nero Motivo cigno bianco Motivo Quasimodo o Motivo Over Under Modello alternativo del pipistrello Motivo a farfalla Modello di granchio profondo Modello di granchio Modello di squalo Modello FiveO Modello testa e spalle Modello triangolo ascendente Uno due tre modello E 8 modelli personalizzati Voenix è uno scanner di pattern armonici multi timefram
Mean Reversion Supply Demand Indicator Mean Reversion Supply Demand is the indicator to detect the important supply demand zone in your chart. The concept of supply demand trading relies on the quantity mismatching between buying and selling volumes in the financial market. Typically, supply demand zone serves to predict the turning point. The wave pattern, for any supply demand zone to work as an successful trade, looks like the price must touch the base zone, move away and then return to zone
Gli utenti di questo prodotto hanno anche acquistato
Attualmente 20% di sconto! La soluzione migliore per ogni principiante o trader esperto! Questo software per cruscotti funziona su 28 coppie di valute. Si basa su 2 dei nostri indicatori principali (Advanced Currency Strength 28 e Advanced Currency Impulse). Offre un'ottima panoramica dell'intero mercato Forex. Mostra i valori di forza delle valute avanzate, la velocità di movimento delle valute e i segnali per 28 coppie Forex in tutti i (9) timeframe. Immaginate come migliorerà il vostro tra
Dynamic Forex28 Navigator
Bernhard Schweigert
4.43 (7)
Dynamic Forex28 Navigator - Lo strumento di trading Forex di nuova generazione. ATTUALMENTE SCONTATO DEL 49%. Dynamic Forex28 Navigator è l'evoluzione dei nostri indicatori popolari di lunga data, che combinano la potenza di tre in uno: Advanced Currency Strength28 Indicator (695 recensioni) + Advanced Currency IMPULSE con ALERT (520 recensioni) + CS28 Combo Signals (Bonus). Dettagli sull'indicatore https://www.mql5.com/en/blogs/post/758844 Cosa offre l'indicatore di forza di nuova generazione?
Indicatore Miraculous – Strumento Forex e Binario 100% Non-Repaint Basato sul Quadrato di Nove di Gann Questo video presenta l' Indicatore Miraculous , uno strumento di trading altamente accurato e potente, sviluppato specificamente per i trader di Forex e Opzioni Binarie . Ciò che rende unico questo indicatore è la sua base sul leggendario Quadrato di Nove di Gann e sulla Legge della Vibrazione di Gann , rendendolo uno degli strumenti di previsione più precisi disponibili nel trading moderno. L
ZeusArrow Smart Liquidity Finder  Smart Liquidity Finder is Ai controlled indicator based on the Idea of Your SL is My Entry. It scan and draws the major Liquidity areas on chart partitioning them with Premium and Discount Zone and allows you find the best possible trading setups and help you decide the perfect entry price to avoid getting your Stop Loss hunted . Now no more confusion about when to enter and where to enter. Benefit from this one of it's kind trading tool powered by Ai an trade
Presentiamo l'Indicatore F-16 Plane, uno strumento all'avanguardia per MT4 progettato per rivoluzionare la tua esperienza di trading. Ispirato alla velocità e alla precisione imbattibili dell'aereo da combattimento F-16, questo indicatore combina algoritmi avanzati e tecnologia all'avanguardia per offrire prestazioni senza precedenti sui mercati finanziari. Con l'Indicatore F-16 Plane, volerai al di sopra della concorrenza poiché fornisce analisi in tempo reale e genera segnali di trading estrem
Meravith
Ivan Stefanov
5 (1)
L'indicatore analizza il volume da ogni punto e calcola i livelli di esaurimento del mercato per quel volume. È composto da tre linee: Linea di esaurimento del volume rialzista Linea di esaurimento del volume ribassista Una linea che indica la tendenza del mercato. Questa linea cambia colore per riflettere se il mercato è rialzista o ribassista. Puoi analizzare il mercato da qualsiasi punto di partenza tu scelga. Una volta che una linea di esaurimento del volume è raggiunta, identifica un nuovo
Indicatore in anticipo   determina i livelli e le zone di inversione del mercato , consente di attendere che il prezzo ritorni al livello ed entrare all'inizio di un nuovo trend, e non alla sua fine. Lui mostra   livelli di inversione   dove il mercato conferma un cambio di direzione e forma un ulteriore movimento. L'indicatore funziona senza ridisegnare, è ottimizzato per qualsiasi strumento e rivela il suo massimo potenziale quando abbinato al   LINEE DI TENDENZA PRO   indicatore. Scanner st
Supply and Demand Dashboard PRO
Bernhard Schweigert
4.8 (20)
Attualmente 20% di sconto! Questo cruscotto è un software molto potente che lavora su più simboli e fino a 9 timeframe. Si basa sul nostro indicatore principale (migliori recensioni: Advanced Supply Demand ).   Il cruscotto offre un'ottima panoramica. Mostra:    Valori filtrati di domanda e offerta, compresa la valutazione della forza delle zone, distanze dei pip da/all'interno delle zone, Evidenzia le zone annidate, Fornisce 4 tipi di allarmi per i simboli scelti in tutti i (9) time-frames.
Shogun Trade
Yuki Miyake
5 (2)
SHOGUN Trade - The Shocking Truth of 16 Years Unoptimized. Strategic Market Structure & The Art of Maximizing Gains. The Truth of "16 Years" That Even Stunned the Developer First, please take a look at the attached image (backtest results). This is the verification result for USDJPY H1 for a full 16 years, from January 1, 2010, to January 1, 2026. To be clear: This is NOT an EA (Expert Advisor) for sale. It is a manual trading indicator system. However, I dare to present this graph to you and
Hidden Cycles
Lev Vladimirovic Marushkin
5 (1)
The Only 100% Universal Tool! Stop trading against nature! This is your chance to secure the only indicator rooted in the absolute laws that govern the entire universe. Most tools guess—this one reveals the truth. Buy another toy or buy the truth. Your choice... Based on Universal Laws — NOT Some Guy’s Algorithm: Let the market adjust to the Hidden Cycles Geometry — not the other way around. Most indicators are based on a man-made formula. They often lag, fail over time, or need constant re-o
The Super Arrow Indicator provides non-repainting buy and sell signals with exceptional accuracy. Key Features No repainting – confirmed signals remain fixed Clear visual arrows: green for buy, red for sell Real-time alerts via pop-up, sound, and optional email Clean chart view with no unnecessary clutter Works on all markets: Forex, gold, oil, indices, crypto Adjustable Parameters TimeFrame Default: "current time frame" Function: Sets the time frame for indicator calculation Options: Can be set
The Nihilist 5.0 Indicator includes Forexalien and Nihilist Easy Trend trading strategies and systems. It is composed of an MTF Dashboard where you can analyze the different input possibilities of each strategy at a glance. It has an alert system with different types of configurable filters. You can also configure which TF you want to be notified on your Metatrader 4 platform and Mobile application The indicator has the option to view how could be a TP and SL by using ATR or fixed points, even w
L'indicatore " Dynamic Scalper System " è progettato per il metodo di scalping, ovvero per il trading all'interno di onde di trend. Testato sulle principali coppie di valute e sull'oro, è compatibile con altri strumenti di trading. Fornisce segnali per l'apertura di posizioni a breve termine lungo il trend, con ulteriore supporto al movimento dei prezzi. Il principio dell'indicatore. Le frecce grandi determinano la direzione del trend. Un algoritmo per generare segnali per lo scalping sotto fo
Super Signal – Skyblade Edition Sistema professionale di segnali di tendenza senza repaint / senza ritardo con tasso di vincita eccezionale | Per MT4 / MT5 Funziona meglio su timeframe più bassi, come 1 minuto, 5 minuti e 15 minuti. Caratteristiche principali: Super Signal – Skyblade Edition è un sistema intelligente di segnali progettato specificamente per il trading di tendenza. Utilizza una logica di filtraggio multilivello per identificare esclusivamente i movimenti direzionali forti, supp
BinaryIndicator
Andrey Spiridonov
BinaryIndicator is a highly accurate indicator for trading binary options. It shows excellent results in scalping. This indicator is based in multifactor analysis of trend indicators, as well as confirmation oscillators, which in the end gives an increased accuracy of signals. Advantages of the indicator Increased accuracy of signals. Excellent results when trading binary options with a short expiration time from M30 to M1 . It works on any timeframes. Works with any trade symbols. Parameters
Gold Channel is a volatility-based indicator, developed with a specific timing algorithm for the XAUUSD pair, which consists of finding possible corrections in the market. This indicator shows two outer lines, an inner line (retracement line) and an arrow sign, where the theory of the channel is to help identify overbought and oversold conditions in the market. The market price will generally fall between the boundaries of the channel. If prices touch or move outside the channel it is a tradi
Everyone who purchases the Scalping signals M1 indicator receives a FREE BONUS — a fully automated Expert Advisor that trades based on the indicator’s signals. The indicator shows the arrows — the robot can execute the trades for you, following all signals and risk-management rules. Scalping signals M1 – a ready-made trend-following entry system for M1 Scalping signals M1 is an indicator that turns your chart into a clear action map: a colored trend channel shows the direction of the market, and
Presenting one-of-a-kind Gann Indicator for XAUUSD IQ Gold Gann Levels is a non-repainting, precision tool designed exclusively for XAUUSD/Gold intraday trading. It uses W.D. Gann’s square root method to plot real-time support and resistance levels, helping traders spot high-probability entries with confidence and clarity. William Delbert Gann (W.D. Gann) was an exceptional market analyst whose trading technique was based on a complex blend of mathematics, geometry, astrology, and ancient calcul
NAM Order Blocks
NAM TECH GROUP, CORP.
3.67 (3)
MT4 Multi-timeframe Order Blocks detection indicator. Features - Fully customizable on chart control panel, provides complete interaction. - Hide and show control panel wherever you want. - Detect OBs on multiple timeframes. - Select OBs quantity to display. - Different OBs user interface. - Different filters on OBs. - OB proximity alert. - ADR High and Low lines. - Notification service (Screen alerts | Push notifications). Summary Order block is a market behavior that indicates order collection
Title: BBMA Structure Guide - BBMA Structure Guide Description: BBMA Structure Guide is a specialized MQL4 indicator designed to help traders understand the journey of BBMA structure more easily and efficiently. BBMA, or "Bollinger Bands Moving Average," is known for its motto "One Step Ahead," highlighting the importance of understanding market structure in depth. With BBMA Structure Guide, you can quickly identify the underlying market structure patterns that drive price movements. This wil
Innanzitutto, vale la pena sottolineare che questo Strumento di Trading è un Indicatore Non-Ridipingente, Non-Ridisegnante e Non-Laggante, il che lo rende ideale per il trading professionale. Corso online, manuale utente e demo. L'Indicatore Smart Price Action Concepts è uno strumento molto potente sia per i nuovi che per i trader esperti. Racchiude più di 20 utili indicatori in uno solo, combinando idee di trading avanzate come l'Analisi del Trader del Circolo Interno e le Strategie di Trading
Segnale GoldRush Trend Arrow L'indicatore GoldRush Trend Arrow Signal fornisce un'analisi precisa e in tempo reale dei trend, pensata appositamente per gli scalper ad alta velocità e a breve termine nel mercato XAU/USD. Progettato specificamente per il timeframe di 1 minuto, questo strumento mostra frecce direzionali che indicano chiari punti di ingresso, consentendo agli scalper di navigare con sicurezza nelle condizioni di mercato volatili. L'indicatore è composto da frecce di avviso PRIMA
Looking for a powerful yet lightweight swing detector that accurately identifies market structure turning points? Want clear, reliable buy and sell signals that work across any timeframe and any instrument? Buy Sell Arrow MT Swing is built exactly for that — precision swing detection made simple and effective. This indicator identifies Higher Highs (HH) , Higher Lows (HL) , Lower Highs (LH) , and Lower Lows (LL) with remarkable clarity. It is designed to help traders easily visualize market str
OrderFlow Absorption – Indicatore professionale di Delta e Segnali di Assorbimento per MT4 Sblocca la potenza della vera analisi del flusso degli ordini con OrderFlow Absorption – l’indicatore definitivo di istogramma delta e segnali di assorbimento per MetaTrader 4. Progettato per i trader che vogliono vedere cosa succede davvero dietro ogni movimento di prezzo, questo strumento rivela la pressione nascosta di acquisto/vendita e gli eventi di assorbimento che muovono il mercato. Caratteristiche
Golden Gendut
Anthonius Soruh
5 (1)
Gendel Gendut is Binary Option Indicator From @realTatino Trade with expaired time Pairs : All Forex Pair Time Frame : M5 only Trade Time All Time Alert : Alert Message, Alert Email, Alerts Push Buffer : 4 Buffer (0,2 (Buy) || 1,3 (Sell) Broker Suitable : All Broker Binary With Forex Pair Auto Trade : Yes Repaint : NO Delay : NO Other Binary Indicator : https://www.mql5.com/en/market/product/70915 https://www.mql5.com/en/market/product/71054 https://www.mql5.com/en/market/product/57755 etc IND
WeSpread
Anchor Trading S.R.L.S.
The We-Spread mt4 indicator is a spread trading tools and it is suitable for those who want to study the markets with a different approach to the contents that are normally available in online trading bookstores. I think the Spread Trading strategy is one of the best I've ever used in the last few years. This is a unique indicator for spread trading because allow you to study till 3 spreads in one time. What is Spread Trading on forex The Spread Trading is the study of the strength of 2 currency
POWR Rise Coming
Trade Indicators LLC
This indicator is SO SIMPLE… when the green Rise Coming arrow appears, a price drop may be on the way! Plain and easy profits! As you receive more than one 'Rise Coming' text signal in a downtrend, it means momentum is building larger for a bull run. HOW TO USE 1. When the green "Rise Coming" text appears, a price jump may be on the way! This indicator Never Repaints! To get the best setting it's a matter of tweaking the indicator until it gives you the best results. Our recommendation, and what
"Dragon's Tail" is an integrated trading system, not just an indicator. This system analyzes each candle on a minute-by-minute basis, which is particularly effective in high market volatility conditions. The "Dragon's Tail" system identifies key market moments referred to as "bull and bear battles". Based on these "battles", the system gives trade direction recommendations. In the case of an arrow appearing on the chart, this signals the possibility of opening two trades in the indicated directi
Supreme Commander
Ramon Sobrevals Arce
4.13 (8)
The indicator of the indicators. The Most Powerful Technique to Determine Forex Trend Strength in 2023. We have perfected Supreme Commander that it calculates an average of the selected indicators (up to 16) and the selected timeframe (all) with the result of a single trend that indicates the potential of buying and selling.  It includes the following indicators: Accelerator/Decelerator oscillator Average Directional Movement Index Awesome oscillator; Bulls and Bears  Commodity Channel Index; De
The Hurricane Indicator
Paul Nicholas Clevett
5 (1)
Currently switched to the 4 hour chart - but use other time frames for confirmation. :-)  I change my main time frame based on the market movement at the time. The Hurricane Forex Indicator is a multi time frame indicator that includes such things as Trade Notifications, Trade Calculator, Momentum Indicator, risk reward and much more. We have a free Trade room for our users as well. Please check out the video for full details of how this indicator works as it has over 15 years worth of developme
Altri dall’autore
Presentazione dell'Indicatore Astronomico per   MT4 / MT5 : Il tuo compagno di trading celeste definitivo Sei pronto a elevare la tua esperienza di trading a livelli celesti? Non cercare oltre, il nostro rivoluzionario Indicatore Astronomico per MT4 è qui. Questo strumento innovativo va oltre gli indicatori di trading tradizionali, sfruttando algoritmi complessi per offrirti intuizioni astronomiche senza pari e calcoli di precisione. Un universo di informazioni a portata di mano:   Ammira un pan
Vi presentiamo ON Trade Waves Patterns Harmonic Elliot Wolfe, un indicatore avanzato progettato per rilevare vari tipi di pattern sul mercato utilizzando metodi sia manuali che automatici. Ecco come funziona: Pattern Armonici: Questo indicatore è in grado di individuare pattern armonici che appaiono sul vostro grafico. Questi pattern sono fondamentali per i trader che praticano la teoria del trading armonico, come descritta nel libro di Scott Carney "Harmonic Trading vol 1 & 2". Che li disegniat
Questo indicatore ha lo scopo di rappresentare visivamente il canale Donchian sul tuo grafico di trading. Il canale Donchian è uno strumento tecnico semplice utilizzato per rappresentare l'intervallo tra il massimo più alto e il minimo più basso in un periodo specificato. Questo indicatore migliora l'analisi visiva dei movimenti dei prezzi, offrendo indicazioni sui potenziali punti di rottura e di continuazione della tendenza. Il canale Donchian può essere applicato sia all'unità di tempo attual
FREE
ON Trade Pivoteer
Abdullah Alrai
4 (1)
Introducing the Pivot Point Selector Indicator: Your Ultimate Tool for Custom Pivot Levels Are you ready to take your trading to the next level? Say hello to the Pivot Point Selector Indicator, a game-changing tool that puts you in control of your pivot levels. This innovative indicator empowers you to choose three specific points that will determine the pivot level calculations, giving you unparalleled customization and precision in your trading strategy. Key Features and Benefits: Custom Pivo
FREE
Presentazione dell'Indicatore Calcolatore del Prezzo del Grammo d'Oro Sei interessato a tenere sempre sotto controllo il prezzo dell'oro nella tua valuta locale? Non cercare oltre, l'Indicatore Calcolatore del Prezzo del Grammo d'Oro ti offre uno strumento innovativo che ti consente di calcolare in tempo reale il prezzo al grammo dell'oro nella tua valuta locale preferita. Con questo indicatore, puoi sfruttare le informazioni finanziarie per prendere decisioni informate. Caratteristiche Principa
FREE
ON Trade Pivots is A technical indicator that Draws all Pivot levels depending on time frame that defined in settings. Notes It will be good tool for all traders who use pivot levels in their trades. Let me inform you that this indicator draw this level as buffers not as objects then you can connect it easily to EA. This indicator allow you to find pivots levels for any time frame not only daily you are free to choose time frame from settings. Parameters Use_System_Visuals - Enable /Disable Sy
FREE
"Questo indicatore è uno strumento semplice per la rilevazione delle tendenze. Puoi usarlo insieme alla tua strategia per ottenere buoni ingressi, come nella modalità di scalping. Disegnerà un canale intorno al prezzo, che si espanderà man mano che il tempo aumenta. In periodi personalizzati, tornerà al punto di partenza dell'espansione in base a un algoritmo che tiene conto del tempo e del prezzo insieme. Puoi acquistare al limite inferiore del canale dopo che sono visibili segni di inversione.
Questo indicatore funziona con la teoria delle onde di Elliott in due modi: Modalità automatica: In questa modalità, l'indicatore rileverà automaticamente le cinque onde motrici sul grafico in conformità alla teoria delle onde di Elliott. Fornirà previsioni e individuerà potenziali zone di inversione. Inoltre, avrà la capacità di generare avvisi e messaggi push per informare i trader sugli sviluppi importanti. Questa funzionalità automatica semplifica il processo di identificazione e analisi dei
Strumento di Canale di Regressione". Utilizzando questo strumento, i trader possono ottenere un controllo eccezionale sul canale di regressione del proprio grafico, consentendo loro di prendere decisioni di trading più informate. Lo Strumento di Canale di Regressione è uno strumento potente nella cassetta degli attrezzi di un trader. È progettato per fornire preziose informazioni sulle tendenze dei prezzi e sui potenziali livelli di supporto e resistenza. Lo strumento è particolarmente efficace
Presentiamo il nostro potente indicatore Forex progettato per migliorare la tua strategia di trading e fornirti informazioni precise sulle tendenze di mercato. Questo strumento innovativo utilizza un algoritmo personalizzato sofisticato che analizza minuziosamente le misurazioni delle candele, apportando regolazioni per ottenere una precisione ottimale. Il risultato? Un insieme di frecce accuratamente tracciate sul tuo grafico, che indicano punti di ingresso strategici. La genialità dietro a que
Questo indicatore è progettato per rilevare e visualizzare le onde diamantate di Gann, un modello specifico derivato dalla teoria di Gann. Fornisce ai trader una panoramica sulle potenziali inversioni di mercato tracciando punti (P) basati sui punti ABC del modello. Inoltre, l'indicatore traccia linee verticali dai punti previsti (P) per aiutare i trader a identificare più facilmente i punti potenziali di inversione. Funzionalità dell'indicatore: Use_System_Visuals: Questo parametro consente di
"Questo indicatore rileva gli ingressi basati sulla teoria del modello Bystra e fornisce i valori di ingresso per inserire ordini limitati con livelli di destinazione e di stop. Ciò consente di calcolare la percentuale di rischio. Note: Questo indicatore dispone di buffer che ne consentono l'utilizzo negli Advisor Esperti (EA). È importante praticare una buona gestione del denaro durante il lavoro con questo prodotto. Quando cambi il tuo timeframe, L'indicatore salverà il template utilizzato nel
L'indicatore "Fibo Star" è stato progettato per tracciare i fan di Fibonacci sotto forma di stelle sul tuo grafico. Questi fan di Fibonacci sono uno strumento potente per analizzare le variazioni dei prezzi e possono fornire intuizioni sui potenziali livelli di supporto e resistenza. Questo indicatore è dotato di un pannello di controllo user-friendly che mira a semplificare il processo di disegno e configurazione dei fan, risparmiando così tempo ed sforzi. Istruzioni per l'uso: Questo indicator
L'indicatore "Forza delle Valute" è uno strumento potente progettato per fornire ai trader informazioni sulla forza relativa delle diverse valute sul mercato forex. Calcolando e rappresentando la forza di ciascuna valuta in base al proprio intervallo di tempo specificato, questo indicatore offre ai trader l'opportunità di identificare possibili occasioni di trading, in particolare quando sono osservate divergenze significative o incroci. Caratteristiche principali dell'indicatore: 1. Calcolo del
Questo indicatore rileverà i pattern armonici disegnati sul grafico tramite metodi manuali e automatici. Aggiungi la tua recensione, per favore. Note: Questo indicatore ha un pannello di controllo e salverà ogni impostazione (grafico e timeframe). Puoi ridurlo per avere più spazio sul grafico e puoi premere il pulsante di chiusura per nascondere tutti i dati dell'indicatore sul grafico se preferisci lavorare con altri strumenti di analisi. Quando utilizzi questo indicatore e modifichi le imposta
L'indicatore di pattern di candele giapponesi Hikkake è uno strumento specializzato progettato per identificare e rilevare i Pattern di Azione dei Prezzi Hikkake che si stanno formando su un grafico. Questi pattern si basano sul concetto di una falsa rottura da una barra interna, che spesso porta a potenziali opportunità di trading. La principale funzione dell'indicatore è analizzare le ultime cinque candele sul grafico e determinare se esse presentano le caratteristiche del pattern Hikkake. Qua
Indicatore Tecnico per la Rilevazione di Forti Pattern di Azione del Prezzo: Pin Bar, Inside Bar e Outside Bar Introduzione: Nel campo dell'analisi tecnica, i pattern di azione del prezzo fungono da indicatori vitali dei potenziali movimenti di mercato. Abbiamo sviluppato un sofisticato indicatore tecnico che semplifica l'individuazione di robusti pattern di azione del prezzo sui grafici. Il nostro indicatore è specializzato nella rilevazione di tre pattern essenziali: il Pin Bar, l'Inside Bar
Indicatore di Supporto e Resistenza Basato sulla Numerologia per MetaTrader Introduzione: Scopri una nuova dimensione nell'analisi tecnica con il nostro Indicatore di Supporto e Resistenza Basato sulla Numerologia per MetaTrader. Questo strumento unico sfrutta la potenza della numerologia per identificare i livelli chiave di supporto e resistenza sui tuoi grafici, fornendoti preziose intuizioni sulle potenziali oscillazioni dei prezzi. Concetti Chiave: La Numerologia nel Trading: La numerologia
Scopri un approccio rivoluzionario al trading con l'Indicatore Shepherd Numerology Levels. Questo strumento innovativo combina la saggezza antica della numerologia con le moderne tecniche di trading per aiutarti a identificare livelli chiave di supporto e resistenza sui tuoi grafici. Utilizzando il metodo del quadrato del nove, questo indicatore offre una prospettiva unica sui meccanismi di mercato e ti consente di prendere decisioni di trading più informate. Principali Caratteristiche e Vantagg
Presentazione dell'Indicatore ON Trade Numerology Mirror: Rivelazione di Modelli di Inversione Nascosti attraverso la Numerologia Esplora una nuova dimensione nell'analisi tecnica con l'Indicatore ON Trade Numerology Mirror. Questo innovativo strumento sfrutta la saggezza antica della numerologia per identificare livelli chiave di inversione nei tuoi grafici. Riorganizzando i numeri in posizioni invertite, questo indicatore rivela modelli nascosti che hanno il potenziale per indicare inversioni
ON Trade Optuma Astro
Abdullah Alrai
5 (5)
Presentazione dell'Indicatore Astronomico per MT4: Il tuo compagno di trading celeste definitivo Sei pronto a elevare la tua esperienza di trading a livelli celesti? Non cercare oltre, il nostro rivoluzionario Indicatore Astronomico per MT4 è qui. Questo strumento innovativo va oltre gli indicatori di trading tradizionali, sfruttando algoritmi complessi per offrirti intuizioni astronomiche senza pari e calcoli di precisione. Un universo di informazioni a portata di mano: Ammira un pannello compl
Introducing the ON Trade Melad Pattern Indicator: Enhance Your Trading Strategy with Breakout Patterns Discover the power of the ON Trade Melad Pattern Indicator—an intuitive tool designed to elevate your trading decisions by detecting and highlighting breakout patterns on your charts. This indicator is your key to identifying crucial breakout points and potential trend shifts with simplicity and precision. Key Features: Breakout Pattern Detection: The ON Trade Melad Pattern Indicator focuse
This indicator will give you entries as result of scalping strategy that will be applied on 14 symbols in same time and you are able to be notified with this entries  Note :   This indicator for scalping on 5 minutes timeframe only . How to use it : 1-Open chart and adjust settings (edit symbols names as your platform names , activate the alert system if you need it . 2-Wait for any signal you have it from this scanner you will have it as alert and as notification and you will see it on board
This indicator gives you the signal of real cross on stochastic indicator. This indicator is easy to attach to an ea. This indicator will work best on All time frames. Arrow appears depending on many algorithms that study the cross parameters. Indicator properties Use_System_Visuals: enable/disable visual styles. Stochastic_K_Period. Stochastic_D_Period. Stochastic_Slowing. Use_Notifications: enable/disable Push Notifications. Use_Alert: enable/disable Alerts. Use_E_Mail: enable/disable Email n
ON Trade VSA
Abdullah Alrai
Presentiamo "ON Trade VSA" - Il tuo strumento definitivo per l'analisi del volume e della distribuzione! Scopri il potere dell'Analisi del Volume e della Distribuzione (VSA) con il nostro indicatore all'avanguardia - "ON Trade VSA". Il VSA è una metodologia potente utilizzata dai trader per valutare la forza del mercato, identificare le tendenze e prendere decisioni informate. Esploriamo le caratteristiche chiave che rendono "ON Trade VSA" uno strumento indispensabile per il tuo arsenale di trad
This product is a part of  ON Trade Waves Patterns Harmonic Elliot Wolfe you can test free version on EURJPY from this link  Wolf Waves Indicator Scopri le Onde del Lupo - Il tuo Ultimo Strumento di Trading! Sei alla ricerca di uno strumento potente per individuare facilmente le Onde del Lupo su qualsiasi intervallo di tempo? Non cercare oltre! Il nostro indicatore delle Onde del Lupo fa il lavoro in modo impeccabile. Ecco perché è perfetto per te: Caratteristiche Principali: Rilevamento Autom
This program serves as an effective tool for sending messages through a Telegram bot using the MetaTrader platform. It enables you to send your trading recommendations related to the orders you open on the trading platform directly to your Telegram channel or group. These messages may include details about open trades and can be accompanied by illustrative images of the orders. Alternatively, they can be configured to be without images based on your preferences. This means that if you are the ow
Presentiamo il nostro nuovo indicatore: [ON Trade Breakout Zone] Strumento di analisi di mercato semplice ma potente per tutti i trader! Adatto sia ai professionisti che ai trader principianti Sei pronto a potenziare la tua strategia di trading? Il nostro ultimo indicatore è progettato per semplificare l'analisi di mercato ed è uno strumento utile per trader di tutti i livelli. Che tu sia un esperto navigato o stia appena iniziando, [ON Trade Breakout Zone] è la tua chiave per sbloccare
User Manual Download link: https://ontrd.com/our-books/ For all who are asking about indicator  ON Trade Numerology Station It obtain about 16 numerology strategies it make together completed unit control your trading . Basic strategies to work with it are 3 strategies statistics about them are the following : 1. RBA levels success rate more then 95%. 2. FF more then 96%  3.RBA SUN 98% We will not say 100 % as they are .. Ratio rates as following :  1.Rba levels more then 1/3 to 1/6 . 2.FF MORE
Questo prodotto ti consentirà di controllare i tuoi ordini e il tuo account con molte funzioni 1- calcolerà la dimensione del lotto corretta in base alla dimensione del tuo account/dimensione SL/valore in punti coppia per 1 dimensione del lotto. 2- ti fornirà la situazione attuale dell'ordine in base alle posizioni delle linee (target sl tp). 3- sposterà tutti gli ordini target / sl premendo 1 pulsante. 4- ti darà informazioni sul tuo conto e sul margine necessario per aprire i tuoi ordini.
Filtro:
Nessuna recensione
Rispondi alla recensione