KT Auto Fibo MT5
- Indicatori
-
KEENBASE SOFTWARE SOLUTIONS
 Visita il nostro sito web per accedere a strumenti di trading gratuiti, tutorial e guide dettagliate sui nostri prodotti:
https://www.keenbase-trading.com - Versione: 1.1
- Aggiornato: 25 marzo 2022
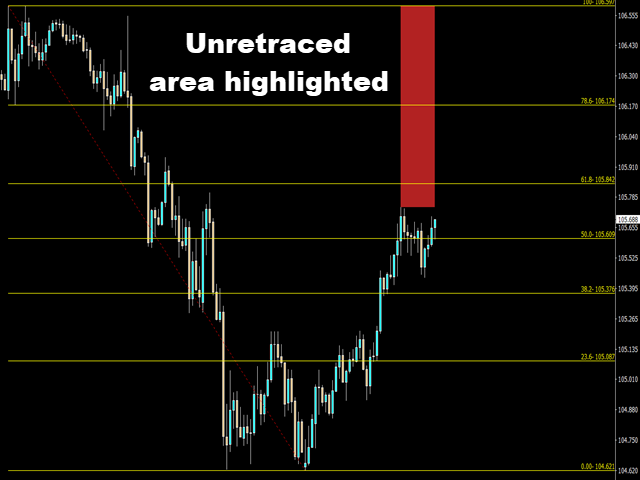
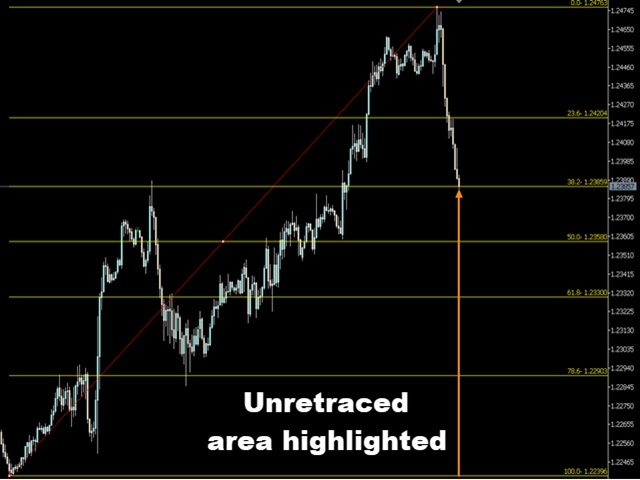
KT Auto Fibo traccia automaticamente i livelli di ritracciamento di Fibonacci basandosi sulla direzione della tendenza in corso. I massimi e i minimi vengono selezionati automaticamente utilizzando i punti massimi e minimi disponibili sul grafico. Puoi ingrandire, ridurre e scorrere il grafico per regolare i livelli di Fibonacci di conseguenza.
Modalità
- Automatico: Traccia automaticamente i livelli di Fibonacci in base all'area visibile del grafico.
- Manuale: Traccia i livelli di Fibonacci una sola volta. Successivamente puoi modificare manualmente i punti di ancoraggio.
Utilizzo:
- Aiuta a prevedere logicamente i futuri obiettivi di profitto.
- Fornisce un'alta probabilità di inversione se combinato con supporti/resistenze o linee di tendenza.
- Offre ingressi a basso rischio nei mercati in tendenza.
Parametri di input
- Automatico: Traccia i livelli di ritracciamento di Fibonacci senza intervento umano.
- Manuale: Traccia i livelli di ritracciamento di Fibonacci una sola volta. Successivamente puoi allungare i punti di ancoraggio manualmente.
- Mostra area non ritestata: Mostra/nasconde sul grafico l'area che non è ancora stata ritestata dal prezzo.
- Il resto degli input è autoesplicativo.

Very good.