Cool volumes

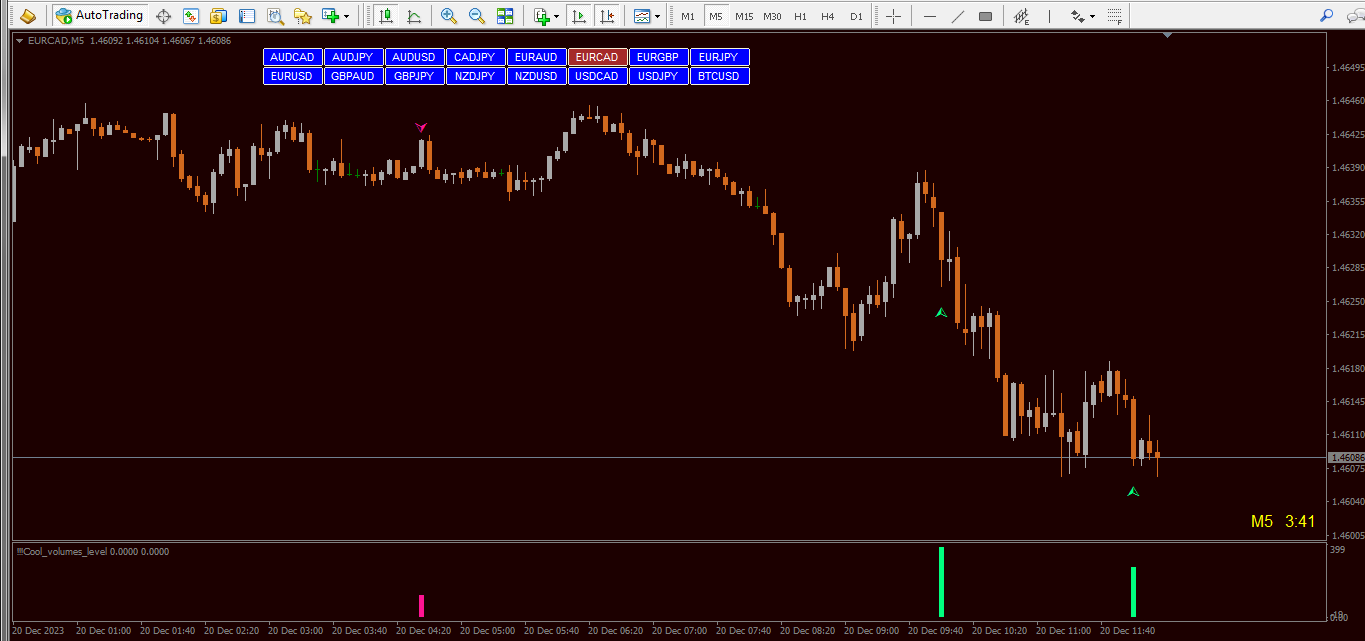
L'indicatore a quadrante "cool volumes" è stato creato sulla base dei volumi in teak su MT4.

L'indicatore stesso tiene traccia in un determinato periodo di tempo (selezione del periodo di tempo) del numero di volumi per l'acquisto o la vendita. E quando c'è un eccesso anomalo dei volumi di venditori o acquirenti, emette un segnale per vendere o acquistare.

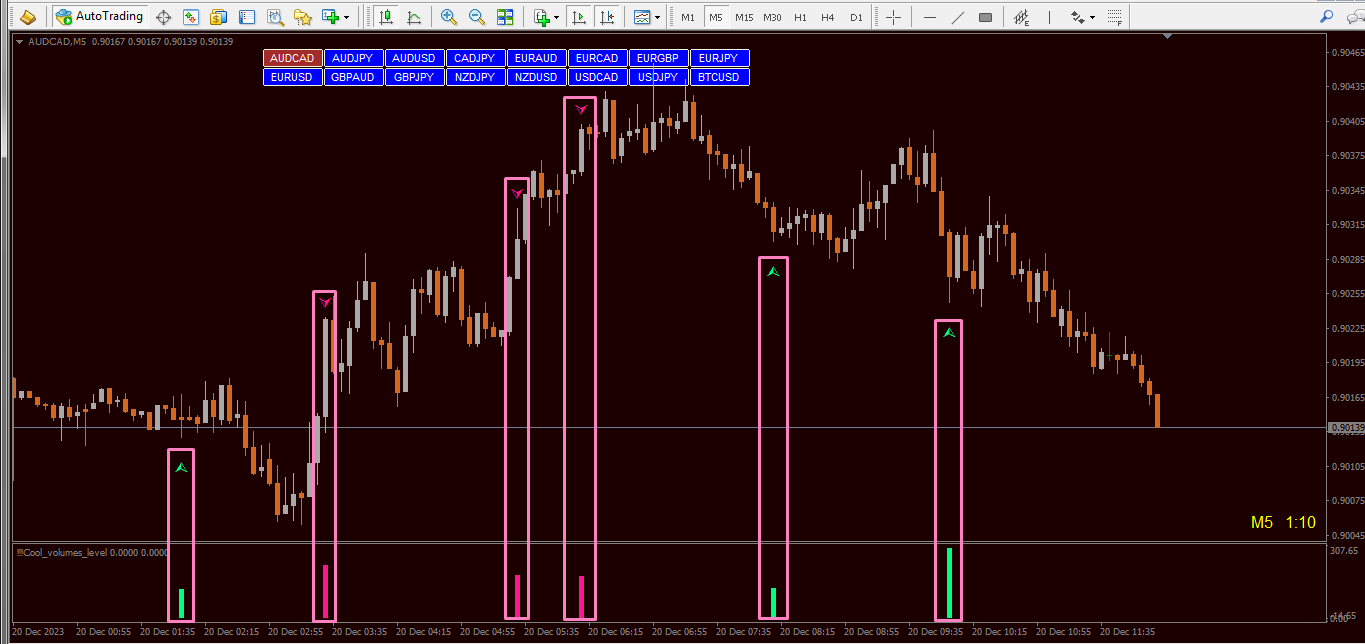
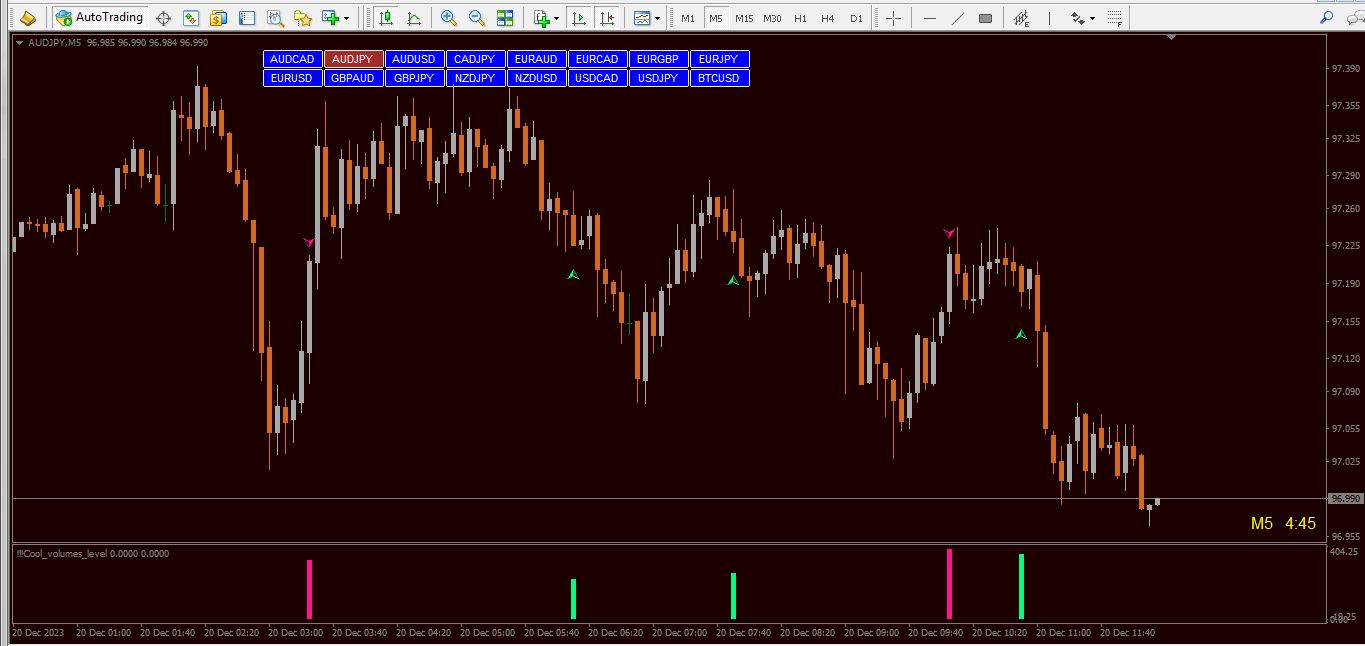
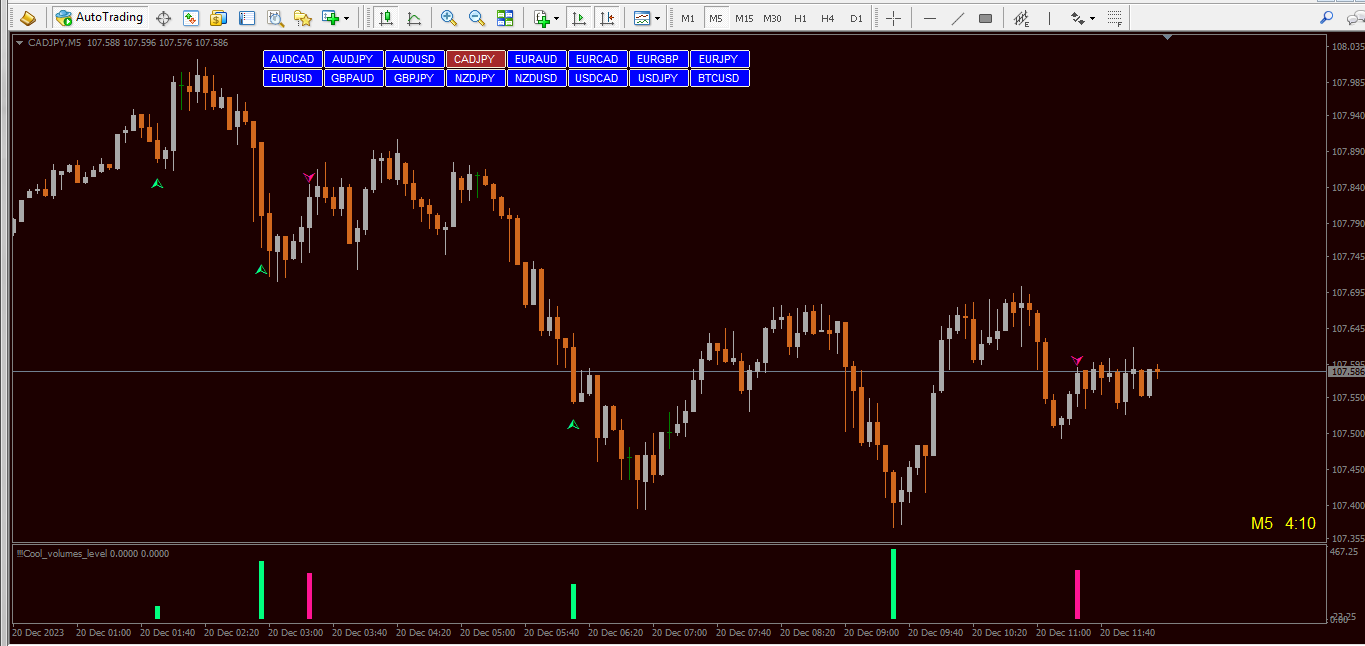
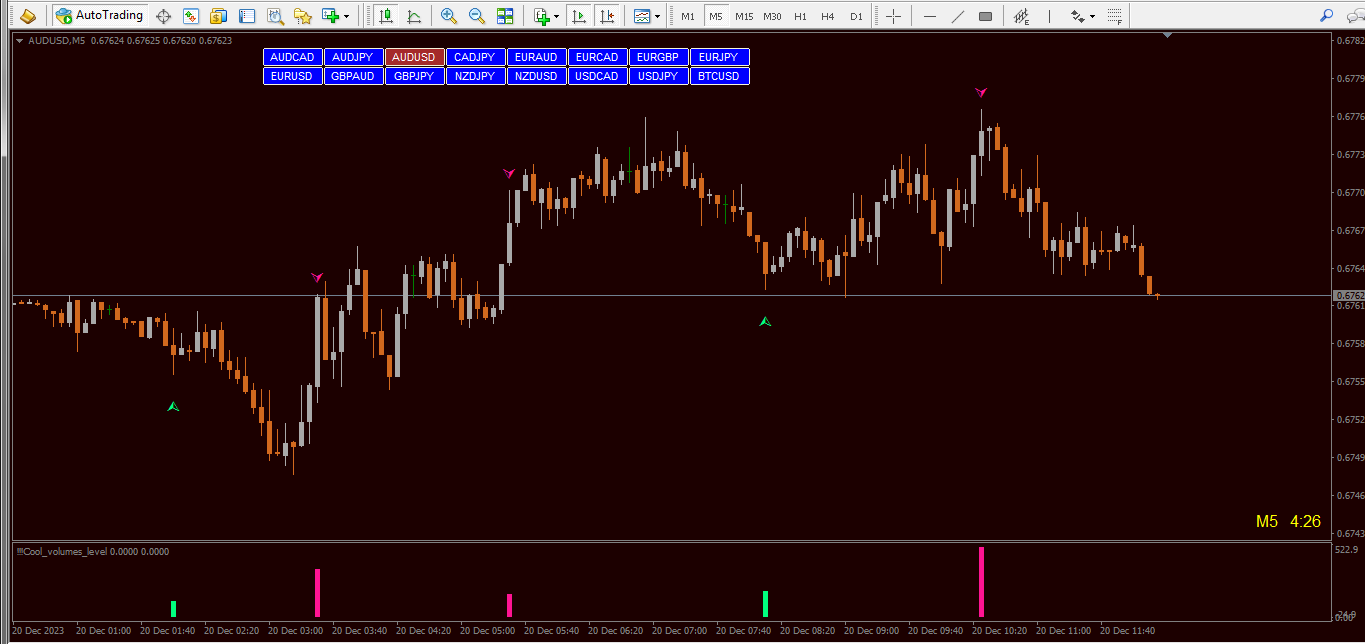
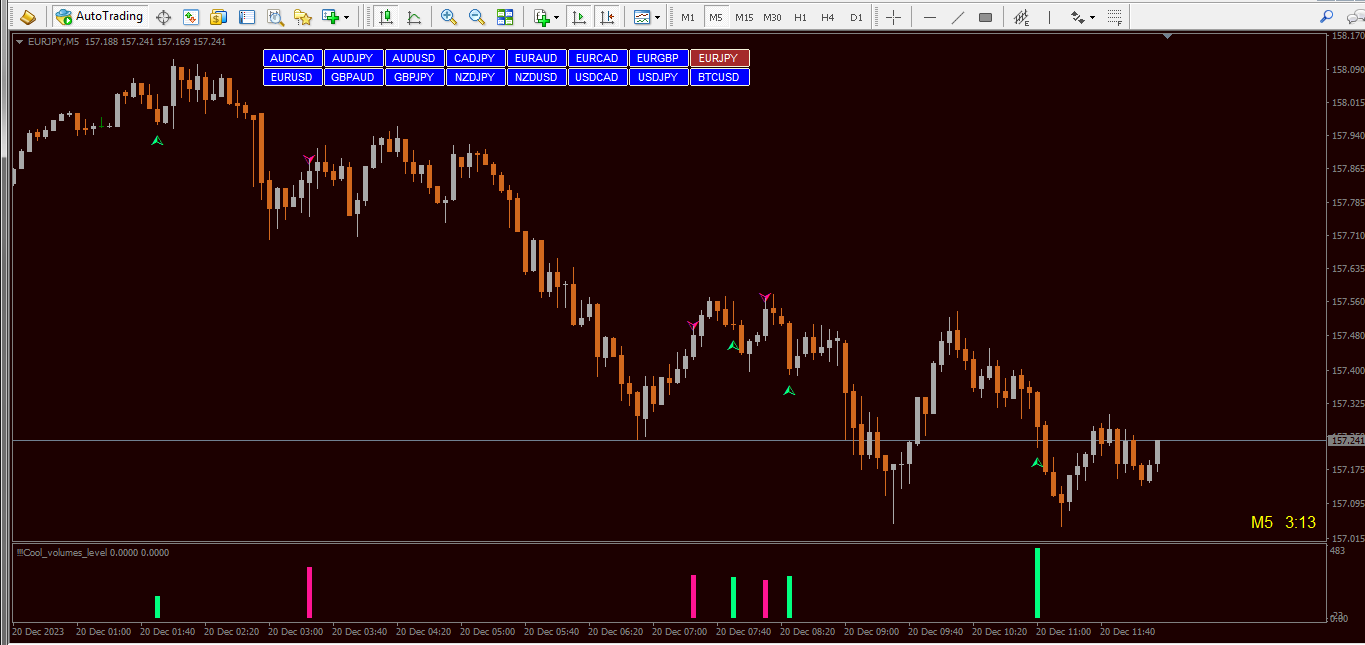
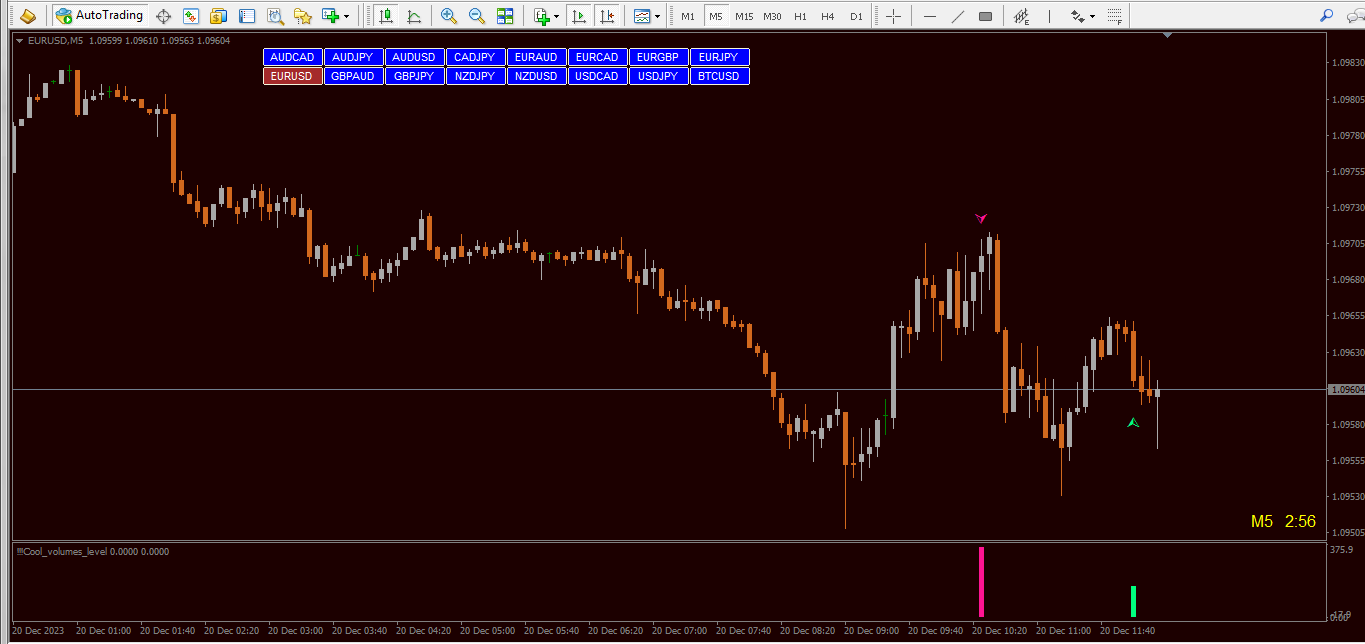
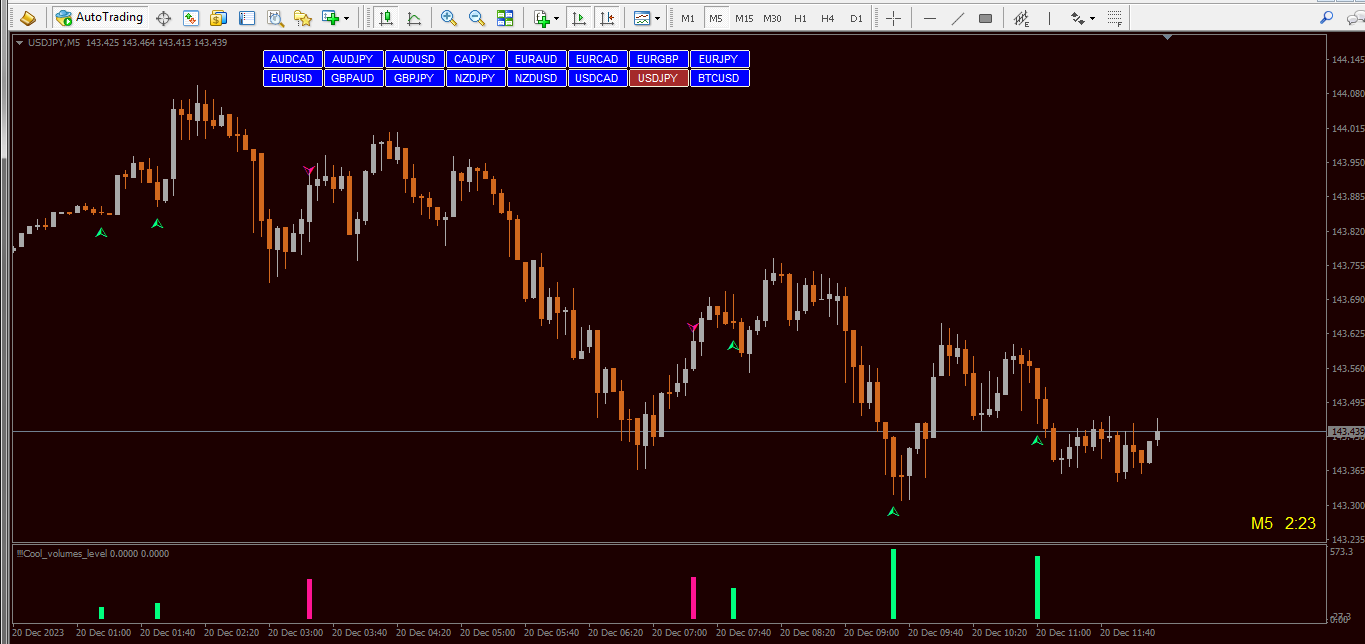
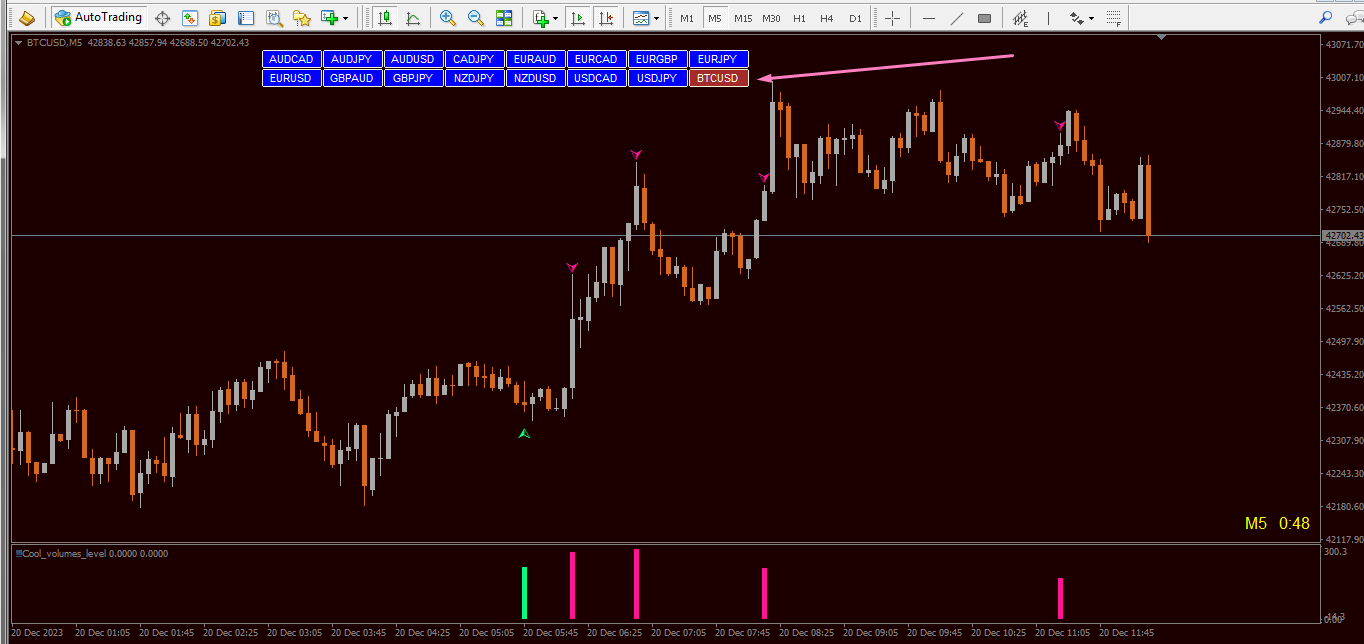
Nella finestra in basso vengono disegnati grafici a barre colorati, in cui il colore verde mostra la predominanza degli acquirenti al momento, il che significa una potenziale inversione immediata per un aumento in questo intervallo di prezzo. Il colore rosso indica al contrario la predominanza dei venditori, il che significa una potenziale inversione immediata al ribasso.

Inoltre, per facilitare la percezione visiva, sono state aggiunte frecce direttamente alla finestra principale del grafico.

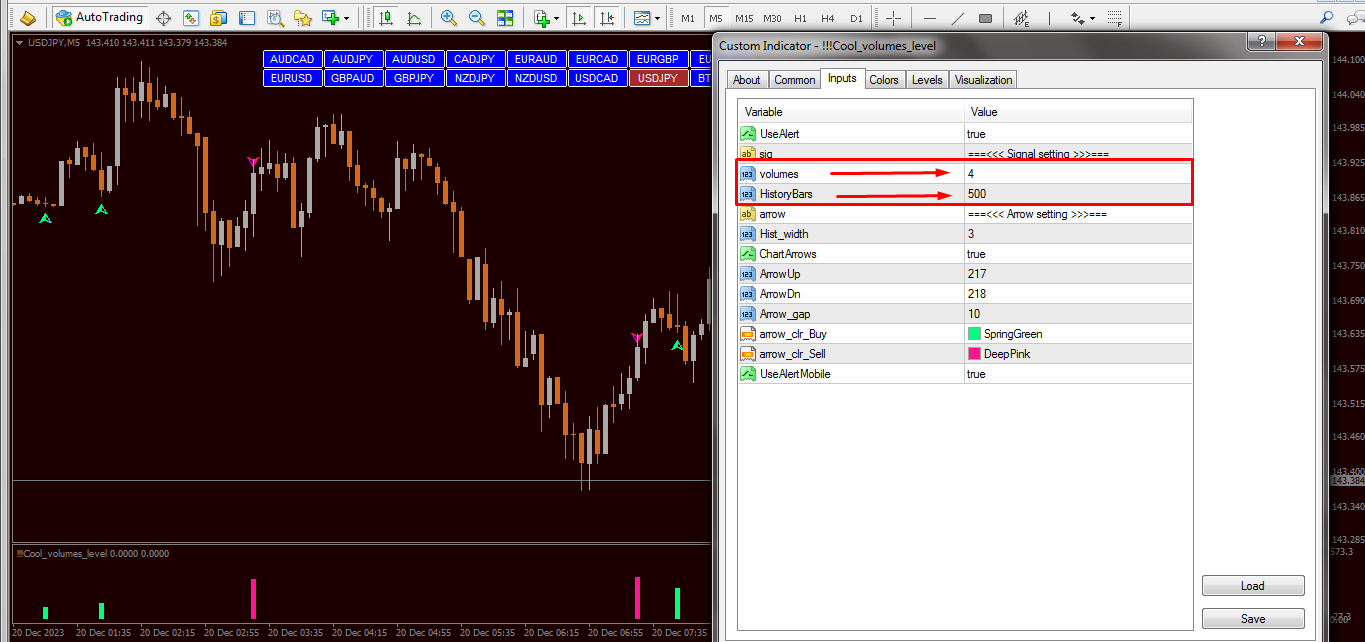
Nelle variabili esterne per comodità dell'utente, le variabili di impostazione per la frequenza dei segnali e il loro numero nella cronologia (HistoryBars) sono scritte. Ma non è consigliabile impostare un valore superiore a 1000. Più di questo rallenterà la salute del tuo terminale.

Anche nella sezione "= = = < < < Arrow setting > > > = = = " tu stesso puoi impostare qualsiasi parametro delle frecce e dell'istogramma a tuo piacimento. Lo spessore dell'istogramma, la distanza delle frecce dalle candele, i codici delle frecce e i loro colori. Oppure puoi disabilitare completamente le frecce sulla finestra principale del grafico.

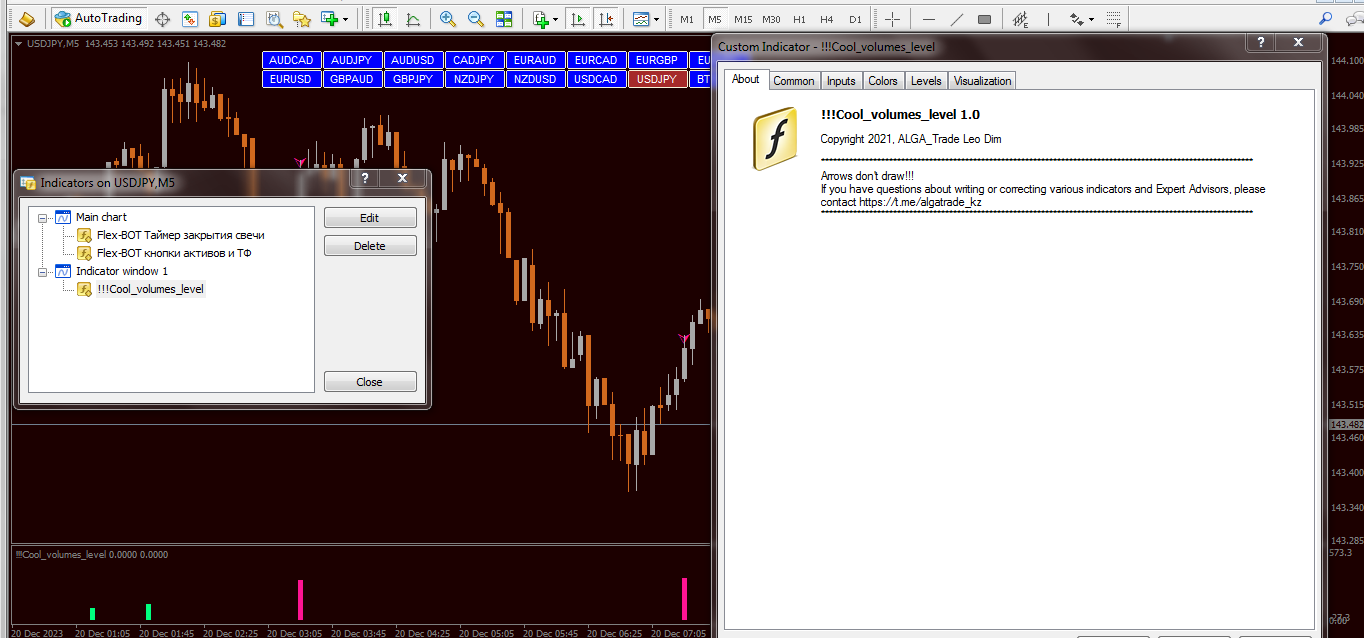
Frecce e segnali non disegnano affatto. Anche dopo aver cambiato i tempi e aggiornato il terminale. Ma devi entrare nelle transazioni dopo aver fissato l'istogramma e le frecce!
Tutti i successi!!!
Prodotti consigliati
UGenesys Volume MT4
Odaine Ramon Mcmillan
50% Off Today Only! Price Goes Back Up at 11 PM (EST) uGenesys Volume Indicator: Your Key to Mastering Market Volume Analysis What Traders Are Saying: "A must-have indicator...really a game-changer." – wuzzy66 "Amazing indicator...strongly recommend to beginners." – joinbehar Understanding Market Volume: Volume in the market is a critical indicator of movement and opportunity. The uGenesys Volume Indicator is specially crafted to pinpoint when the market has the most volume, allowing you to tr
RQL_BOX Indicator — English Description (How to Use) What it does RQL_BOX   is a   manual range box tool   controlled by two draggable vertical lines: LEFT handle (v-line):   selects a candle on a chosen timeframe and sets the box   High/Low to that candle’s wicks . RIGHT handle (v-line):   defines   how far to extend   the box to the right (projection end). It then draws: the main box (range), optional   top/bottom 20% zones , an optional   50% midpoint line , and an on-chart   info panel   wit
FREE
Smart Moving Average MT4
Mostafa Saad Saeed Shawara
Titolo del prodotto Smart Moving Averages (MT4) – parte della serie SmartView Indicators Descrizione breve Indicatore Moving Averages con un'esperienza utente unica sulla piattaforma MetaTrader. Offre capacità avanzate non disponibili in precedenza, come aprire le impostazioni con doppio clic, nascondere e mostrare gli indicatori senza eliminarli, e visualizzare la finestra dell'indicatore a dimensione intera del grafico. Progettato per funzionare perfettamente con il resto della serie SmartView
FREE
Graphic shapes
Alexandr Lapin
5 (1)
Graphic Shapes -using history, it projects four types of graphical shapes at the moment, allowing you to determine the main ranges of price movement in the future, as well as gives an understanding of the main market reversals, while giving entry points by priority!The panel contains three types of figure sizes expressed by timeframes. They allow you to conduct a complete market analysis without using additional tools! The indicator is a powerful tool for forecasting price movements in the forex
FREE
Fibo Linear Channel
Igor Semyonov
4 (1)
Colored indicator of the linear channel based on the Fibonacci sequence. It is used for making trading decisions and analyzing market sentiment. The channel boundaries represent strong support/resistance levels, as they are the Fibonacci proportion levels. Users can select the number of displayed lines of channel boundaries on the chart by means of the input parameters. Attaching multiple instances of the indicator to the chart with different calculation periods leads to displaying a system of c
Description A colored universal multicurrency/multi-symbol indicator  MACD Classic Smart that consists of two indicators: MACD Line Smart and MACD Histo Smart. Both indicators are based on double or triple moving average . Comparing to the standard MACD Classic this indicator is more sensitive to what allows generating advance signals. he indicator may be used with any broker, irrespective of the name of the financial instrument since it is necessary to manually enter the name as an input parame
I Permanent
Vladimir Gorbachev
Universal adaptable indicator. It determines the estimated trading range for the current day based on the available history a real data, and displays the area of the probable price rollback on the chart. All this thanks to the built-in algorithm that automatically adapts to any behavior models of the market quotes. With the parameters adjusted, the indicator shows its effectiveness on most of the currency pairs, that have a rollback from the reached extremums during the current or the next tradi
Quatre
Maryna Shulzhenko
Quatre is a trend indicator, it indicates well the points of the beginning of the trend and its completion or reversal. This indicator is characterized by the following behavior: After a trend movement appears on the market, the indicator sends a signal of its beginning in the form of arrows. Quatre is a mathematical averaging of prices, and based on this, one can assume the direction of price movement (trend) in the future. Against the background of insignificant fluctuations, it is possible t
ChopEx
Joshua Iyanuoluw Adedeji
The Chop Exploder indicator is a custom indicator that has a long run, tight chop, short chop, and band colour. This indicator has MT4 alert notification,mobile notification, and email notification. The default indexing of all arrays and indicator buffers is left to right. The index of the first element is always equal to zero. Thus, the very first element of an array or indicator buffer with index 0 is by default on the extreme left position, while the last element is on the extreme right posit
L'indicatore costruisce le quotazioni attuali, che possono essere confrontate con quelle storiche e su questa base fanno una previsione del movimento dei prezzi. L'indicatore ha un campo di testo per una rapida navigazione fino alla data desiderata. Opzioni: Simbolo - selezione del simbolo che visualizzerà l'indicatore; SymbolPeriod - selezione del periodo da cui l'indicatore prenderà i dati; IndicatorColor - colore dell'indicatore; HorisontalShift - spostamento delle virgolette disegnate d
Friends, join us! Ask questions and connect with like-minded traders: MetaCOT Public Group MetaCOT Information Channel: news, CFTC reports, and signals: MetaCOT Channel Here’s to successful trading and new profitable signals for us all! Attention! Recently, certain countries have been blocking access to the cftc.gov website. As a result, users in these countries are giving the product low ratings. MetaCOT has always adhered to the highest quality standards and is in no way associated with th
FREE
Volume Istituzionale [tambangEA] Problema La maggior parte dei trader utilizza troppi strumenti separati per interpretare il mercato. Un indicatore per il volume, un altro per il VWAP, un altro per i livelli di supporto e resistenza, un altro per il momentum e un altro per il contesto di trading. Il risultato è solitamente lo stesso: un grafico affollato, segnali contrastanti, processi decisionali lenti e ingressi tardivi. Gli strumenti standard per l'analisi del volume presentano anche un'im
Indicatore Crypto_Forex "Relative Drawdown Display" per MT4, utile strumento di trading. Questo è un indicatore INDISPENSABILE per i trader che utilizzano sistemi di trading a griglia!!! - L'indicatore Relative Drawdown Display mostra il DD relativo corrente o il profitto variabile in % sul tuo account. - Gli avvisi per PC e dispositivi mobili sono integrati con livello di attivazione regolabile. - L'indicatore indica anche il saldo e il patrimonio netto dell'account. - È possibile individuare
Elevate Your Trading with the Ultimate Institutional Master System Discounted   Price   !!     Secure your lifetime access   now   before it switches to   subscription-only ! This all-in-one indicator displays real-time market algorithm .  Step into the world of institutional trading with the most comprehensive Smart Money Concept (SMC) and ICT Concept tool available on the market. Instead of cluttering your chart with multiple heavy indicators, we have engineered the core institutional trading
Rira Renko
Vitor Palmeira Abbehusen
RENKO on Time Chart This indicator is an enhanced Renko, so you can watch the Renko bricks on the chart to understand price movement more clearly the other improvement is automated box size according to ATR (Average True Range) period you can set the ATR number as you want and the box size of Renko changes automatically based on price movement Inputs Mode: Box size is the input to specify the size of the Renko box you want to print on the chart. This input lets you choose the fixed box siz
QQE Mod MT4
Filip Valkovic
The   Quantitative Qualitative Estimation   (QQE) indicator is derived from Wilder’s famous Relative Strength Index (RSI). In essence, the QQE is a heavily smoothed RSI. Modification of this version: (   converted from tradingview   script by Mihkell00, original from Glaz, 100% identical output) So there are Two QQEs. One that is shown on the chart as columns, and the other "hidden" in the background which also has a 50 MA   bollinger band   acting as a zero line. When both of them agree - y
Alpha Trend sign has been a very popular trading tool in our company for a long time. It can verify our trading system and clearly indicate trading signals, and the signals will not drift. Main functions: Based on the market display of active areas, indicators can be used to intuitively determine whether the current market trend belongs to a trend market or a volatile market. And enter the market according to the indicator arrows, with green arrows indicating buy and red arrows indicating se
The Vortex Indicator was inspired by the work of an Austrian inventor, Viktor Schauberger, who studied the flow of water in rivers and turbines. Etienne Botes and Douglas Siepman developed the idea that movements and flows within financial markets are similar to the vortex motions found in water. The Vortex Indicator was also partly inspired by J. Welles Wilder's concept of directional movement, which assumes the relationship between price bars gives clues as to the direction of a market. This i
Dynamic Forex28 Navigator
Bernhard Schweigert
4.43 (7)
Dynamic Forex28 Navigator - Lo strumento di trading Forex di nuova generazione. ATTUALMENTE SCONTATO DEL 49%. Dynamic Forex28 Navigator è l'evoluzione dei nostri indicatori popolari di lunga data, che combinano la potenza di tre in uno: Advanced Currency Strength28 Indicator (695 recensioni) + Advanced Currency IMPULSE con ALERT (520 recensioni) + CS28 Combo Signals (Bonus). Dettagli sull'indicatore https://www.mql5.com/en/blogs/post/758844 Cosa offre l'indicatore di forza di nuova generazione?
Description A colored multicurrency/multisymbol oscillator of the market mood. The oscillator is designed for detecting the continuation or change of the market mood prior to its occurrence. An excellent example is the screenshots that show all the features of the oscillator. The oscillator may be used with any broker, irrespective of the name of the financial instrument since it is necessary to manually enter the name as an input parameter. If you enter a non-existent or incorrect name of a fin
API BullBearPower mtf Designed for traders who rely on BullBearPower, this tool provides a multi-timeframe (MTF) view of BullBearPower, helping you identify possible dominant trends. Key Features: Multi-Timeframe Analysis – Analyze BullBearPower across different timeframes in real time. Dynamic Color Changes – Identify possible BullBearPower per individual timeframe with color changes. Volume Integration – Get a picture of possible trend strength with BullBearPower volume of each timefra
Profit MACD
Aleksey Ivanov
5 (2)
I present an indicator for professionals. ProfitMACD is very similar to classic MACD in appearance and its functions . However, ProfitMACD is based on completely new algorithms (for example, it has only one averaging period) and is more robust, especially on small timeframes, since it filters random price walks. The classic MACD indicator (Moving Average Convergence / Divergence) is a very good indicator following the trend, based on the ratio between two moving averages, namely the EM
Introduction It is common practice for professional trades to hide their stop loss / take profit from their brokers. Either from keeping their strategy to the themselves or from the fear that their broker works against them. Using this indicator, the stop loss / take profit points will be drawn on the product chart using the bid price. So, you can see exactly when the price is hit and close it manually.  Usage Once attached to the chart, the indicator scans the open orders to attach lines for t
Institutional Fusion Levels (Livelli di Fusione Istituzionale) Institutional Fusion Levels è un indicatore professionale di supporto e resistenza multi–timeframe, progettato per identificare zone di reazione del prezzo ad alta probabilità istituzionale utilizzando i livelli di struttura di mercato del giorno precedente, della settimana precedente e del mese precedente. L’indicatore traccia automaticamente sul grafico aree chiave di supporto e resistenza basate sulla liquidità e mette in evidenza
ForceWave
Michael Oko Oboh
Product Description ForceWave is an advanced momentum and trend-strength indicator designed to help traders identify market pressure, directional strength, and potential reversals with reduced repainting behavior. It analyzes price movement using a smoothed force-wave algorithm and displays bullish and bearish momentum directly in a separate indicator window for easier market interpretation. The indicator was developed with a focus on confirmed candle calculations, helping traders reduce false s
SC MTF Didi MT4
Krisztian Kenedi
Indicatore DIDI (rapporto 3-MM) con segnali a doppia linea, supporto multi-timeframe, segnali visivi personalizzabili e sistema di avvisi configurabile. Servizi di programmazione freelance, aggiornamenti e altri prodotti TrueTL disponibili sul mio profilo MQL5 . Feedback e recensioni sono molto apprezzati! Cos'è DIDI? DIDI è un indicatore di rapporto che mostra la relazione tra tre Medie Mobili (MM) con periodi diversi: Curta (corta), Media (media) e Longa (lunga). L'indicatore calcola due li
FREE
Smart Trend Forecasting Slope-Based Trend Analysis Indicator with Alert Support Overview Smart Trend Forecasting is a slope-based trend analysis indicator derived from a classic moving average trend model originally developed by Wizard Serg and referenced in Forex Magazine #104. The indicator is designed to monitor: Trend direction Momentum shifts Trend transition conditions Moving average slope behavior It includes visual markers and configurable alert notifications for trend state changes. Ma
Summary This indicator is based on RSI and Momentum indicators. It also considers moving averages of these two indicators. The three indicators have adjustable settings. The arrows do not repaint since the indicator only uses confirmed values and waits for the candle to close before painting an arrow. The indicator is also able to alert when arrows appear. There are 3 types of alerts - Popup, Email and Mobile Push Notifications. The arrows can be used in the EA and the inputs can also be optimiz
FREE
Current Strength
Nacer Kessir
5 (1)
The indicator (Current Strength) is represented in a separate window by Blue and Pink histogram . The parameter NPeriod represents the number of bars on which we calculate the variation of  forces, the recommended value is 5. The Blue histogram measures the  buyers force , while the Pink  histogram   measures the  sellers force . The change in color signifies the change in strength which leads t he price .  Each  drop (especially below 52.8) after touching levels 96.3 or 1.236 must be condidered
Gold Venamax MT4
Sergei Linskii
3 (2)
Gold Venamax : questo è il miglior indicatore tecnico azionario. L'algoritmo dell'indicatore analizza il movimento dei prezzi di un asset e riflette la volatilità e le potenziali zone di ingresso. Caratteristiche dell'indicatore: Questo è un super indicatore con Magic e due blocchi di frecce di tendenza per un trading comodo e redditizio. Sul grafico viene visualizzato il pulsante rosso per cambiare blocco. Magic è impostato nelle impostazioni dell'indicatore, in modo da poter installare l'indi
Gli utenti di questo prodotto hanno anche acquistato
Neuro Poseidon MT4
Daria Rezueva
4.94 (33)
Neuro Poseidon is a new indicator by Daria Rezueva. It combines precise trading signals with adaptive TP/SL levels - creating best possible trades as a result! Message me and get  Neuro Poseidon Assistant  as a gift to automize your trading process! What makes it stand out? 1. Proven profitability on all assets and timeframes 2. Only confirmed BUY and SELL signals present on the chart 3. Adaptive TP & SL levels generated by the software for each trade 4. Easy to understand - suitable for all
Gann Made Easy
Oleg Rodin
4.84 (165)
Gann Made Easy è un sistema di trading Forex professionale e facile da usare che si basa sui migliori principi del trading utilizzando la teoria di mr. WD Gann. L'indicatore fornisce segnali ACQUISTA e VENDI accurati, inclusi i livelli di Stop Loss e Take Profit. Puoi fare trading anche in movimento utilizzando le notifiche PUSH. CONTATTAMI DOPO L'ACQUISTO PER RICEVERE GRATUITAMENTE LE ISTRUZIONI DI TRADING E OTTIMI INDICATORI EXTRA! Probabilmente hai già sentito parlare molte volte dei metodi d
M1 Sniper
Oleg Rodin
5 (24)
M1 SNIPER è un sistema di indicatori di trading facile da usare. Si tratta di un indicatore a freccia progettato per l'intervallo temporale M1. L'indicatore può essere utilizzato come sistema autonomo per lo scalping sull'intervallo temporale M1 e come parte del tuo sistema di trading esistente. Sebbene questo sistema di trading sia stato progettato specificamente per il trading sull'intervallo temporale M1, può comunque essere utilizzato anche con altri intervalli temporali. Inizialmente ho pro
Trend Catcher ind
Ramil Minniakhmetov
5 (2)
INDICATORE TREND CATCHER L'indicatore Trend Catcher analizza i movimenti dei prezzi di mercato, utilizzando una combinazione di indicatori di analisi del trend proprietari dell'autore e personalizzati. Identifica la vera direzione del mercato filtrando il rumore a breve termine e concentrandosi sulla forza del momentum sottostante, sull'espansione della volatilità e sul comportamento della struttura dei prezzi. Utilizza inoltre una combinazione di indicatori personalizzati di smoothing e filtr
Questo indicatore è un indicatore per l'analisi automatica delle onde perfetto per il trading pratico! Caso... Nota:   non sono abituato a usare nomi occidentali per la classificazione delle onde a causa dell'influenza della convenzione di denominazione di Tang Lun (Tang Zhong Shuo Zen), ho chiamato l'onda base come   penna   e la banda dell'onda secondaria come   segmento   At allo stesso tempo, il segmento ha la direzione del trend. La denominazione   è principalmente segmento di trend   (que
KT Alpha Hunter Arrows MT4
KEENBASE SOFTWARE SOLUTIONS
La maggior parte degli indicatori a frecce ti dà un segnale e poi ti lascia capire da solo tutto il resto. KT Alpha Hunter Arrows ti offre un piano di trading completo. Ogni freccia di segnale viene visualizzata con un piano già tracciato: linea di ingresso, stop loss, quattro livelli di take profit e un verdetto edge in tempo reale che ti indica se quel simbolo e quel timeframe meritano di essere tradati in quel momento. Il pacchetto include un Trade Manager EA che gestisce l’esecuzione dopo il
Scalper Inside PRO
Alexey Minkov
4.74 (68)
Scalper Inside PRO Scalper Inside PRO is an intraday trend and scalping indicator for MetaTrader 4 that uses an exclusive algorithm to quickly detect market direction and key target levels. It automatically calculates entry, exit and multiple profit targets, and shows detailed performance statistics so you can see how different instruments and strategies performed. This helps you choose the most suitable trading instruments for the current market conditions. Additionally, you can easily integrat
Advanced Supply Demand
Bernhard Schweigert
4.91 (300)
Speciale Trading- SCONTO DEL 40% La soluzione migliore per qualsiasi trader principiante o esperto! Questo indicatore è uno strumento di trading unico, di alta qualità e conveniente, perché abbiamo incorporato una serie di funzionalità proprietarie e una nuova formula. Con questo aggiornamento, potrai visualizzare doppie zone di timeframe. Non solo potrai visualizzare un TF più alto, ma anche entrambi, il TF del grafico e il TF più alto: MOSTRA ZONE ANNIDATE. Tutti i trader che operano con Of
PRO Renko System
Oleg Rodin
5 (30)
PRO Renko System è un sistema di trading altamente accurato appositamente progettato per il trading di grafici RENKO. Questo è un sistema universale che può essere applicato a vari strumenti di trading. Il sistema neutralizza efficacemente il cosiddetto rumore di mercato che consente di accedere a segnali di inversione accurati. L'indicatore è molto facile da usare e ha un solo parametro responsabile della generazione del segnale. Puoi facilmente adattare lo strumento a qualsiasi strumento di
Current event:  https://c.mql5.com/1/326/A2SR2025_NoMusic.gif R. Cos'è l'A2SR ?   * È un indicatore tecnico leader (nessuna riverniciatura, nessun ritardo). -- Guida : -- su https://www.mql5.com/en/blogs/post/734748/page4#comment_16532516 -- e https://www.mql5.com/en/users/yohana/blog A2SR ha una tecnica speciale per determinare i livelli di supporto (domanda) e resistenza (offerta). A differenza del modo ordinario che abbiamo visto in rete, A2SR ha un concetto originale nel determinare i li
MetaBands M4
Vahidreza Heidar Gholami
3.5 (6)
MetaBands uses powerful and unique algorithms to draw channels and detect trends so that it can provide traders with potential points for entering and exiting trades. It’s a channel indicator plus a powerful trend indicator. It includes different types of channels which can be merged to create new channels simply by using the input parameters. MetaBands uses all types of alerts to notify users about market events. Features Supports most of the channel algorithms Powerful trend detection algorith
Genesis Matrix Pro is a professional multi-timeframe trend detection indicator designed to help traders identify high-quality market alignment with clarity and structure. It combines 12 different technical indicators into one visual alignment matrix, allowing traders to quickly see when market conditions are bullish, bearish, or neutral. A signal is generated only when the selected strategies are aligned, helping reduce noise and improve decision-making. PLEASE CONTACT ME AFTER PURCHASE TO GET
Questo prodotto è stato aggiornato per il mercato 2026 e ottimizzato per le ultime build di MT5. AVVISO DI AGGIORNAMENTO PREZZO: Smart Trend Trading System è attualmente disponibile a $99 . Il prezzo aumenterà a $199 dopo i prossimi 30 acquisti . OFFERTA SPECIALE: Dopo aver acquistato Smart Trend Trading System, inviami un messaggio privato per ricevere Smart Universal EA GRATIS e trasformare i tuoi segnali Smart Trend in operazioni automatiche. Smart Trend Trading System è un sistema di tradin
Breakout Arrows Mt4
Michael Oko Oboh
5 (1)
Trend Breakout Arrows Indicator The Trend Breakout Arrows Indicator is a momentum-based signal tool designed to identify potential bullish and bearish breakout opportunities. It displays clear arrow signals directly on the price chart, helping traders quickly recognize possible trend changes and continuation setups. Up Arrow (Buy Signal) A magenta up arrow appears below a candle when bullish momentum begins to strengthen. This signal indicates that buying pressure may be overtaking selling press
IQ FX Gann Levels a precision trading indicator based on W.D. Gann’s square root methods . It plots real-time, non-repainting support and resistance levels to help traders confidently spot intraday and scalping opportunities with high accuracy. William Delbert Gann (W.D. Gann) was an exceptional market analyst, whose trading technique was based on a complex blend of mathematics, geometry, astrology, and ancient mathematics which proved to be extremely accurate. Setup & Guide:  Download  MT5 Ver
PZ Swing Trading
PZ TRADING SLU
5 (3)
Protect against whipsaws: revolutionize your swing trading approach Swing Trading is the first indicator designed to detect swings in the direction of the trend and possible reversal swings. It uses the baseline swing trading approach, widely described in trading literature. The indicator studies several price and time vectors to track the aggregate trend direction and detects situations in which the market is oversold or overbought and ready to correct. [ Installation Guide | Update Guide | Tro
Scalper Vault
Oleg Rodin
5 (37)
Scalper Vault è un sistema di scalping professionale che ti fornisce tutto il necessario per scalping di successo. Questo indicatore è un sistema di trading completo che può essere utilizzato dai trader di forex e opzioni binarie. L'intervallo di tempo consigliato è M5. Il sistema fornisce segnali di freccia accurati nella direzione della tendenza. Ti fornisce anche i segnali più alti e più bassi e i livelli di mercato di Gann. Gli indicatori forniscono tutti i tipi di avvisi, comprese le notifi
Neo Wave PRO
Nikolay Raykov
5 (1)
Price & Time Market Structure Indicator A professional market structure tool that analyzes waves through both price and time — not price alone. Main Description NeoWave PRO is a professional market structure indicator for MetaTrader 4 designed for traders who want to move beyond traditional one-dimensional wave tools such as ZigZag, swing indicators, and basic high/low systems. Most wave indicators analyze only one thing: Price. But a real market wave is not only a price movement. A true wave de
GOLD Impulse with Alert
Bernhard Schweigert
4.67 (12)
Questo indicatore è una super combinazione dei nostri 2 prodotti Advanced Currency IMPULSE with ALERT  +   Currency Strength Exotics . Funziona per tutti i time frame e mostra graficamente l'impulso di forza o debolezza per le 8 valute principali più un simbolo! Questo indicatore è specializzato nel mostrare l'accelerazione della forza delle valute per qualsiasi simbolo come oro, coppie esotiche, materie prime, indici o futures. Primo nel suo genere, qualsiasi simbolo può essere aggiunto all
L'indicatore " Dynamic Scalper System " è progettato per il metodo di scalping, ovvero per il trading all'interno di onde di trend. Testato sulle principali coppie di valute e sull'oro, è compatibile con altri strumenti di trading. Fornisce segnali per l'apertura di posizioni a breve termine lungo il trend, con ulteriore supporto al movimento dei prezzi. Il principio dell'indicatore. Le frecce grandi determinano la direzione del trend. Un algoritmo per generare segnali per lo scalping sotto fo
È disponibile anche la versione MT5 https://www.mql5.com/it/market/product/170916 Versione Swing M30/H1/H4 disponibile Vuoi catturare i grandi movimenti? Gold Signal Swing Pro (M30/H1/H4). Obiettivo: $20-$80+ per trade. https://www.mql5.com/en/market/product/177643 KURAMA GOLD SIGNAL PRO (MT4) — Sistema di Trading XAUUSD Completo con Filtro a 7 Strati, TP/SL Automatico e Punteggio di Qualità NESSUN REPAINT. NESSUN RI
PZ 123 Pattern
PZ TRADING SLU
1 (1)
Unlock powerful breakout opportunities The 123 Pattern is one of the most popular, powerful and flexible chart patterns. The pattern is made up of three price points: a bottom, a peak or valley, and a Fibonacci retracement between 38.2% and 71.8%. A pattern is considered valid when the price breaks beyond the last peak or valley, moment at which the indicator plots an arrow, rises an alert, and the trade can be placed. [ Installation Guide | Update Guide | Troubleshooting | FAQ | All Products  ]
Apollo SR Master è un indicatore di Supporto/Resistenza con caratteristiche speciali che rendono il trading con le zone di Supporto/Resistenza più semplice e affidabile. L'indicatore calcola le zone di Supporto/Resistenza in tempo reale senza alcun ritardo, rilevando i massimi e i minimi dei prezzi locali. Quindi, per confermare la nuova area SR formata, l'indicatore mostra un segnale speciale che segnala che la zona SR può essere presa in considerazione e utilizzata come un vero e proprio segna
Il rilevatore di terremoti del mercato  del sismografo. Description in English : https://www.mql5.com/en/market/product/113869?source=Site+Market+Product+Page#description How to use the Seismograph : https://www.mql5.com/en/market/product/113869#!tab=comments&page=2&comment=52806941 Create an EA : https://www.mql5.com/en/market/product/113869#!tab=comments&page=3&comment=52816509 Qualunque sia il modo in cui fai trading, vuoi assolutamente evitare di entrare nel mercato a bassa liquidità.
ATTUALMENTE SCONTATO DEL 40% La soluzione migliore per ogni principiante o trader esperto! Questo indicatore è uno strumento di trading unico, di alta qualità e conveniente perché abbiamo incorporato una serie di caratteristiche proprietarie e una nuova formula. Con un solo grafico è possibile leggere la forza delle valute per 28 coppie Forex! Immaginate come migliorerà il vostro trading perché sarete in grado di individuare l'esatto punto di innesco di una nuova tendenza o di un'opportunità
Enigmera
Ivan Stefanov
5 (8)
ENIGMERA: Il cuore del mercato Importante: La demo di MQL5.com funziona nel Strategy Tester e potrebbe non riflettere completamente le funzionalità di Enigmera. Consulta la descrizione, gli screenshot e il video per maggiori dettagli. Non esitare a inviarmi un messaggio se hai domande! Il codice dell'indicatore è stato completamente riscritto. La versione 3.0 aggiunge nuove funzionalità e corregge i bug accumulati dall'inizio dell'indicatore. Introduzione Questo indicatore e sistema di trading
Introduction to Fractal Pattern Scanner Fractal Indicator refers to the technical indicator that makes use of the fractal geometry found in the financial market. Fractal Pattern Scanner is the advanced Fractal Indicator that brings the latest trading technology after the extensive research and development work in the fractal geometry in the financial market. The most important feature in Fractal Pattern Scanner is the ability to measure the turning point probability as well as the trend probabi
Trend Lines PRO
Roman Podpora
5 (1)
LINEE DI TENDENZA PRO       Aiuta a capire dove il mercato sta realmente cambiando direzione. L'indicatore mostra reali inversioni di tendenza e punti in cui i principali attori rientrano. Vedi  Linee BOS   Cambiamenti di tendenza e livelli chiave su timeframe più ampi, senza impostazioni complesse o rumore inutile. I segnali non vengono ridisegnati e rimangono sul grafico dopo la chiusura della barra. VERSIONE MT 5     -      Svela il suo massimo potenziale se abbinato all'indicatore   RFI LEVE
The Propfolio Master Suite is the ultimate all-in-one analytical workstation for professional traders. Combining the power of the Beat The Market Maker (BTMM) methodology, Smart Money Concepts (SND/Liquidity), and Advanced Volume Profile, this suite replaces multiple different indicators with one optimized engine. Monitor up to 14 pairs simultaneously from a single chart, instantly identify market cycles, and seamlessly map institutional footprints with the click of a button. The Command Center
RFI levels PRO
Roman Podpora
5 (1)
L'indicatore mostra accuratamente i punti di inversione e le zone di ritorno dei prezzi in cui il       Principali attori   . Vedi dove si formano le nuove tendenze e prendi decisioni con la massima precisione, mantenendo il controllo su ogni operazione. VERSION MT5     -     Rivela il suo massimo potenziale se combinato con l'indicatore   TREND LINES PRO Cosa mostra l'indicatore: Strutture di inversione e livelli di inversione con attivazione all'inizio di un nuovo trend. Visualizzazione dei l
Altri dall’autore
L'indicatore per Forex e Opzioni Binarie è scritto sulla base di 2 indicatori standard in MT4: ADX e RVI. I segnali arrivano alle intersezioni simultanee delle linee di entrambi gli indicatori. Ma anche l'inversione dei segnali è scritta nei codici. Questo è quando i segnali vengono convertiti all'indietro. È inoltre possibile attivare e disattivare ciascuno degli indicatori. E anche in RVI, puoi usare 2 tipi di segnali: 1) solo quando una linea è sopra/sotto l'altra (questo è buono da usare c
Super volumes
Yerzhan Satov
4 (1)
L'indicatore a quadrante per Forex e Opzioni Binarie è stato creato sulla base dei volumi di tick. A differenza di molti indicatori di volume, l'indicatore "Super volumes" calcola i volumi rialzisti e ribassisti e fornisce segnali sulla predominanza di uno di essi. Se diciamo che al momento in questo intervallo c'era un vantaggio dei volumi rialzisti, allora il segnale sarà su Buy. O se la prevalenza era di volumi ribassisti, quindi, di conseguenza, il segnale sarà su Sell. Nelle impostazioni
L'Indicatore a quadrante "Anaconda LD" è un indicatore di inversione per il mercato Forex e principalmente per le Opzioni Binarie. L'algoritmo è scritto sulla base di modelli di inversione. È meglio usarlo insieme ad altri indicatori per filtrare i segnali. Anche con quelli standard in MT4, anche altri personalizzati. Particolarmente adatti sono gli indicatori di canale o di livello... Per diversi beni è necessario selezionare il tempo di scadenza. Che su coppie diverse compongono 1-5 barre.
Cripton
Yerzhan Satov
L'indicatore a quadrante per opzioni binarie e Forex è un indicatore di inversione. Creato e scritto sulla base di modelli di inversione. Si consiglia per le opzioni binarie di metterlo sul grafico M5. Entra nelle offerte per 1-3 bar. Su una risorsa diversa, a seconda delle sessioni di trading, è necessario selezionare il tempo di scadenza.  È possibile modificare le impostazioni nelle variabili esterne. Pertanto, è possibile aumentare e diminuire la frequenza dei segnali. Le frecce dell'indic
L'indicatore a quadrante "crea un segnale freddo" per il mercato delle opzioni binarie e Forex è una sorta di costruttore dei suoi segnali! In cui tu stesso Puoi scegliere le tue condizioni di segnale in base a 10 indicatori standard in MT4 e oltre a un altro indicatore buffer di terze parti, che puoi aggiungere alla variabile "buffer indicators". È fatto semplicemente! Prescrivi il nome del tuo indicatore e prescrivi i suoi numeri (li troverai nella sezione dei colori in cui sono indicati i n
L'indicatore per le opzioni binarie e Forex "Highway profits" si basa sul principio di trovare il prezzo dietro le linee del canale. Dopo che il prezzo supera il canale e inizia gradualmente a tornare ad esso, è allora che appariranno i segnali. Il trading di un tale indicatore è molto facile e conveniente. E possono essere scambiati anche da un trader alle prime armi o da un trader con molti anni di esperienza. Per ogni risorsa è necessario selezionare le proprie impostazioni. Ad esempio, il
L'indicatore di segnale Space signals è il mio nuovo sviluppo per il trading nei mercati FOREX e delle opzioni binarie. L'algoritmo dell'indicatore è registrato in modo che rintracci la tendenza e segnali alla fine del movimento correttivo dei Prezzi. Nelle impostazioni, puoi impostare tu stesso il periodo dei segnali. Maggiore è il valore nella variabile "periodo", più rari saranno i segnali. Ma saranno naturalmente di qualità superiore.  Puoi anche selezionare i codici delle frecce sul graf
L'indicatore per il trading sul mercato Forex e le Opzioni Binarie è scritto sulla base dell'indicatore standard MT4 della media mobile semplice. Ma la differenza dall'indicatore standard è che le sue linee sono ridipinte in colori diversi a seconda dello Stato della tendenza. Se il colore è verde, la tendenza per l'acquisto. Se rosso, poi in vendita. Durante il cambiamento di fase di tendenza, viene visualizzato un avviso sonoro insieme a un buffer sul grafico al centro delle linee. Pertanto, è
The new Dynamic PACK Hi Tf indicator is based on tick volumes. The middle line shows the average price for the selected period of the selected senior timeframe. The upper and lower lines show the maximum/minimum of the same selected period of the same timeframe. In the settings, the user can optionally choose which timeframe and bar calculation period he needs. You can also change the style, thickness, and color of each of the lines.  In the "StsrtBars" parameter, you can select the start peri
The Level DELTA indicator for MetaTrader 4 (MT4) – a powerful volume analysis tool that stands out with its capabilities and accuracy. Indicator Description The Level DELTA indicator is designed for volume analysis in a separate MT4 window. Its main task is to identify and display divergences, allowing traders to make more informed and timely decisions. Indicator Features Volume Analysis : The indicator analyzes volumes in financial markets, allowing you to see how volumes are distributed over d
The "Volume POC WVAP" Indicator is a revolutionary tool for traders seeking in-depth analysis across various financial markets. This unique indicator, based on tick volumes in the MT4 terminal, provides indispensable information for making informed trading decisions in the following markets: Forex, binary options, cryptocurrency, spot, futures, and indices. Key Features: WVAP Line: Weighted Volume Average Price: The WVAP calculates the weighted volume average price on the selected timeframe, all
POC, Volume Profile, Market Profile, Volume Indicator, Dynamic POC, Tick Volume, Forex Volume The Dynamic POC Hi Tf Arrow indicator is a reliable volume analysis tool (volume profile, market profile, tick volume) for accurately determining POC levels and price reactions. Dynamic POC Hi Tf arrow for MT4 Description Dynamic POC Hi Tf arrow is a professional volume analysis indicator designed to accurately identify key price levels and market direction. It is built on tick volume data and displ
Quantum Empire GRID PRO - Next Generation Trading System Revolutionary Trading Technology Quantum Empire GRID PRO represents a breakthrough in automated trading, combining intelligent grid strategy with averaging system and signal filtering. After 2+ years of real-market testing, this EA has proven its stability and profitability across various asset classes. Key Features: Smart Averaging System : When closing a series of trades, profit averages 3:1 relative to losses 4 Signal Mode
Quantum Dynamic POC Hi Tf for MT5 Description: The "Quantum Dynamic POC Hi Tf" is a unique indicator developed for volume analysis. It is suitable for both real volumes (on futures contracts) and tick volumes (on the Forex market). The indicator is a channel tool consisting of three lines that dynamically change depending on the selected timeframe: Middle Line : the main dynamic Point of Control (POC), which reflects the average volume price. Upper Line : the maximum of the selected timeframe. L
The Quantum   DELTA indicator for MetaTrader 5 (MT5) – a powerful volume analysis tool that stands out with its capabilities and accuracy. Indicator Description The Quantum   DELTA indicator is designed for volume analysis in a separate MT5 window. Its main task is to identify and display divergences, allowing traders to make more informed and timely decisions. Indicator Features Volume Analysis : The indicator analyzes volumes in financial markets, allowing you to see how volumes are distribute
Title: MACD Signals Discover the MACD Signals indicator – your reliable assistant in the world of trading! Description: The "MACD Signals" indicator is designed to make your trading more successful and efficient. It displays signals on the main chart as bright vertical lines that are easy to spot. You can customize the color and thickness of these lines to perfectly match your style and preferences. Features: Signals: Vertical lines on the main chart that stand out among other elements.
Filtro:
Nessuna recensione
Rispondi alla recensione