Quantum Dynamic POC Hi Tf

Quantum Dynamic POC Hi Tf for MT5

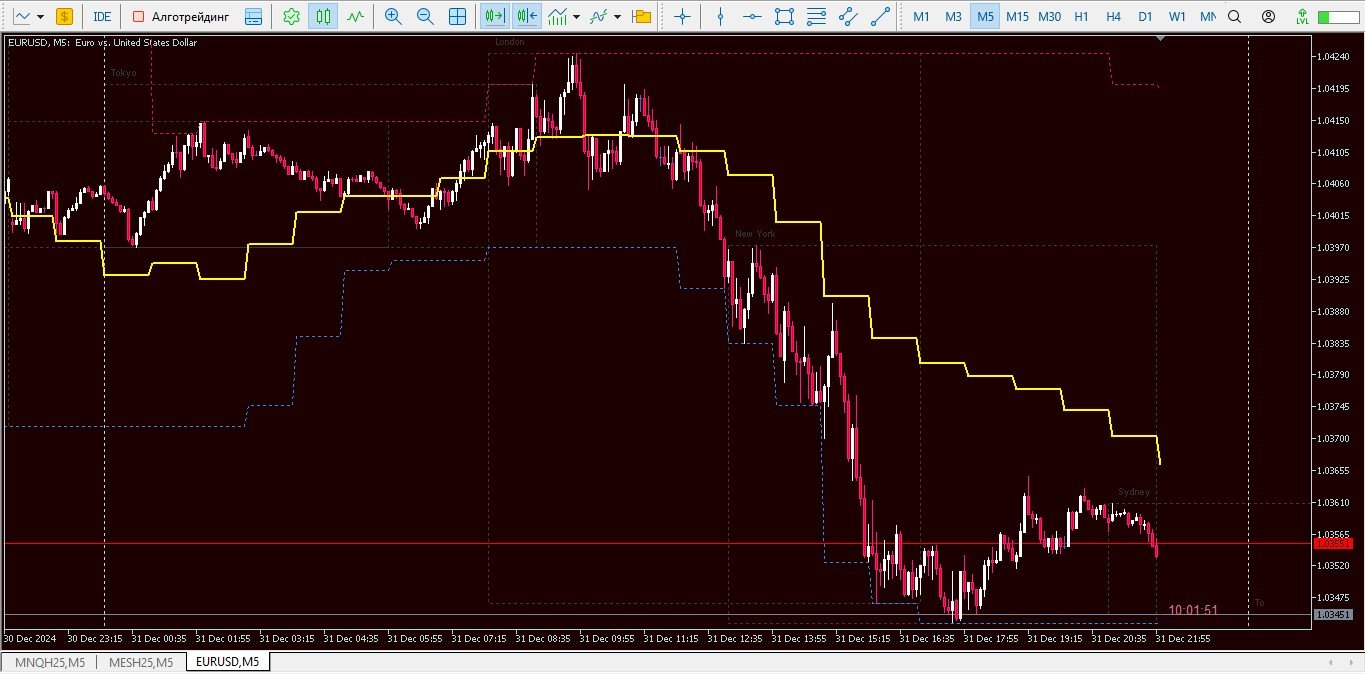
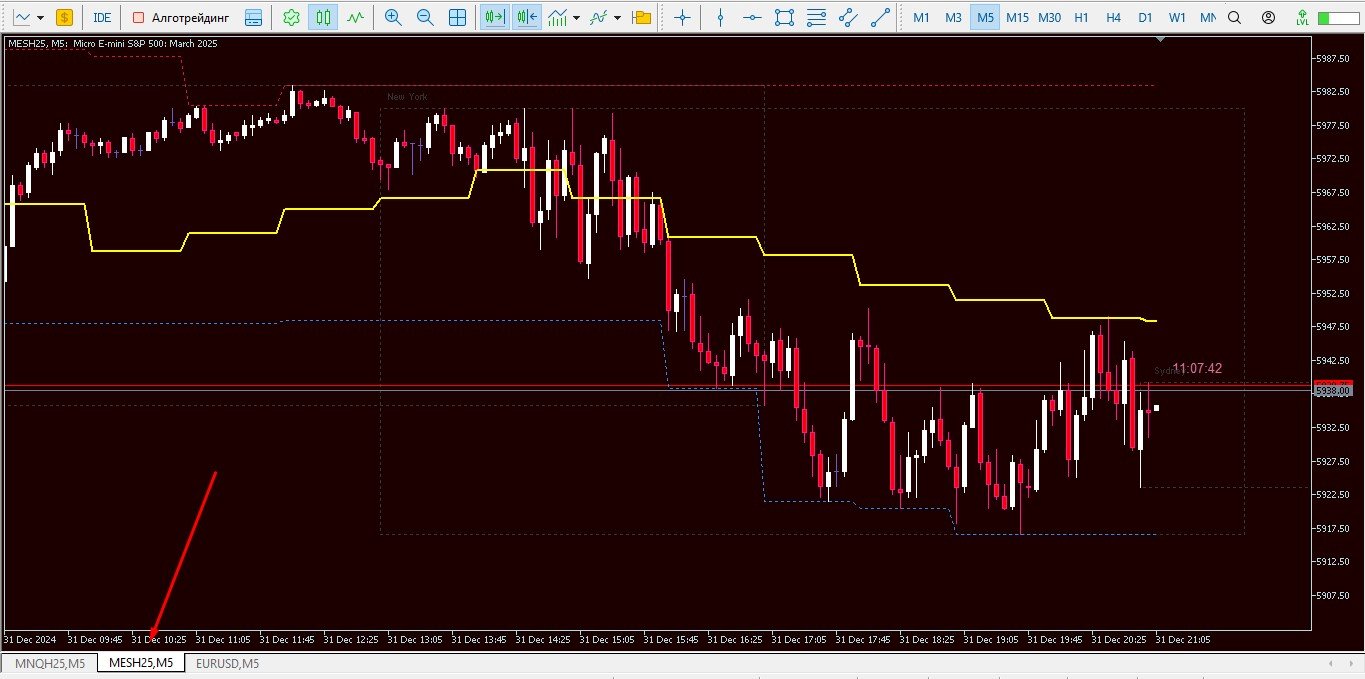
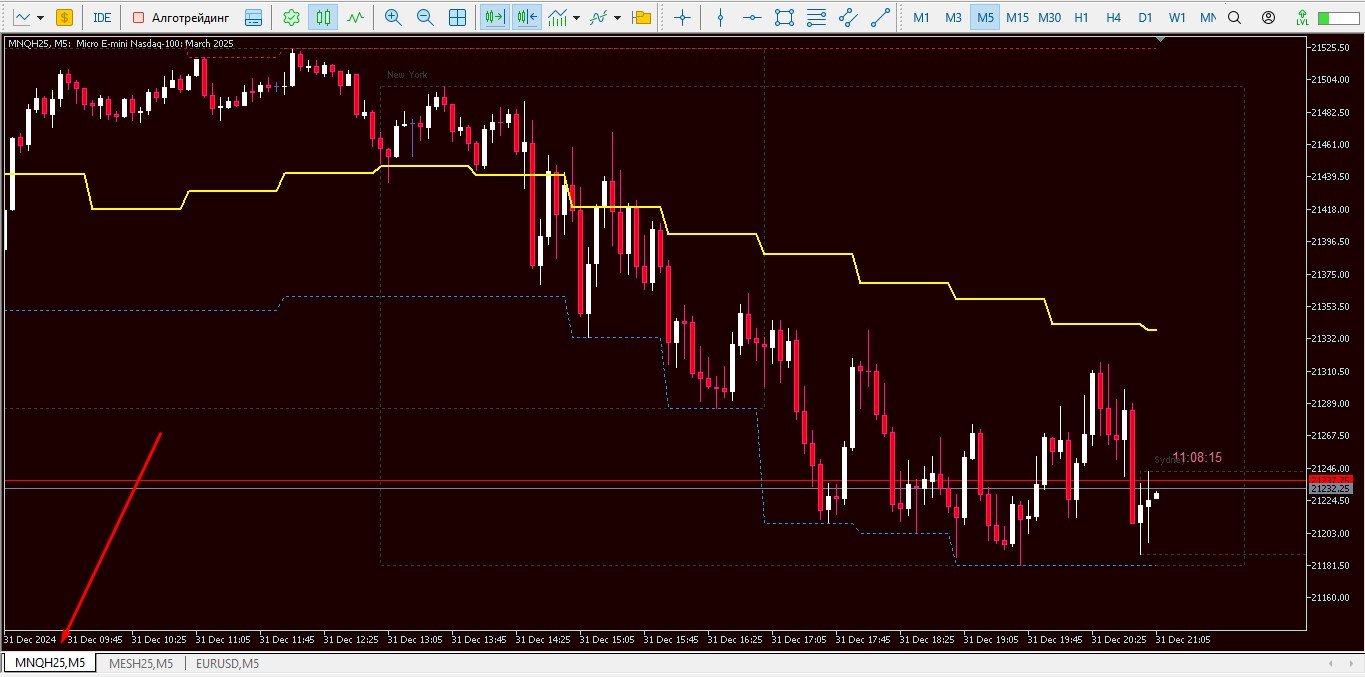
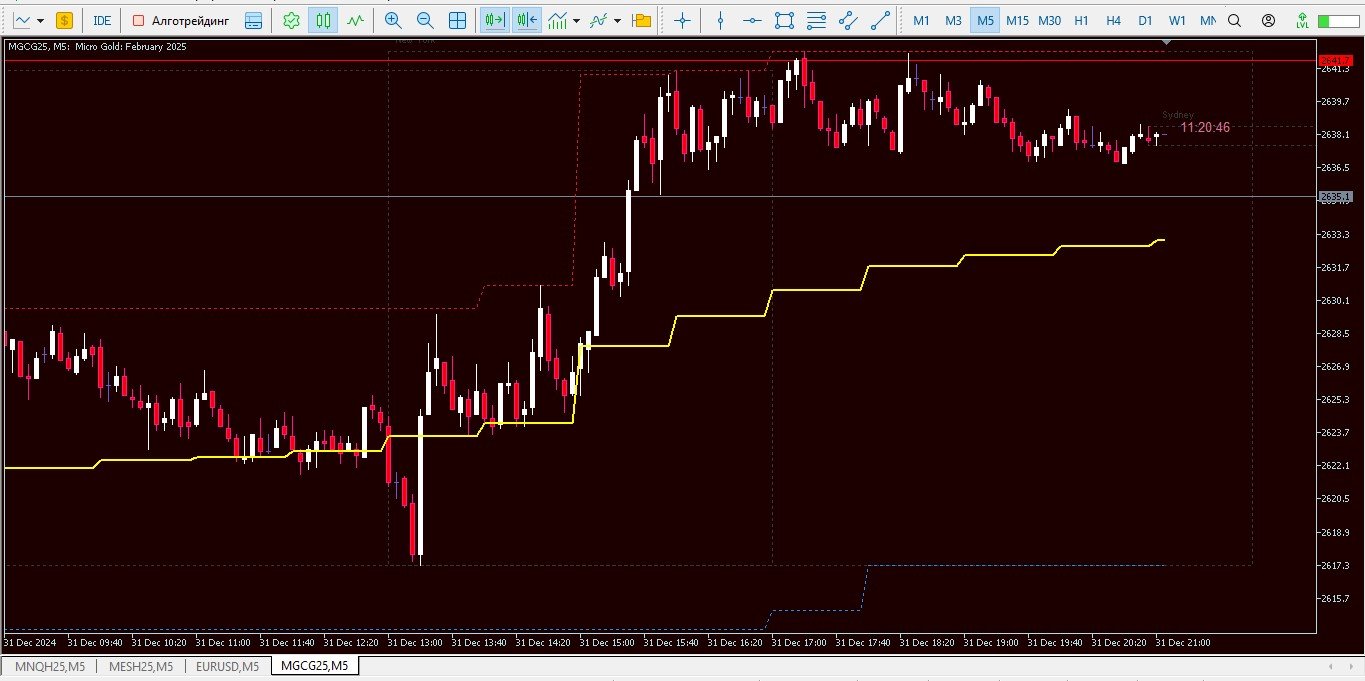
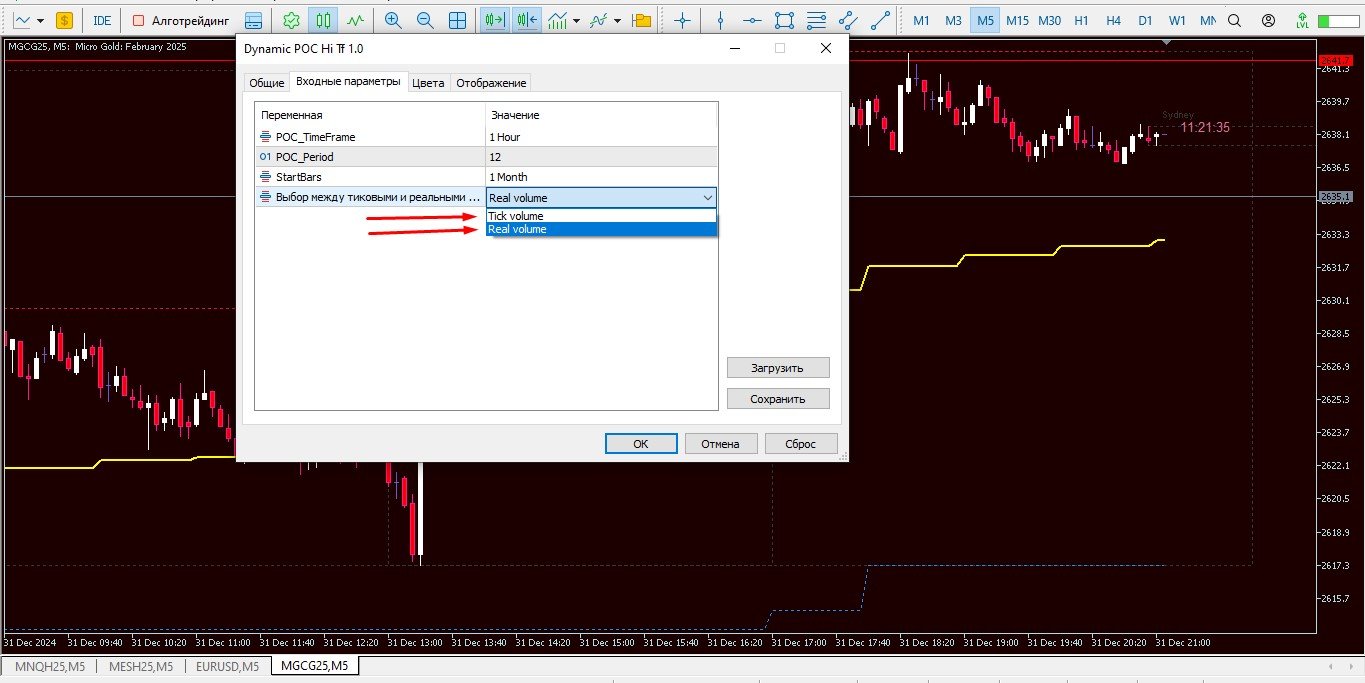
Description: The "Quantum Dynamic POC Hi Tf" is a unique indicator developed for volume analysis. It is suitable for both real volumes (on futures contracts) and tick volumes (on the Forex market). The indicator is a channel tool consisting of three lines that dynamically change depending on the selected timeframe:

  • Middle Line: the main dynamic Point of Control (POC), which reflects the average volume price.

  • Upper Line: the maximum of the selected timeframe.

  • Lower Line: the minimum of the selected timeframe.

Key Features and Benefits:

  • Dynamic Display: The indicator automatically adapts to changing market conditions, providing up-to-date data for making trading decisions.

  • Flexible Settings: The user can choose any higher timeframe for calculating the dynamic average volume price, as well as the bar period and calculation start (day, week, month).

  • Visual Clarity: Color schemes and graphical elements ensure ease of perception and data analysis.

Entry Conditions:

  • POC Breakout:

    • If the price breaks through the POC from below, open buy positions.

    • If the price breaks through the POC from above, open sell positions.

  • Stop-Loss:

    • Set the stop-loss above/below the POC line or below the nearest high/low of the current timeframe.

  • Take-Profit:

    • Set the take-profit on the upper/lower lines of the indicator.

    • Partially close positions at these levels to reduce risks.

Recommended Settings:

  • By default, the indicator is set to the M5 chart with calculations based on the H1 higher timeframe.

  • For trading on the M15 chart, it is recommended to set the higher timeframe to H4 or D1 for the most accurate and useful data.

Advantages of Using "Quantum Dynamic POC Hi Tf":

  • Improved Trading Results: The indicator helps to determine key support and resistance levels, allowing for more informed trading decisions.

  • Risk Reduction: Accurate signals for opening and closing positions help to minimize risks and increase profits.

  • Ease of Use: Simple and intuitive settings make the indicator accessible to traders of any level.


Prodotti consigliati
Symbol Cost Info
Opeyemi Fuad Anokwu
Introducing the “Symbol Cost Info MT5” indicator – your ultimate tool for staying ahead in the forex market! This innovative indicator is designed to empower traders with real-time cost information, directly on their charts. Here’s why every trader needs the “Symbol Cost Info MT5” in their arsenal: Real-Time Spread Monitoring : Keep a close eye on the spread for any currency pair, ensuring you enter the market at the most cost-effective times. Pip Value at Your Fingertips : Instantly know the v
FREE
Breakeven line calculator
Wafa Mohammed Omar Abou Alwafa
5 (2)
This indicator shows the breakeven line level for the total number of open positions of the current symbol with P/L value and total volume. This indicator is helpful to decide the exit level when using a trading grid strategy. The style of the breakeven line is customizable to choose the color, line shape and font size of the positions description. Send mobile notification when crossing a positive P/L target
FREE
Real-Time Spread Display Tool A   real-time spread display tool   is a specialized software or application designed to provide traders and investors with instant, live data on the   spread —the difference between the bid price (the price at which buyers are willing to purchase an asset) and the ask price (the price at which sellers are willing to sell it)—for various financial instruments. This tool is critical in markets such as forex (FX), stocks, futures, and cryptocurrencies, where price f
Trade Condition Logger MT5
AbelPM Enterprises Pty Ltd
The   Trade   Condition   Logger   is   an   essential   tool,   offering   crucial   insights   into: Current   swap   and   spread   values Automatic   logging   of   fluctuations   in   swap   values Logging spread   value   range over   time Optimise   spread   values for specific instrument Displays   a   comprehensive   summary   on   the   chart,   providing   traders   with   insights   into   trade   conditions.  Review trade conditions for your various   broker   accounts   enabling  
Trending Purpose Pro
G C Hency Shameela
he "Trending Purpose Pro" is easy to use, even for traders with limited programming knowledge.  It provides a straightforward representation of the high prices on the chart, allowing traders to quickly identify the highs of each candlestick.Customizable Appearance:  The appearance can be easily customized to suit individual preferences. Traders can adjust the color, line style, and width of the high price line according to their charting preferences.Real-Time Data: The "Trending Purpose Pro" ca
Clear Candle Countdown for Every Chart Knowing the exact time left until the current candle closes helps in making timely trading decisions. Candle Timer Essential MT5 offers a visible countdown for all available MT5 timeframes directly on your chart. This tool is reliable, efficient, and easy to configure. Features Real-time candle countdown for all standard MT5 timeframes Customizable color scheme for header, timer, and description Auto-adaptive layout for optimal visibility on any chart Effic
MarketMind AI
Perpetual Chinemerem Vincent
MarketMind AI Next-Generation Contextual Analysis for MetaTrader 5 Trade with the clarity of institutional-grade context. MarketMind AI is a professional decision-support system designed to bridge the gap between raw technical data and actionable market intelligence. Rather than generating signals or executing trades, MarketMind AI provides a structured, high-fidelity view of market conditions — enabling traders to make more informed discretionary decisions. USER GUIDE AND ANALYSIS PIPELINE AP
Justo mini indice
Pedro Augusto Escoque Marin
Este indicador calcula e exibe no gráfico o preço justo do mini índice (WIN) com base em dados fundamentais do mercado. Além disso, ele traça automaticamente linhas de suporte e resistência percentuais , ajudando você a visualizar zonas importantes de preço. É como ter uma régua financeira no gráfico, mostrando onde o preço "deveria estar", de forma objetiva, considerando o cenário macroeconômico! O indicador usa uma fórmula de precificação de contratos futuros baseada em: O preço à vista do Ib
RSI Pro Basic
VALU VENTURES LTD
The ONLY RSI Indicator You'll Ever Need - Works with ANY Broker, ANY Symbol! Finally, an RSI indicator that automatically adapts to YOUR broker's symbol naming conventions!   Whether you trade Forex, Gold, Bitcoin, or Stock Indices - this universal indicator detects and monitors related symbols automatically. KEY FEATURES & BENEFITS UNIVERSAL COMPATIBILITY Auto-Detects Broker Patterns : Works with ANY broker suffix (.m, .pro, .raw, etc.) All Asset Classes : Forex, Metals (Gold/Silver), Crypto,
FREE
Trade Performance Information
Andres Mauricio Serrano Quintero
This indicator will help you track performance of your trades, even scalping trades.  You can use it with the Arab, and many other traders.  This indicator displays essential trading account information directly on your chart. It positions itself in one of the four corners of the screen and showcases details such as: Symbol: The symbol of the asset currently displayed on the chart. Profit/Loss: The total profit or loss in dollars for the current symbol. Pips: The total number of pips gained or
FREE
Powerful trend indicator provided with all necessary for trade and it is very easy to use. Everyone has probably come across indicators or Expert Advisors that contain numerous input parameters that are difficult to understand. But here, input parameters are simple and it is no need to configure anything — neural network will do all for you. Difference from a classic version The real-time multi time frame panel is added, so you can check a trend for other timeframes without switching the schedu
MultiSession Volume Profile is a professional volume profile indicator for MetaTrader 5 that builds separate POC, VAH, VAL and volume histograms for multiple custom trading sessions on the same chart. It helps you see where volume truly concentrated in each part of the day (RTH, Globex, Asia, London, etc.), so you can identify key intraday levels, ranges, and magnets that many standard tools miss. ​ Main advantages Multi-session profiles Build up to 5 fully independent sessions with custom times
WAPV Box Effort x Result
Eduardo Da Costa Custodio Santos
RISULTATO WA_PV_BOX_EFFORT X per MT5 Il WAPV Box Effort x Result Indicator fa parte del gruppo Package Indicators (Wyckoff Academy Wave Market). L'indicatore WAPV Box Effort x Result Indicator per MT5 ti aiuta a leggere il prezzo e il volume. La sua lettura consiste nell'assistere nell'identificazione dello sforzo x risultato in onde create dal grafico. L'indicatore WAPV Box Effort x Result Indicator per MT5 quando la casella è verde significa che il volume è a favore della domanda e quando la c
Smart Fair Value Gap Pro
Joao Luiz Savioli Filho
Unlock the power of Smart Money Concepts (SMC) with the cleanest FVG indicator on the market. Smart FVG Pro is not just another gap detector. It is designed for professional traders who need to filter out noise and focus on high-probability reversal zones. Unlike standard indicators that clutter your chart with every minor gap, Smart FVG Pro uses advanced filtering logic (Trend + Volatility) and a unique "Smart Mitigation" system to automatically remove invalidated zones, keeping your chart clea
Sessions Premium
Edson Javier Jaramillo Diaz
1 (1)
Session Boxes - Advanced Market Sessions Visualization Indicator Overview The Session Boxes indicator is a powerful and highly customizable tool designed to help traders visualize major trading sessions directly on their charts. By clearly displaying the Asian, London, New York, Sydney, and Frankfurt sessions, traders can easily identify optimal trading times and potential market volatility periods. Key Features Multiple Session Support - Asian Session (Default: 00:00-09:00) - London Session
Buy Sell Multiple
Hoai Phuong Tran
Buy Sell Multiple Panel - Execute Bulk Orders in a Single Click! Description: Save time and seize market opportunities instantly. This powerful panel allows you to place multiple buy or sell orders simultaneously, each with custom lot sizes, take-profit, and stop-loss levels. Perfect for sophisticated entry strategies and managing complex trades efficiently. Key Features: Bulk Order Execution: Open multiple market orders at once with just one click. Flexible Lot Sizing: Set individual lot size
RQL Trend Board – Description RQL Trend Board is a simple but powerful multi-timeframe trend dashboard. It shows the current market bias across several timeframes at the same time, using an internal trend-classification method. Each timeframe is displayed as a colored box: Green – bullish bias → look for long setups Yellow – ranging / unclear → no trade zone Red – bearish bias → look for short setups The indicator gives a clear overall picture of where the market wants to go, instead o
FREE
Live Price With PNL
Muhammad Jawad Shabir
INDICATORE VISUALIZZAZIONE PREZZO LIVE E PROFITTO TOTALE PERFETTO PER TRADING LIVE E CONDIVISIONE SCHERMO Progettato specificamente per day trader, scalper e sessioni di trading in streaming live Questo indicatore professionale fornisce visualizzazione prezzi in tempo reale e tracciamento completo dei profitti direttamente sul tuo grafico - essenziale per trading ad alta frequenza e trasmissioni di trading live. CARATTERISTICHE PRINCIPALI VISUALIZZAZIONE PREZZO IN TEMPO REALE Aggiornamenti prezz
FREE
Wolf Countdown
Tiziano Zambelli Sopalu
Wolf Countdown helps you not to waste the right amount of time, it gives you back the time remaining until the candle closes. How to use: Download and install the  Wolf Countdown Indicator on your MetaTrader 5. Apply the indicator to your favorite chart. this works on any timeframe... Thanks to this indicator you will never miss the right moment to enter your trades.
FREE
Distance Average Bands
Luis Paulo Rodrigues Pastor
A very assertive and easy-to-view indicator, which can be used in any financial asset. This indicator aims to show moments when the average price deviation in relation to the average deviation exceeds the configured standard deviation. Step 1: We measure the distance between the price and the average configured in the "MAPrice" parameter; Step 2: We calculate the average "MADistancePeriod" of the distances measured in Step 1. Step 3: We calculate the standard deviation "Deviation" from th
Telegram to mt5 signal copier
Chukwuemeka Kingsley Anyanwu
5 (1)
Copies Signal from any Telegram channel and instantly executes the trade on MT5 without admin rights! Do you receive trading signals on Telegram and wish they could execute instantly on Meta Trader 5? READ THIS FOR SETUP GUIDE Telegram to MT5 Signal Copier is a powerful bridge between your Telegram signal channels and MetaTrader 5. It listens to messages from a specific Telegram channel and automatically extracts trading signals — including symbol, action, entry price, stop loss, and take prof
Gamma Volatility Levels
Carlos Pascual Perez Maturano
Gamma & Volatility Levels Pro [XAUUSD Edition] – The indicator used by professional gold traders in 2025 Fully automatic indicator developed exclusively for XAUUSD (Gold). Displays in real time the most powerful institutional levels that move gold price every single day: • HVL (High Volatility Level) – Orange dashed line Dynamic extreme volatility level (20-period SMA + 1 standard deviation). Gold bounces or breaks this level 87 % of sessions with moves of +$40 to +$120. • CALL RESISTANCE – Blue
The “Summary Risk Target” indicator is designed to show the total number of transactions made on a single pair. The transactions counted include active positions as well as pending orders . By setting a stop loss for each trade, this indicator displays the total potential risk (loss) that may be incurred. This helps traders easily understand their overall risk exposure without the need for manual calculations. Likewise, for take profit , if the TP level is defined—either in terms of pips or at a
FREE
1. Overview Thank you for choosing the SuperTrend Suite for MT5. This package provides a set of powerful tools for trend analysis, designed to integrate seamlessly into your MetaTrader 5 platform. This suite includes two components: SuperTrend Indicator : A robust trend-following indicator that displays the current market trend directly on your chart, complete with entry signals and alerts. SuperTrend Screener EA : A multi-symbol dashboard that scans a user-defined list of instruments in the bac
FREE
DESCRIÇÃO O indicador   EasyFollowerTrader-Bot2-DayTrade   opera apenas a favor da tendência. Assim, o indicador, em primeiro momento, observar a tendência de três médias síncrona com o time-frame selecionado. Em seguida, o indicador observar a tendência do gráfico diário. Quando estes dois gráficos estiverem se movimentando na mesma direção, teremos a maior probabilidade de ganhos. Chamaremos esta região como região de alta probabilidade de ganho. Na região de alta probabilidade de ganho, o ind
Airplane   Trend   entry points should be used as potential market reversal points. The indicator works using the cyclic-wave dependence function. Thus, all entry points will be optimal points where the movement changes. The simplest way to use the indicator is to open a trade in the direction of an existing trend. The best result is obtained by combining the indicator with fundamental news, it can act as a news filter, that is, it can show how the market reacts to this or that news. The defa
You can see Binance Spot data instantly in Metatrader 5 and it allows you to use all the features that Metatrader has provided to you. You can access the data of all symbols listed on Binance Futures. Don't forget to set the timezone. Binance it's 00:00 UTC. You need to fix it according to your own country You need to install the free Binance Spot Symbol List plugin. https://www.mql5.com/tr/market/product/83507 After loading, it automatically downloads the data of the cryptos in the market obser
Forex Relative Performance indicator This indicator calculates the relative strength of major currencies against the US dollar. The basic idea behind this indicator is "to buy strong currency and to sell weak currency". This indicator allows you to quickly identify the best forex pair to trade according to your trading style (Intraday, Scalping, Swing, or Long Term)
The Price Spectrum indicator reveals opportunities for detailed market analysis. Advantages: Market Volume Profile Creation : The indicator assists in analyzing the dynamics of trading volumes in the market. This allows traders to identify crucial support and resistance levels, as well as determine market structure. Filtering Insignificant Volumes : Using the indicator helps filter out insignificant volumes, enabling traders to focus on more significant market movements. Flexible Configuration S
Pendiente de Precio
Cesar Juan Flores Navarro
Indicador en base a la pendiente de la linea de precio, dibuja una línea de color cuando sube a base de los precios que previamente has sido procesados o linealizados, y cuando baja la pendiente la linea linealizada toma otro color. En este caso se a considerado 6 lineas de diferentes procesos desde pendientes largas hacia las cortas, observándose que cuando coincidan las pendientes se produce un máximo o mínimo, lo que a simple vista nos permitirá hacer una COMPRA O VENTA.
Gli utenti di questo prodotto hanno anche acquistato
ARICoins
Temirlan Kdyrkhan
ARICoin is a powerful trading companion designed to generate high-probability entry signals with dynamic TP/SL/DP levels based on volatility. Built-in performance tracking shows win/loss stats, PP1/PP2 hits, and success rates all updated live. Key Features: Buy/Sell signals with adaptive volatility bands Real-time TP/SL/DP levels based on ATR Built-in MA Filter with optional ATR/StdDev volatility Performance stats panel (Success, Profit/Loss, PP1/PP2) Alerts via popup, sound, push, or email Cust
AriX
Temirlan Kdyrkhan
1 (4)
AriX Indicator for MT5 A powerful trend-following and signal-evaluation tool AriX is a custom MT5 indicator that combines Moving Averages and ATR-based risk/reward logic to generate clear buy/sell signals. It visualizes dynamic SL/TP levels, evaluates past trade outcomes, and displays win/loss statistics in a clean on-chart panel. Key features include: Buy/Sell signals based on MA crossovers ATR-based SL/TP1/TP2/TP3 levels with visual lines and labels Signal outcome tracking with real-time stat
Azimuth Pro
Ottaviano De Cicco
5 (1)
LAUNCH PROMO Azimuth Pro price is initially set at 299$ for the first 100 buyers. Final price will be 499$ . THE DIFFERENCE BETWEEN RETAIL AND INSTITUTIONAL ENTRIES ISN'T THE INDICATOR — IT'S THE LOCATION. Most traders enter at arbitrary price levels, chasing momentum or reacting to lagging signals. Institutions wait for price to reach structured levels where supply and demand actually shift. Azimuth Pro maps these levels automatically: swing-anchored VWAP, multi-timeframe structure lines, an
ARIScalping
Temirlan Kdyrkhan
ARIScalp is a powerful trading companion designed to generate high-probability entry signals with dynamic TP/SL/DP levels based on volatility. Built-in performance tracking shows win/loss stats, PP1/PP2 hits, and success rates all updated live. Key Features: Buy/Sell signals with adaptive volatility bands Real-time TP/SL/DP levels based on ATR Built-in MA Filter with optional ATR/StdDev volatility Performance stats panel (Success, Profit/Loss, PP1/PP2) Alerts via popup, sound, push, or email Cus
Weis Wave with Alert MT5
Trade The Volume Waves Single Member P.C.
4.94 (17)
Rental/Lifetime Package Options and Privileges  Rent Monthly Six Months   Yearly/Lifetime Weis Wave with Speed with Alert+Speed Index x x x Manual  x x x Quick Set up Video x x x Blog x x x Lifetime Updates x x x Setup and Training Material x x Discord Access Channel "The SI traders"          x Rectangle Break Alert Tool      x How to trade with it:    http://www.tradethevolumewaves.com   ** If you purchase please contact me to setup your  : Training Room and  complete manual access.  Wei
Innanzitutto, vale la pena sottolineare che questo Strumento di Trading è un Indicatore Non-Ridipingente, Non-Ridisegnante e Non-Laggante, il che lo rende ideale per il trading professionale. Corso online, manuale utente e demo. L'Indicatore Smart Price Action Concepts è uno strumento molto potente sia per i nuovi che per i trader esperti. Racchiude più di 20 utili indicatori in uno solo, combinando idee di trading avanzate come l'Analisi del Trader del Circolo Interno e le Strategie di Tradin
MetaForecast M5
Vahidreza Heidar Gholami
5 (3)
MetaForecast predice e visualizza il futuro di qualsiasi mercato basandosi sull'armonia dei dati dei prezzi. Sebbene il mercato non sia sempre prevedibile, se esiste un modello nei prezzi, MetaForecast può prevedere il futuro con la massima precisione possibile. Rispetto ad altri prodotti simili, MetaForecast può generare risultati più accurati analizzando le tendenze di mercato. Parametri di input Past size (Dimensione passata) Specifica il numero di barre che MetaForecast utilizza per creare
ARIPoint
Temirlan Kdyrkhan
1 (1)
ARIPoint is a powerful trading companion designed to generate high-probability entry signals with dynamic TP/SL/DP levels based on volatility. Built-in performance tracking shows win/loss stats, PP1/PP2 hits, and success rates all updated live. Key Features: Buy/Sell signals with adaptive volatility bands Real-time TP/SL/DP levels based on ATR Built-in MA Filter with optional ATR/StdDev volatility Performance stats panel (Success, Profit/Loss, PP1/PP2) Alerts via popup, sound, push, or email Cu
How many times have you bought a trading indicator with great back-tests, live account performance proof with fantastic numbers and stats all over the place but after using it, you end up blowing your account? You shouldn't trust a signal by itself, you need to know why it appeared in the first place, and that's what RelicusRoad Pro does best! User Manual + Strategies + Training Videos + Private Group with VIP Access + Mobile Version Available A New Way To Look At The Market RelicusRoad is the
Elliott Wave Trend was designed for the scientific wave counting. This tool focuses to get rid of the vagueness of the classic Elliott Wave Counting using the guideline from the template and pattern approach. In doing so, firstly Elliott Wave Trend offers the template for your wave counting. Secondly, it offers Wave Structural Score to assist to identify accurate wave formation. It offers both impulse wave Structural Score and corrective wave Structure Score. Structural Score is the rating to sh
Max Ribbon Mt5
Stefano Frisetti
ATTENZIONE: Questo indicatore è distribuito ESCLUSIVAMENTE su MQL5.com Versione MT4:   https://www.mql5.com/it/market/product/160363 Versione MT5:   https://www.mql5.com/it/market/product/160410 ================================================================================ MAX RIBBON ver 1.00 L'indicatore che ti mostra il TREND in modo chiaro e inequivocabile! ================================================================================ DESCRIZIONE MAX RIBBON è un indicatore di trend
FootprintOrderflow
Jingfeng Luo
5 (3)
FOOTPRINTORDERFLOW: The Authoritative Guide ( This indicator is also compatible with economic providers that do not offer DOM data and BID/ASK data, It also supports various foreign exchange transactions ) 1. Overview FOOTPRINTORDERFLOW  is an advanced Order Flow analysis tool designed for MetaTrader 5 (MT5). Unlike traditional candlestick charts that only show OHLC (Open, High, Low, Close), this indicator parses real-time Tick data to visualize the microstructure inside every candle. It helps y
SynaptixQuant Dominance Matrix
Devie Arevalo Montemayor
5 (1)
SynaptixQuant Dominance Matrix: Institutional-Grade Market State Extraction Engineered for traders who require a data-driven view of market behaviour beyond surface-level indicators. The Synaptix Quant (SQ) Dominance Matrix is not a conventional currency strength display. Behind its intentionally streamlined interface runs a sophisticated analytical architecture designed to quantify market conditions with precision. Every output is generated through layered signal processing built to identify d
+++++++++++++++++++++++++++++++++++++++++++++++++++++++++++++++++++++++++++++++++++++++++++++++++ +++ Link to EURUSD Only Free Version -->  https://www.mql5.com/en/market/product/156904?source=Unknown +++++++++++++++++++++++++++++++++++++++++++++++++++++++++++++++++++++++++++++++++++++++++++++++++ Hallo Trader, This is a traditional GANN & FIBONACCI strategy based on detection of an impulsive move in the opposite direction. This is called a Breakout. At the moment of Breakout, the indicator draw
Hyperbolic
Konstantin Gruzdev
The indicator is stable on noise fluctuations in price and quickly reacts to the trend. It is based on an algorithm from a system of hyperbolic functions that allows you to aggressively smooth the flat with minimal lag on the trend. It can be applied directly to the price chart, to itself, or to other indicators in order to eliminate false signals. The main purpose of the indicator is to smooth out small sawtooth price movements as much as possible. The higher the Hyperbolic parameter, the stron
Prices move for many reasons and these can vary from one operator to another: software, private and institutional traders simultaneously contribute to the formation of the price, making predictive art very difficult. However, there are measurable factors that bind the price to an underlying trend in line with the physical reality that the financial asset represents: these are the macroeconomic indicators. Large investors use this information wisely to set their strategies. Understanding these m
Matreshka
Dimitr Trifonov
5 (2)
Matreshka self-testing and self-optimizing indicator: 1. Is an interpretation of the Elliott Wave Analysis Theory. 2. Based on the principle of the indicator type ZigZag, and the waves are based on the principle of interpretation of the theory of DeMark. 3. Filters waves in length and height. 4. Draws up to six levels of ZigZag at the same time, tracking waves of different orders. 5. Marks Pulsed and Recoil Waves. 6. Draws arrows to open positions 7. Draws three channels. 8. Notes support and re
Stop calculating lot sizes manually. Stop guessing your Risk/Reward ratio. The Risk Reward Tool brings the intuitive, visual trading style of TradingView directly to your MetaTrader 5 charts. It is designed for traders who value speed, precision, and visual clarity. Whether you trade Forex, Indices (DAX, US30), or Commodities (Gold, Oil), this tool handles the math for you. Simply click "Long" or "Short," drag the lines to your levels, and the tool instantly tells you exactly how many lots to t
TrendMaestro5
Stefano Frisetti
Attenzione alle truffe, questo indicatore e' distribuito esclusivamente su MQL5.com nota: questo indicatore e' per METATRADER5, se vuoi la versione per  METATRADER4 questo e' il link:   https://www.mql5.com/it/market/product/108106 TRENDMAESTRO ver 2.5 TRENDMAESTRO   riconosce un nuovo TREND sul nascere, non sbaglia mai. La sicurezza di identificare un nuovo TREND non ha prezzo. DESCRIZIONE TRENDMAESTRO identifica un nuovo TREND sul nascere, questo indicatore prende in esame la volatilita' i
Step into the world of Forex trading with confidence, clarity, and precision using Gold Indicator a next-generation tool engineered to take your trading performance to the next level. Whether you’re a seasoned professional or just beginning your journey in the currency markets, Gold Indicator equips you with powerful insights and help you trade smarter, not harder. Built on the proven synergy of three advanced indicators, Gold Indicator focuses exclusively on medium and long-term trends elimina
Ottieni l’indicatore AUX GRATUITO e il supporto EA Download diretto — Clicca qui [ D.I.C.E ] The DICE Indicator  Divergence in Chaos Environment è uno strumento MT5 specializzato per trader che applicano la Teoria delle Onde di Elliott nel contesto delle tecniche di Trading Chaos. Identifica divergenze nascoste e regolari nell’azione dei prezzi, sincronizzate con l’ambiente di mercato caotico descritto da Bill Williams. Caratteristiche principali Divergenza allineata alle Onde di Elliott: rilev
Orderflow Scalp Pro v2.4   delivers institutional-grade trading intelligence through advanced volume analysis, dynamic VWAP calculations, real-time aggressive score monitoring, and precision arrow signals. This complete trading system transforms complex market data into clear, actionable signals for consistent profitability on 3-4 minute timeframes. Full Documentation: [Download PDF] Four Powerful Components in One System Volume Profile HeatMap with POC/VAH/VAL Transform your charts into inst
MonsterDash Harmonics Indicator is a harmonic pattern dashboard. It recognizes all major patterns. MonsterDash is a dashboard that displays all detected patterns for all symbols and (almost) all timeframes in sortable and scrollable format. Users can add their own user defined patterns . MonsterDash can open and update charts with the pattern found. Settings MonsterDash's default settings are good enough most of the time. Feel free to fine tune them to your needs. The color settings are for tho
The Volume Spread Analysis indicator is based on the original Volume Spread Analysis method. It was designed for quick and easy recognition of VSA patterns. Even though this indicator looks very simple, it is the most sophisticated tool we've ever made. It is a really powerful analytical tool that generates very reliable trading signals. Because it is very user-friendly and understandable, it is suitable for every type of trader, regardless of his experience. What is VSA? VSA - Volume Spread A
This indicator belongs to the family of channel indicators. These channel indicator was created based on the principle that the market will always trade in a swinging like pattern. The swinging like pattern is caused by the existence of both the bulls and bears in a market. This causes a market to trade in a dynamic channel. it is designed to help the buyer to identify the levels at which the bulls are buying and the bear are selling. The bulls are buying when the Market is cheap and the bears a
Ottieni l’indicatore AUX GRATUITO, il supporto EA e la guida completa, visita per favore – https://www.mql5.com/en/blogs/post/763955 Individua la tendenza. Leggi il pattern. Cronometra l'ingresso. 3 passaggi in meno di 30 secondi! Opera senza sforzo — nessuna analisi richiesta, il tuo assistente intelligente è pronto a semplificare il tuo flusso di lavoro Basta sovraccarico di grafici. Opera con fiducia utilizzando il rilevamento intelligente del bias. Compatibile con tutte le valute, criptova
First time on MetaTrader, introducing IQ Star Lines - an original Vedic Astrology based indicator. "Millionaires don't use astrology, billionaires do" . - J.P. Morgan, Legendary American financier and banker. IQ Star Lines, an unique astrological indicator purely based on   Vedic astrology   calculations, published for the   first time on Metatrader.  This unique tool plots dynamic planetary grid lines based on real-time stars, constellations, and celestial movements, which allows you to plot t
Presenting one-of-a-kind Gann Indicator for XAUUSD IQ Gold Gann Levels is a non-repainting, precision tool designed exclusively for XAUUSD/Gold intraday trading. It uses W.D. Gann’s square root method to plot real-time support and resistance levels, helping traders spot high-probability entries with confidence and clarity. William Delbert Gann (W.D. Gann) was an exceptional market analyst whose trading technique was based on a complex blend of mathematics, geometry, astrology, and ancient calcul
Elliot Waves Analyzer Pro
Viktor Weidenthal
2.67 (3)
Elliot Waves Analyzer Pro calculates Elliot Waves to Help Identify Trend direction and Entry Levels. Mainly for Swing Trading Strategies. Usually one would open a Position in trend direction for Wave 3 or a Correction for Wave C . This Indicator draws Target Levels for the current and next wave. Most important Rules for Elliot Wave Analysis are verified by the Indicator.  The Pro version analyzes Multiple Timeframes and shows the Subwaves and Target-Levels.   For an Overview  " Elliot Waves Anal
This indicator uses support and resistance, volume and some special formula to calculate the volume to filter the candles. If the volume reaches a specific value, And at the same time, Candle breaks the support/resistance line, There would be a signal and we can enter the market. Signals appear when the current candle closes. then you can enter the trade when a new candle appears. Please don't forget to follow your money management plan. MT4 Version Support/Resistance Breakout MT4 :   https:/
Altri dall’autore
L'indicatore per Forex e Opzioni Binarie è scritto sulla base di 2 indicatori standard in MT4: ADX e RVI. I segnali arrivano alle intersezioni simultanee delle linee di entrambi gli indicatori. Ma anche l'inversione dei segnali è scritta nei codici. Questo è quando i segnali vengono convertiti all'indietro. È inoltre possibile attivare e disattivare ciascuno degli indicatori. E anche in RVI, puoi usare 2 tipi di segnali: 1) solo quando una linea è sopra/sotto l'altra (questo è buono da usare c
Super volumes
Yerzhan Satov
4 (1)
L'indicatore a quadrante per Forex e Opzioni Binarie è stato creato sulla base dei volumi di tick. A differenza di molti indicatori di volume, l'indicatore "Super volumes" calcola i volumi rialzisti e ribassisti e fornisce segnali sulla predominanza di uno di essi. Se diciamo che al momento in questo intervallo c'era un vantaggio dei volumi rialzisti, allora il segnale sarà su Buy. O se la prevalenza era di volumi ribassisti, quindi, di conseguenza, il segnale sarà su Sell. Nelle impostazioni
L'Indicatore a quadrante "Anaconda LD" è un indicatore di inversione per il mercato Forex e principalmente per le Opzioni Binarie. L'algoritmo è scritto sulla base di modelli di inversione. È meglio usarlo insieme ad altri indicatori per filtrare i segnali. Anche con quelli standard in MT4, anche altri personalizzati. Particolarmente adatti sono gli indicatori di canale o di livello... Per diversi beni è necessario selezionare il tempo di scadenza. Che su coppie diverse compongono 1-5 barre.
Cripton
Yerzhan Satov
L'indicatore a quadrante per opzioni binarie e Forex è un indicatore di inversione. Creato e scritto sulla base di modelli di inversione. Si consiglia per le opzioni binarie di metterlo sul grafico M5. Entra nelle offerte per 1-3 bar. Su una risorsa diversa, a seconda delle sessioni di trading, è necessario selezionare il tempo di scadenza.  È possibile modificare le impostazioni nelle variabili esterne. Pertanto, è possibile aumentare e diminuire la frequenza dei segnali. Le frecce dell'indic
L'indicatore a quadrante "crea un segnale freddo" per il mercato delle opzioni binarie e Forex è una sorta di costruttore dei suoi segnali! In cui tu stesso Puoi scegliere le tue condizioni di segnale in base a 10 indicatori standard in MT4 e oltre a un altro indicatore buffer di terze parti, che puoi aggiungere alla variabile "buffer indicators". È fatto semplicemente! Prescrivi il nome del tuo indicatore e prescrivi i suoi numeri (li troverai nella sezione dei colori in cui sono indicati i n
L'indicatore per le opzioni binarie e Forex "Highway profits" si basa sul principio di trovare il prezzo dietro le linee del canale. Dopo che il prezzo supera il canale e inizia gradualmente a tornare ad esso, è allora che appariranno i segnali. Il trading di un tale indicatore è molto facile e conveniente. E possono essere scambiati anche da un trader alle prime armi o da un trader con molti anni di esperienza. Per ogni risorsa è necessario selezionare le proprie impostazioni. Ad esempio, il
L'indicatore a quadrante "cool volumes" è stato creato sulla base dei volumi in teak su MT4. L'indicatore stesso tiene traccia in un determinato periodo di tempo (selezione del periodo di tempo) del numero di volumi per l'acquisto o la vendita. E quando c'è un eccesso anomalo dei volumi di venditori o acquirenti, emette un segnale per vendere o acquistare. Nella finestra in basso vengono disegnati grafici a barre colorati, in cui il colore verde mostra la predominanza degli acquirenti al mome
L'indicatore di segnale Space signals è il mio nuovo sviluppo per il trading nei mercati FOREX e delle opzioni binarie. L'algoritmo dell'indicatore è registrato in modo che rintracci la tendenza e segnali alla fine del movimento correttivo dei Prezzi. Nelle impostazioni, puoi impostare tu stesso il periodo dei segnali. Maggiore è il valore nella variabile "periodo", più rari saranno i segnali. Ma saranno naturalmente di qualità superiore.  Puoi anche selezionare i codici delle frecce sul graf
L'indicatore per il trading sul mercato Forex e le Opzioni Binarie è scritto sulla base dell'indicatore standard MT4 della media mobile semplice. Ma la differenza dall'indicatore standard è che le sue linee sono ridipinte in colori diversi a seconda dello Stato della tendenza. Se il colore è verde, la tendenza per l'acquisto. Se rosso, poi in vendita. Durante il cambiamento di fase di tendenza, viene visualizzato un avviso sonoro insieme a un buffer sul grafico al centro delle linee. Pertanto, è
The new Dynamic PACK Hi Tf indicator is based on tick volumes. The middle line shows the average price for the selected period of the selected senior timeframe. The upper and lower lines show the maximum/minimum of the same selected period of the same timeframe. In the settings, the user can optionally choose which timeframe and bar calculation period he needs. You can also change the style, thickness, and color of each of the lines.  In the "StsrtBars" parameter, you can select the start peri
The Level DELTA indicator for MetaTrader 4 (MT4) – a powerful volume analysis tool that stands out with its capabilities and accuracy. Indicator Description The Level DELTA indicator is designed for volume analysis in a separate MT4 window. Its main task is to identify and display divergences, allowing traders to make more informed and timely decisions. Indicator Features Volume Analysis : The indicator analyzes volumes in financial markets, allowing you to see how volumes are distributed over d
The "Volume POC WVAP" Indicator is a revolutionary tool for traders seeking in-depth analysis across various financial markets. This unique indicator, based on tick volumes in the MT4 terminal, provides indispensable information for making informed trading decisions in the following markets: Forex, binary options, cryptocurrency, spot, futures, and indices. Key Features: WVAP Line: Weighted Volume Average Price: The WVAP calculates the weighted volume average price on the selected timeframe, all
POC, Volume Profile, Market Profile, Volume Indicator, Dynamic POC, Tick Volume, Forex Volume The Dynamic POC Hi Tf Arrow indicator is a reliable volume analysis tool (volume profile, market profile, tick volume) for accurately determining POC levels and price reactions. Dynamic POC Hi Tf arrow for MT4 Description Dynamic POC Hi Tf arrow is a professional volume analysis indicator designed to accurately identify key price levels and market direction. It is built on tick volume data and displ
Quantum Empire GRID PRO - Next Generation Trading System Revolutionary Trading Technology Quantum Empire GRID PRO represents a breakthrough in automated trading, combining intelligent grid strategy with averaging system and signal filtering. After 2+ years of real-market testing, this EA has proven its stability and profitability across various asset classes. Key Features: Smart Averaging System : When closing a series of trades, profit averages 3:1 relative to losses 4 Signal Mode
The Quantum   DELTA indicator for MetaTrader 5 (MT5) – a powerful volume analysis tool that stands out with its capabilities and accuracy. Indicator Description The Quantum   DELTA indicator is designed for volume analysis in a separate MT5 window. Its main task is to identify and display divergences, allowing traders to make more informed and timely decisions. Indicator Features Volume Analysis : The indicator analyzes volumes in financial markets, allowing you to see how volumes are distribute
Title: MACD Signals Discover the MACD Signals indicator – your reliable assistant in the world of trading! Description: The "MACD Signals" indicator is designed to make your trading more successful and efficient. It displays signals on the main chart as bright vertical lines that are easy to spot. You can customize the color and thickness of these lines to perfectly match your style and preferences. Features: Signals: Vertical lines on the main chart that stand out among other elements.
Filtro:
Nessuna recensione
Rispondi alla recensione