Cool volumes

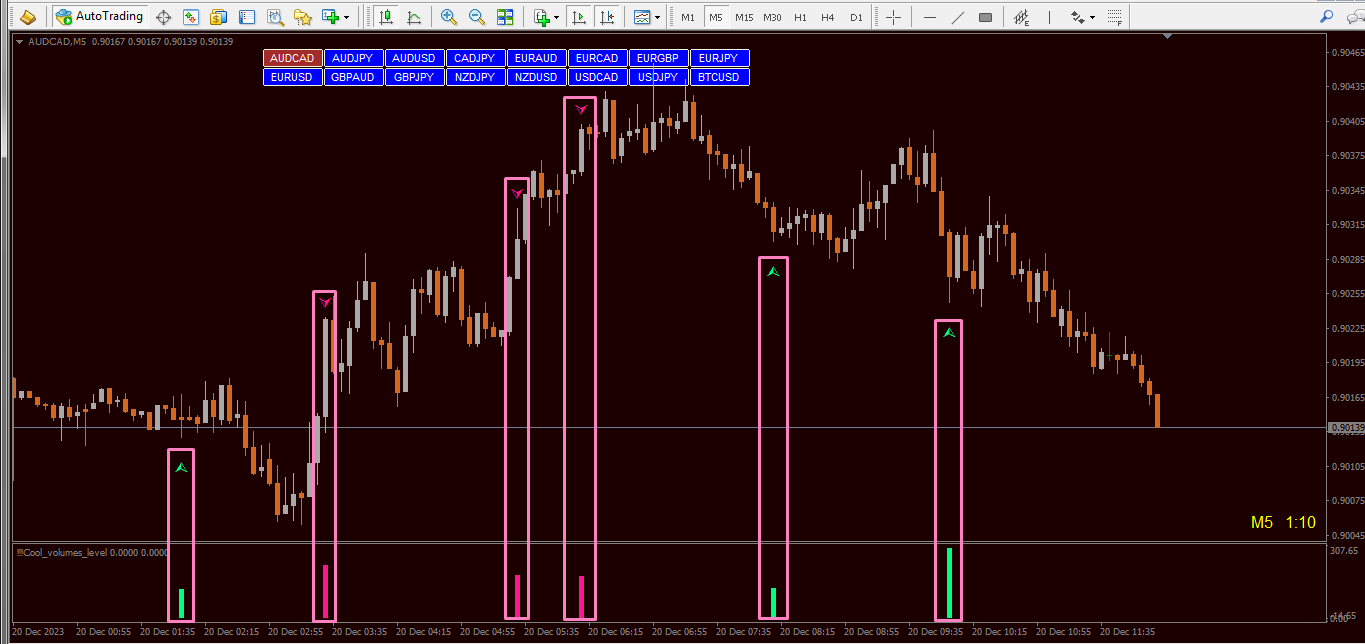
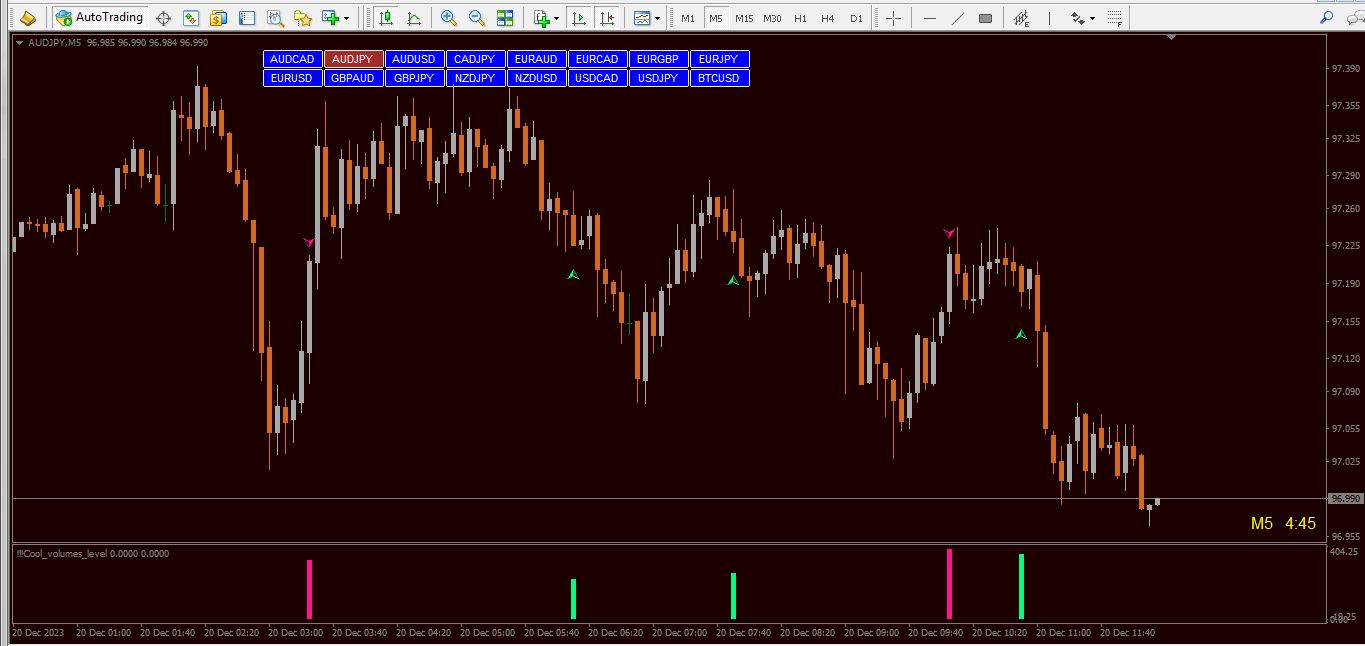
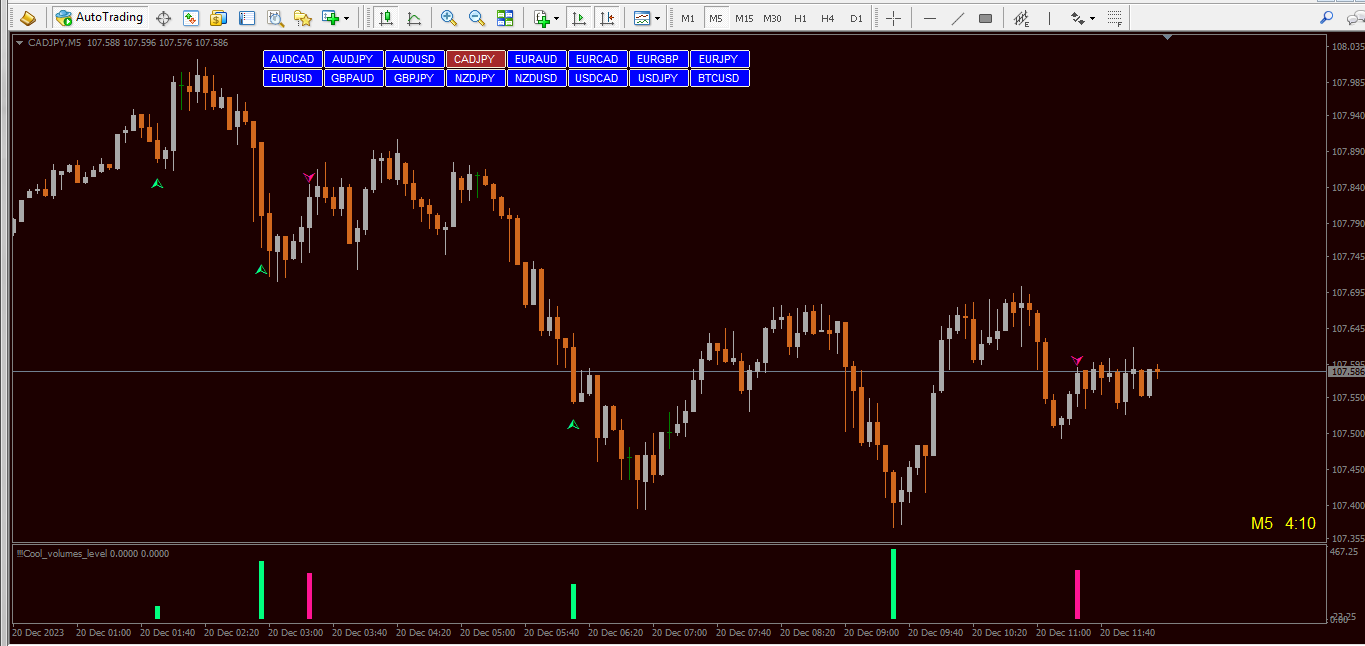
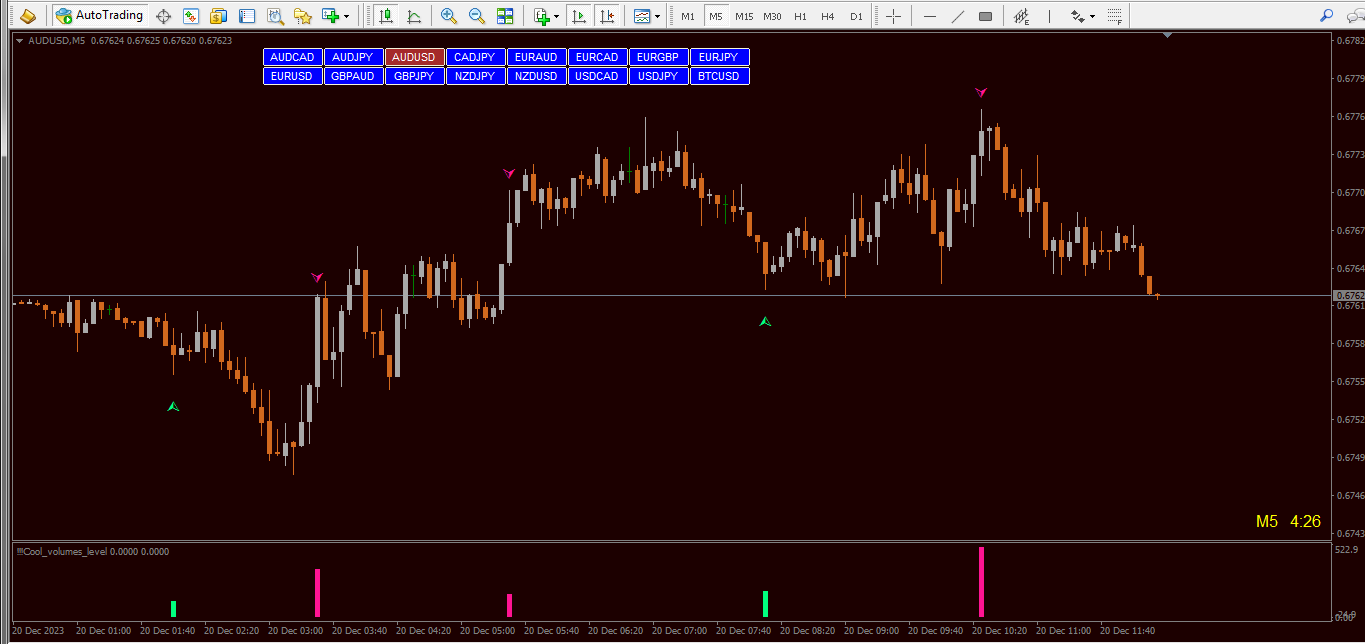
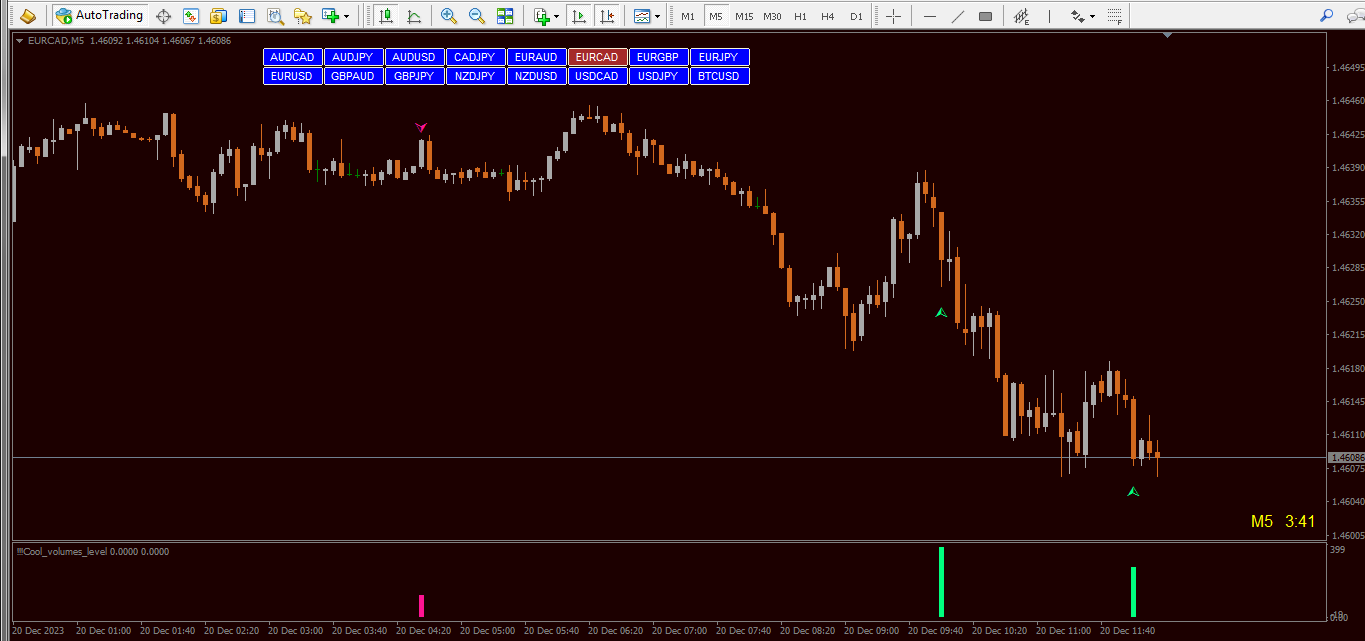
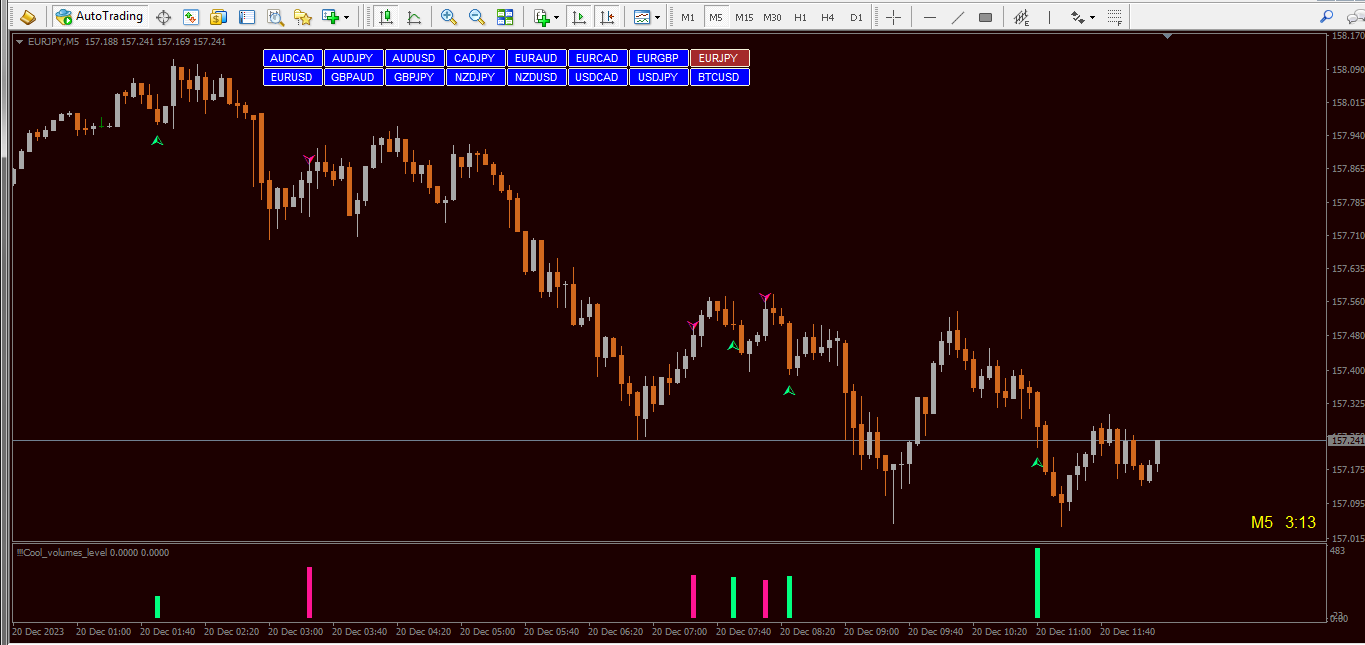
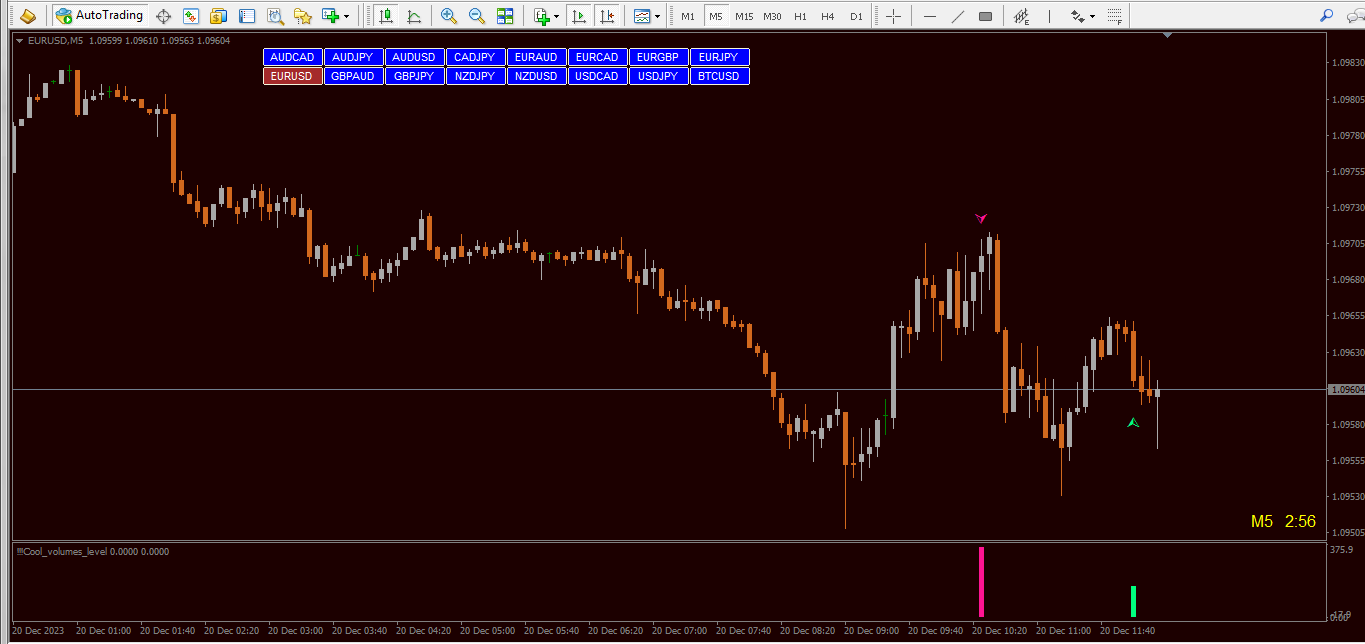
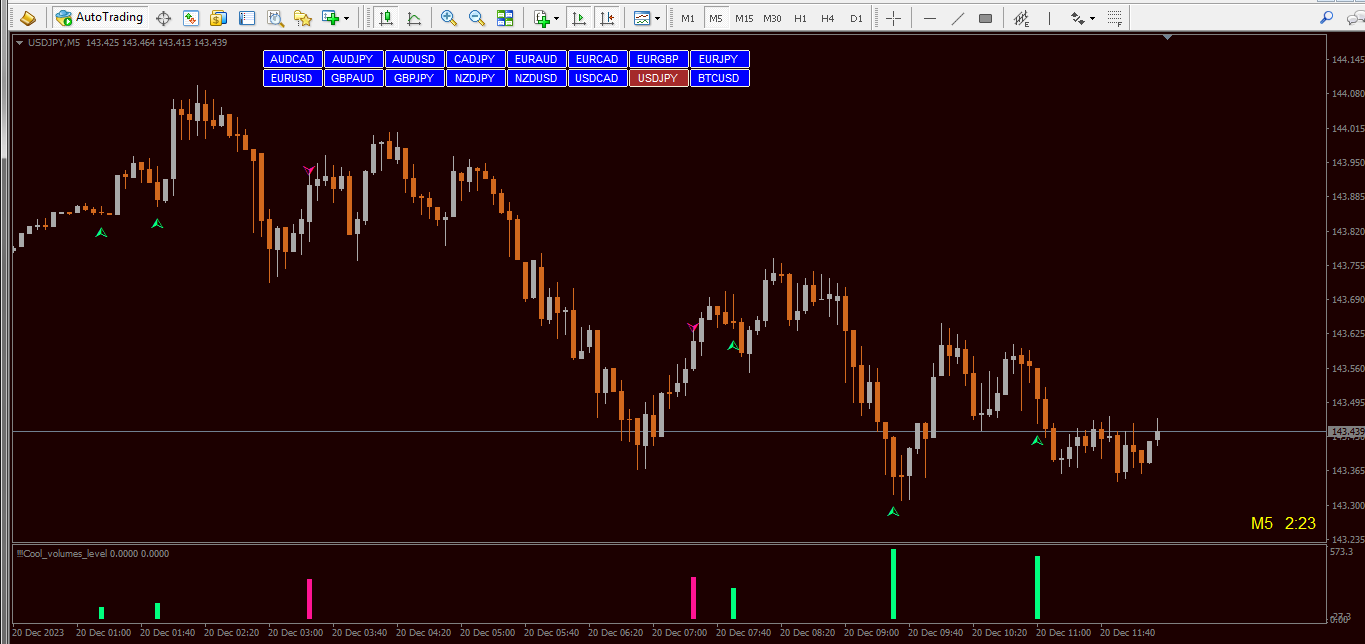
화살표 표시기"쿨 볼륨"은 틱 볼륨을 기반으로합니다.

표시기 자체는 특정 기간(기간 선택)에 구매 또는 판매 할 볼륨 수를 추적합니다. 판매자 또는 구매자의 볼륨의 비정상적인 초과가있을 때,그것은 판매 또는 구매 신호를 제공합니다.

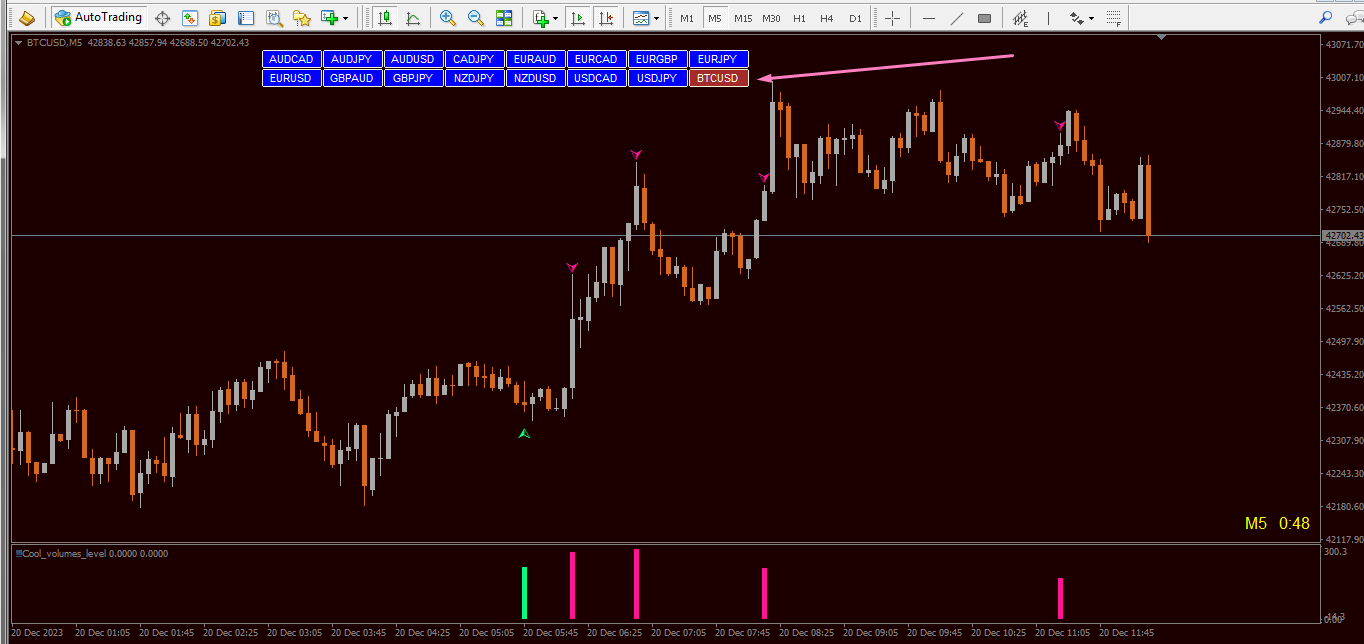
색상 히스토그램은 아래 창에 그려져 있는데,녹색은 현재 구매자의 우위를 나타냅니다.이는 이 가격 범위에서 증가할 수 있는 잠재적 즉각적인 반전을 의미합니다. 반대로 붉은 색은 판매자의 우위를 나타내며 이는 잠재적 인 즉각적인 하향 반전을 의미합니다.

또한 시각적 인식의 편의를 위해 주 차트 창에 화살표가 직접 추가되었습니다.

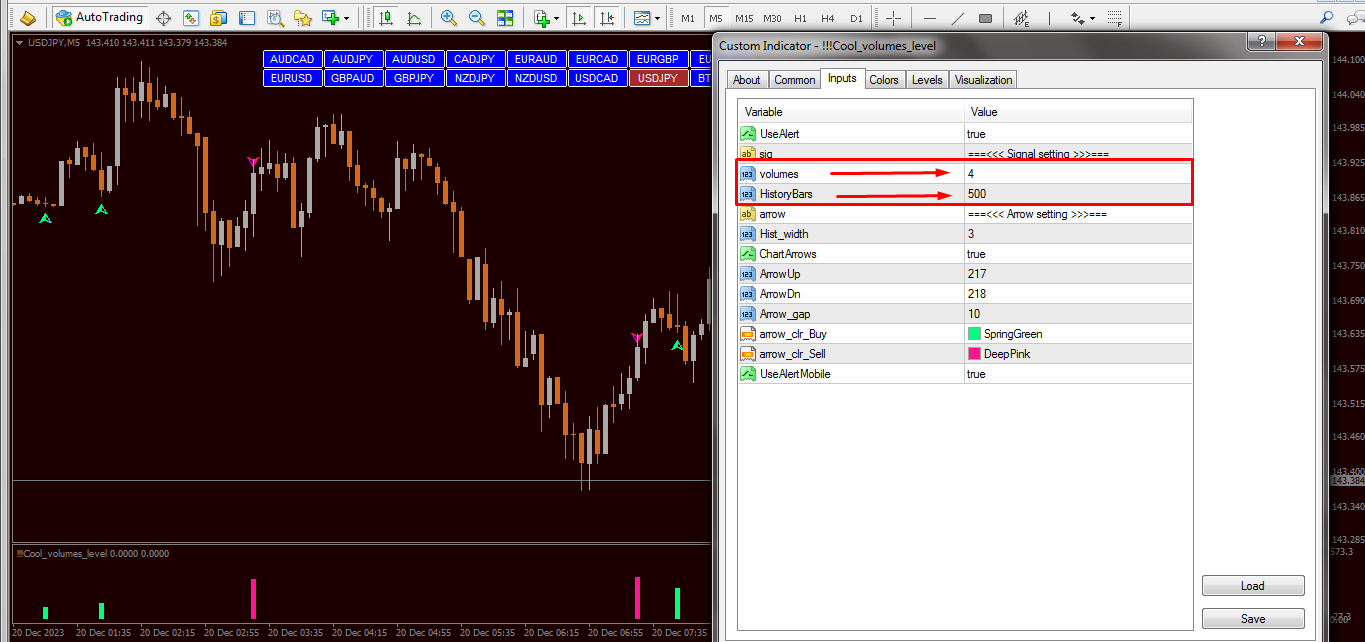
사용자의 편의를 위해 외부 변수에는 신호의 주파수와 히스토리(히스토리 바)에 대한 설정 변수가 포함되어 있습니다. 그러나 값을 1000 이상으로 설정하지 않는 것이 좋습니다. 이 더 터미널의 성능이 느려집니다.

또한"===<<화살표 설정>>>==="섹션에서 화살표 및 히스토그램 매개 변수를 직접 설정할 수 있습니다. 히스토그램의 두께,촛불에서 화살표의 거리,화살표 코드 및 색상. 또는 메인 차트 창의 화살표를 완전히 비활성화 할 수 있습니다.

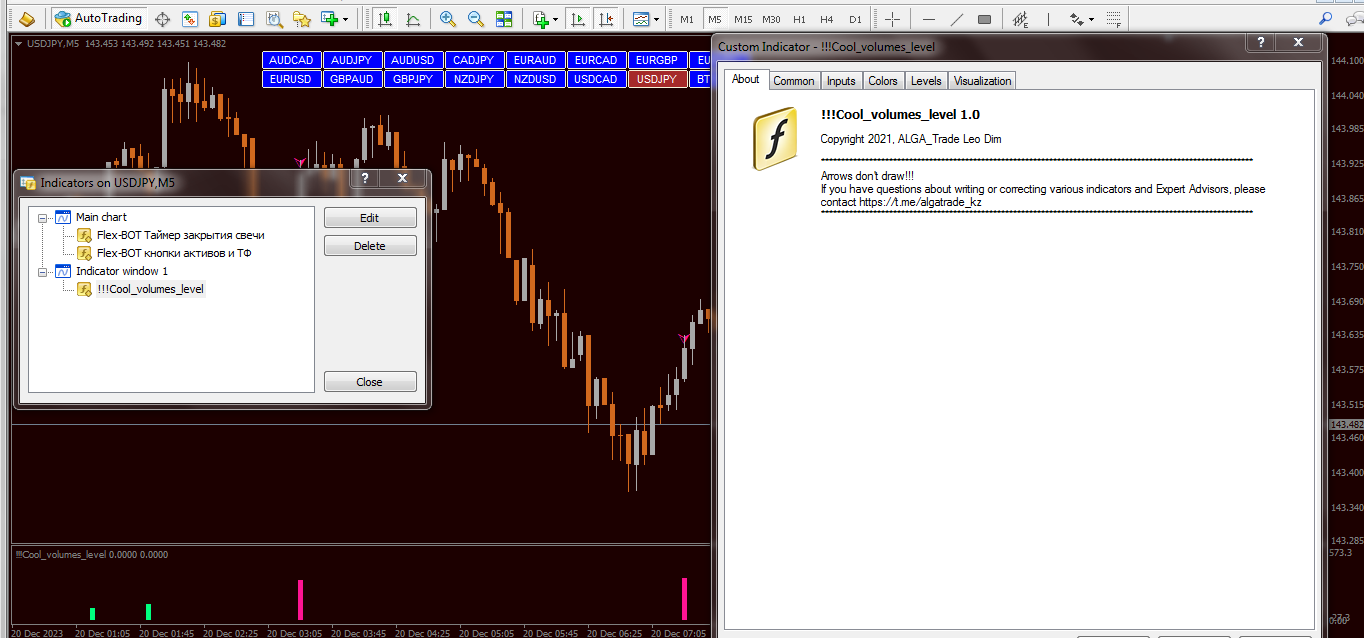
화살표와 신호는 전혀 그리지 않습니다. 시간대를 변경하고 터미널을 업데이트 한 후에도. 그러나 히스토그램 및 화살표를 고정 한 후 트랜잭션을 입력 할 필요가있다!
모두에게 행운을 빕니다!!!
추천 제품
UGenesys Volume MT4
Odaine Ramon Mcmillan
50% Off Today Only! Price Goes Back Up at 11 PM (EST) uGenesys Volume Indicator: Your Key to Mastering Market Volume Analysis What Traders Are Saying: "A must-have indicator...really a game-changer." – wuzzy66 "Amazing indicator...strongly recommend to beginners." – joinbehar Understanding Market Volume: Volume in the market is a critical indicator of movement and opportunity. The uGenesys Volume Indicator is specially crafted to pinpoint when the market has the most volume, allowing you to tr
Smart Moving Average MT4
Mostafa Saad Saeed Shawara
제품 제목 Smart Moving Averages (MT4) – SmartView 시리즈의 일부 간단한 설명 MetaTrader 플랫폼에서 독특한 사용자 경험을 제공하는 Moving Averages 지표입니다. 이전에 사용할 수 없었던 고급 기능을 제공하며, 더블 클릭으로 설정 열기, 삭제하지 않고 지표 숨기기/표시하기, 지표 창을 전체 차트 크기로 표시하기 등의 기능을 포함합니다. SmartView Indicators 시리즈의 나머지 부분과 원활하게 작동하도록 설계되었습니다. 개요 SmartView 시리즈는 혁신적인 기능을 통해 MetaTrader 플랫폼의 지표에 독특하고 독특한 사용자 경험을 제공하여 지표 관리를 더 빠르고 쉽게 만듭니다. 각 지표는 차트에 스마트 제어 패널이 장착되어 있어 필수 정보를 표시하고 모든 중요한 기능에 빠르게 액세스할 수 있습니다. 이전에 사용할 수 없었던 고유한 기능 SmartView 시리즈는 지표 작업을 더 쉽고 빠르게 만드는 고급 기능을 제공합니
FREE
Graphic shapes
Alexandr Lapin
5 (1)
Graphic Shapes -using history, it projects four types of graphical shapes at the moment, allowing you to determine the main ranges of price movement in the future, as well as gives an understanding of the main market reversals, while giving entry points by priority!The panel contains three types of figure sizes expressed by timeframes. They allow you to conduct a complete market analysis without using additional tools! The indicator is a powerful tool for forecasting price movements in the forex
FREE
Fibo Linear Channel
Igor Semyonov
4 (1)
Colored indicator of the linear channel based on the Fibonacci sequence. It is used for making trading decisions and analyzing market sentiment. The channel boundaries represent strong support/resistance levels, as they are the Fibonacci proportion levels. Users can select the number of displayed lines of channel boundaries on the chart by means of the input parameters. Attaching multiple instances of the indicator to the chart with different calculation periods leads to displaying a system of c
MT4용 Crypto_Forex 지표 "추세 진입 히스토그램", 리페인트 없음. - 추세 진입 히스토그램 지표는 Entry_bar가 나타나면 추세 방향 진입 신호를 찾는 데 사용할 수 있습니다. - 이 지표는 가격과 거래량을 모두 고려하여 계산하는 고유한 특징을 가지고 있습니다. - 추세 진입 히스토그램은 두 가지 색상으로 제공됩니다. 빨간색은 약세 추세, 파란색은 강세 추세입니다. - 안정적인 추세(동일한 색상의 히스토그램 막대가 최소 10개 연속 표시)가 나타나면 Entry_bar가 표시될 때까지 기다리세요. - 진입 신호는 히스토그램에서 반대 색상의 열 하나와 초기 추세 색상의 다음 열입니다(그림 참조). - 숏 목표가를 사용하세요. 현재 추세에 따라 차트에서 가장 가까운 고가/저가를 사용하세요. - 지표에는 모바일 및 PC 알림 기능이 내장되어 있습니다. 사용 방법: - 매수 신호: 안정적인 강세 추세(파란색 히스토그램 막대) + 히스토그램의 빨간색 막대 1개 + 파란색
Description A colored universal multicurrency/multi-symbol indicator  MACD Classic Smart that consists of two indicators: MACD Line Smart and MACD Histo Smart. Both indicators are based on double or triple moving average . Comparing to the standard MACD Classic this indicator is more sensitive to what allows generating advance signals. he indicator may be used with any broker, irrespective of the name of the financial instrument since it is necessary to manually enter the name as an input parame
I Permanent
Vladimir Gorbachev
Universal adaptable indicator. It determines the estimated trading range for the current day based on the available history a real data, and displays the area of the probable price rollback on the chart. All this thanks to the built-in algorithm that automatically adapts to any behavior models of the market quotes. With the parameters adjusted, the indicator shows its effectiveness on most of the currency pairs, that have a rollback from the reached extremums during the current or the next tradi
Quatre
Maryna Shulzhenko
Quatre is a trend indicator, it indicates well the points of the beginning of the trend and its completion or reversal. This indicator is characterized by the following behavior: After a trend movement appears on the market, the indicator sends a signal of its beginning in the form of arrows. Quatre is a mathematical averaging of prices, and based on this, one can assume the direction of price movement (trend) in the future. Against the background of insignificant fluctuations, it is possible t
ChopEx
Joshua Iyanuoluw Adedeji
The Chop Exploder indicator is a custom indicator that has a long run, tight chop, short chop, and band colour. This indicator has MT4 alert notification,mobile notification, and email notification. The default indexing of all arrays and indicator buffers is left to right. The index of the first element is always equal to zero. Thus, the very first element of an array or indicator buffer with index 0 is by default on the extreme left position, while the last element is on the extreme right posit
Volume Compair
Thiago Pereira Pinho
Professional Cumulative Delta & Volume Median Indicator Track   real buying/selling pressure   with this powerful volume analysis tool. The   Volume Compare Indicator   combines   Cumulative Delta   and   Volume Medians   to help you identify institutional activity, imbalances, and potential reversals. Key Features: Cumulative Delta Histogram   – Visualizes net buying vs. selling volume in real-time. Buy/Sell Volume Medians   – Horizontal lines showing average buy & sell volume levels. Smart Vo
MT4용 Crypto_Forex 지표 "망치와 행잉 맨 패턴", 리페인트 없음, 지연 없음. - "망치와 행잉 맨" 지표는 가격 변동 거래에 매우 강력한 지표입니다. - 이 지표는 차트에서 강세 망치 패턴과 약세 행잉 맨 패턴을 감지합니다. - 강세 패턴 망치 - 차트에 파란색 화살표 신호(그림 참조). - 약세 패턴 행잉 맨 - 차트에 빨간색 화살표 신호(그림 참조). - PC, 모바일 및 이메일 알림 기능 제공. - "망치와 행잉 맨" 지표는 지지/저항선과 함께 사용하기에 매우 좋습니다. // 훌륭한 트레이딩 로봇과 지표는 다음 링크에서 확인하실 수 있습니다: https://www.mql5.com/en/users/def1380/seller 이 제품은 MQL5 웹사이트에서만 제공되는 오리지널 상품입니다.
Rira Renko
Vitor Palmeira Abbehusen
RENKO on Time Chart This indicator is an enhanced Renko, so you can watch the Renko bricks on the chart to understand price movement more clearly the other improvement is automated box size according to ATR (Average True Range) period you can set the ATR number as you want and the box size of Renko changes automatically based on price movement Inputs Mode: Box size is the input to specify the size of the Renko box you want to print on the chart. This input lets you choose the fixed box siz
QQE Mod MT4
Filip Valkovic
The   Quantitative Qualitative Estimation   (QQE) indicator is derived from Wilder’s famous Relative Strength Index (RSI). In essence, the QQE is a heavily smoothed RSI. Modification of this version: (   converted from tradingview   script by Mihkell00, original from Glaz, 100% identical output) So there are Two QQEs. One that is shown on the chart as columns, and the other "hidden" in the background which also has a 50 MA   bollinger band   acting as a zero line. When both of them agree - y
Alpha Trend sign has been a very popular trading tool in our company for a long time. It can verify our trading system and clearly indicate trading signals, and the signals will not drift. Main functions: Based on the market display of active areas, indicators can be used to intuitively determine whether the current market trend belongs to a trend market or a volatile market. And enter the market according to the indicator arrows, with green arrows indicating buy and red arrows indicating se
Vortex with Alarm
Fabio Pacchioni
The Vortex Indicator was inspired by the work of an Austrian inventor, Viktor Schauberger, who studied the flow of water in rivers and turbines. Etienne Botes and Douglas Siepman developed the idea that movements and flows within financial markets are similar to the vortex motions found in water. The Vortex Indicator was also partly inspired by J. Welles Wilder's concept of directional movement, which assumes the relationship between price bars gives clues as to the direction of a market. This i
Dynamic Forex28 Navigator
Bernhard Schweigert
4.43 (7)
Dynamic Forex28 Navigator - 차세대 외환 거래 도구. 현재 49% 할인. Dynamic Forex28 Navigator는 오랫동안 인기 있는 지표의 진화형으로, 세 가지의 힘을 하나로 결합했습니다. 고급 통화 Strength28 지표(695개 리뷰) + 고급 통화 IMPULSE with ALERT(520개 리뷰) + CS28 콤보 신호(보너스). 지표에 대한 자세한 정보 https://www.mql5.com/en/blogs/post/758844 차세대 Strength 지표는 무엇을 제공합니까?  원래 지표에서 좋아했던 모든 것이 새로운 기능과 더 높은 정확도로 강화되었습니다. 주요 기능: 독점적인 통화 Strength 공식.  모든 시간대에 걸쳐 부드럽고 정확한 강도선. 추세와 정확한 진입을 식별하는 데 이상적입니다. 역동적인 시장 피보나치 수준(시장 피보나치).  이 지표에만 있는 고유한 기능. 가격 차트가 아닌 통화 강도에 피보나치가 적용됩니다.
Description A colored multicurrency/multisymbol oscillator of the market mood. The oscillator is designed for detecting the continuation or change of the market mood prior to its occurrence. An excellent example is the screenshots that show all the features of the oscillator. The oscillator may be used with any broker, irrespective of the name of the financial instrument since it is necessary to manually enter the name as an input parameter. If you enter a non-existent or incorrect name of a fin
API BullBearPower mtf Designed for traders who rely on BullBearPower, this tool provides a multi-timeframe (MTF) view of BullBearPower, helping you identify possible dominant trends. Key Features: Multi-Timeframe Analysis – Analyze BullBearPower across different timeframes in real time. Dynamic Color Changes – Identify possible BullBearPower per individual timeframe with color changes. Volume Integration – Get a picture of possible trend strength with BullBearPower volume of each timefra
Profit MACD
Aleksey Ivanov
5 (2)
I present an indicator for professionals. ProfitMACD is very similar to classic MACD in appearance and its functions . However, ProfitMACD is based on completely new algorithms (for example, it has only one averaging period) and is more robust, especially on small timeframes, since it filters random price walks. The classic MACD indicator (Moving Average Convergence / Divergence) is a very good indicator following the trend, based on the ratio between two moving averages, namely the EM
Introduction It is common practice for professional trades to hide their stop loss / take profit from their brokers. Either from keeping their strategy to the themselves or from the fear that their broker works against them. Using this indicator, the stop loss / take profit points will be drawn on the product chart using the bid price. So, you can see exactly when the price is hit and close it manually.  Usage Once attached to the chart, the indicator scans the open orders to attach lines for t
VR Cub
Vladimir Pastushak
VR Cub 은 고품질 진입점을 얻는 지표입니다. 이 지표는 수학적 계산을 용이하게 하고 포지션 진입점 검색을 단순화하기 위해 개발되었습니다. 지표가 작성된 거래 전략은 수년 동안 그 효율성을 입증해 왔습니다. 거래 전략의 단순성은 초보 거래자라도 성공적으로 거래할 수 있다는 큰 장점입니다. VR Cub은 포지션 개시 지점과 이익 실현 및 손절매 목표 수준을 계산하여 효율성과 사용 편의성을 크게 높입니다. 간단한 거래 규칙을 이해하려면 아래 전략을 사용한 거래 스크린샷을 살펴보세요. 설정, 세트 파일, 데모 버전, 지침, 문제 해결 등은 다음에서 얻을 수 있습니다. [블로그] 다음에서 리뷰를 읽거나 작성할 수 있습니다. [링크] 버전 [MetaTrader 5] 진입점 계산 규칙 포지션 개설 진입점을 계산하려면 VR Cub 도구를 마지막 최고점에서 마지막 최저점까지 늘려야 합니다. 첫 번째 지점이 두 번째 지점보다 빠른 경우, 거래자는 막대가 중간선 위에서 마감될 때까지 기다립니다
MetaCOT 2 is a set of indicators and specialized utilities for the analysis of the U.S. Commodity Futures Trading Commission reports. Thanks to the reports issued by the Commission, it is possible to analyze the size and direction of the positions of the major market participants, which brings the long-term price prediction accuracy to a new higher-quality level, inaccessible to most traders. The indicator of absolute positions shows the dynamics of the open positions or the number of traders in
DTM Hypertrend
Gabor Bocsak
5 (1)
구매 후 메시지나 리뷰를 남겨주시면 보너스 EA Trade Assistant를 보내드리겠습니다! Hypertrend는 추세의 강도에 따라 양초에 색상을 지정하는 매우 강력한 시각적 지표입니다. 다시 칠하지 마세요! 모든 쌍과 기간에 작동합니다! 스크린샷(GIF)을 확인해보세요! 특별한 필터와 오실레이터를 사용하여 추세를 찾아주기 때문에 차트를 보는 것 외에는 아무것도 할 필요가 없습니다! 설정: 색상을 원하는 대로 변경하고 알림을 선택하세요. 거래 보조 EA 패널에서 기본 설정을 설정하세요(수정 로트 또는 균형 위험? 금액과 위험 보상 비율을 설정하세요!) 전략 : 표시기를 사용하여 입력 내용을 확인하세요! 양초가 강세 색상으로 변하면 진입 매수 / 이전 중립 구간보다 약간 아래에 손절매 설정 / tp에서 거래를 종료하거나 양초가 다시 중립 또는 반대 색상으로 변하면 진입하세요! 양초가 약세 색상으로 변하면 진입 매도 / 이전 중립 구간보다 약간 높은 곳에 손절매 설정 /
Summary This indicator is based on RSI and Momentum indicators. It also considers moving averages of these two indicators. The three indicators have adjustable settings. The arrows do not repaint since the indicator only uses confirmed values and waits for the candle to close before painting an arrow. The indicator is also able to alert when arrows appear. There are 3 types of alerts - Popup, Email and Mobile Push Notifications. The arrows can be used in the EA and the inputs can also be optimiz
FREE
Current Strength
Nacer Kessir
5 (1)
The indicator (Current Strength) is represented in a separate window by Blue and Pink histogram . The parameter NPeriod represents the number of bars on which we calculate the variation of  forces, the recommended value is 5. The Blue histogram measures the  buyers force , while the Pink  histogram   measures the  sellers force . The change in color signifies the change in strength which leads t he price .  Each  drop (especially below 52.8) after touching levels 96.3 or 1.236 must be condidered
Gold Venamax MT4
Sergei Linskii
5 (1)
Gold Venamax   - 이것은 최고의 주식 기술 지표입니다. 지표 알고리즘은 자산의 가격 변동을 분석하고 변동성과 잠재적 진입 영역을 반영합니다.   표시기 기능: 이것은 편안하고 수익성 있는 거래를 위한 매직과 두 개의 추세 화살표 블록을 갖춘 슈퍼 지표입니다. 블록 전환을 위한 빨간색 버튼이 차트에 표시됩니다. 매직은 표시기 설정에서 설정되므로 서로 다른 블록을 표시하는 두 개의 차트에 표시기를 설치할 수 있습니다. Gold Venamax는 서로 다른 화살표 버퍼(GV 및 SD)를 사용하여 두 개의 차트에 배치할 수 있습니다. 이렇게 하려면 설정에서 다른 Magic을 선택해야 합니다. 예를 들어 하나는 Magic = 999이고 다른 하나는 Magic = 666입니다. 다음으로 차트의 빨간색 버튼으로 화살표 버퍼를 선택할 수 있습니다. 지표 설정의 각 화살표 버퍼(GV 및 SD)에는 편안하고 수익성 있는 거래를 위한 별도의 화살표 필터가 있습니다(UseFiltrGV = t
Rainbow Price Visualizer
Vincent Jose Proenca
Rainbow Price Visualizer v1.21 See where the market really breathes. Turns your MT4 chart into an ultra-precise heatmap that highlights price zones favored by big players. Why it matters 300 price levels at 0.2‑pip resolution — microscopic detail. 8 visual themes (Rainbow, Fire, Ocean…) for instant readibility. Smart opacity: low noise fades, real zones pop. Lightweight rendering with automatic cleanup. Fully customizable: saturation, opacity, resolution, history depth. Bands project into the f
This indicator is designed for M1 time-frame and shows: Sum of ticks when the price goes up (color Green -The major component of a candlestick = the body). Sum of points when the price goes up (color Green -The extension lines at the top of the candle). Sum of points when the price goes down (color Red -The major component of a candlestick = the body). Sum of points when the price goes down (color Red -The extension lines at the lower end of the candle). Keep in mind that Sum of Points will be g
PABT Pattern Indicator - it's classical system one of the signal patterns. Indicator logic - the Hi & Lo of the bar is fully within the range of the preceding bar, look to trade them as pullback in trend. In the way if indicator found PABT pattern it's drawing two lines and arrow what showing trend way.  - First line - it's entry point and drawing at: 1. On the high of signal bar or on middle of the signal bar (depending from indicator mode) for buy; 2. On the low of signal bar or on middle of t
Description A colored universal multicurrency/multi-symbol indicator MACD Line Smart (the indicator moving average convergence divergence is displayed as a histogram) based on double or triple moving average .  Comparing to the standard MACD this indicator is more sensitive to what allows generating advance signals. he indicator may be used with any broker, irrespective of the name of the financial instrument since it is necessary to manually enter the name as an input parameter. If you enter a
이 제품의 구매자들이 또한 구매함
Gann Made Easy
Oleg Rodin
4.83 (153)
Gann Made Easy 는 mr.의 이론을 사용하여 최고의 거래 원칙을 기반으로 하는 전문적이고 사용하기 쉬운 Forex 거래 시스템입니다. W.D. 간. 이 표시기는 Stop Loss 및 Take Profit Levels를 포함하여 정확한 BUY 및 SELL 신호를 제공합니다. PUSH 알림을 사용하여 이동 중에도 거래할 수 있습니다. 거래 팁, 보너스, GANN MADE EA를 무료로 받으시려면 구매 후 저에게 연락주세요! 아마도 Gann 거래 방법에 대해 이미 여러 번 들었을 것입니다. 일반적으로 Gann의 이론은 초보자 거래자뿐만 아니라 이미 거래 경험이 있는 사람들에게도 매우 복잡한 것입니다. Gann의 거래 방식은 이론적으로 적용하기 쉽지 않기 때문입니다. 나는 그 지식을 연마하고 Forex 지표에 최고의 원칙을 적용하기 위해 몇 년을 보냈습니다. 표시기는 적용하기가 매우 쉽습니다. 차트에 첨부하고 간단한 거래 권장 사항을 따르기만 하면 됩니다. 지표는 지속적으로 시장
Pulse Scalping Line - an indicator for identifying potential pivot points. Based on this indicator, you can build an effective Martingale system. According to our statistics, the indicator gives a maximum of 4 erroneous pivot points in a series. On average, these are 2 pivot points. That is, the indicator shows a reversal, it is erroneous. This means that the second signal of the indicator will be highly accurate. Based on this information, you can build a trading system based on the Martingale
Gold Signal Pro
Mohamed Hassan
First 25 copies at $80, after that price becomes $149 (3 copies left) Gold Signal Pro is a powerful MT4 indicator designed to help traders spot strong price reactions in the market. It focuses on clear wick rejections , showing when price strongly rejects a level and often continues in the same direction. Gold Signal Pro is mainly built for scalping gold (XAUUSD) and works best on lower timeframes like M5 and M15 , where timing matters most. That said, it can also be used on any forex pair, a
Smc Blast Signal
Mohit Dhariwal
5 (3)
NEW YEAR 2026 SALE OFFER PRICE AT JUST 75 DOLLARS FEW COPIES ONLY AT This price From 28th Jan -31th Jan MIDNIGHT Final offer GRAB YOUR COPY ON THIS New Year EVE last offer GRAB IT! Prices will be increased to 150 after the offer period ends Full Fledged EA and Alert plus for alerts will also be provided in this offer along with the purchase of Indicator. Limited copies only at this price and Ea too. Grab your copy soon Alert plus for indicator with set file is kept in comment section with the im
현재 20% 할인 ! 초보자 또는 전문가 트레이더를 위한 최고의 솔루션! 이 대시보드 소프트웨어는 28개의 통화 쌍에서 작동합니다. 2가지 주요 지표(Advanced Currency Strength 28 및 Advanced Currency Impulse)를 기반으로 합니다. 전체 Forex 시장에 대한 훌륭한 개요를 제공합니다. 고급 통화 강도 값, 통화 이동 속도 및 모든(9) 시간대의 28 Forex 쌍에 대한 신호를 보여줍니다. 추세 및/또는 스캘핑 기회를 정확히 파악하기 위해 차트의 단일 지표를 사용하여 전체 시장을 볼 수 있을 때 거래가 어떻게 개선될지 상상해 보십시오! 잠재적인 거래를 식별하고 확인하면서 강력한 통화와 약한 통화를 더욱 쉽게 식별할 수 있도록 이 지표에 기능을 내장했습니다. 이 표시기는 통화의 강세 또는 약세가 증가 또는 감소하는지 여부와 모든 시간대에서 수행되는 방식을 그래픽으로 보여줍니다. 추가된 새로운 기능은 현재 시장 조건 변화에 적응하는
Volatility Trend System - a trading system that gives signals for entries. The volatility system gives linear and point signals in the direction of the trend, as well as signals to exit it, without redrawing and delays. The trend indicator monitors the direction of the medium-term trend, shows the direction and its change. The signal indicator is based on changes in volatility and shows market entries. The indicator is equipped with several types of alerts. Can be applied to various trading ins
Trend indicator AI
Ramil Minniakhmetov
4.85 (78)
트렌드 인공 지능 지표는 실행 가능한 진입 점 및 반전 경고와 추세 식별을 결합하여 상인의 시장 분석을 향상시킬 훌륭한 도구입니다. 이 표시기는 사용자가 자신감과 정밀도로 외환 시장의 복잡성을 탐색 할 수 있도록 지원합니다 기본 신호 외에도 트렌드 인공 지능 지표는 풀백 또는 되돌림 중에 발생하는 2 차 진입 점을 식별하여 거래자가 기존 트렌드 내에서 가격 수정을 활용할 수 있도록합니다. 중요한 장점: ·작동 4 및 5 *명확한 구매 또는 판매 신호 *다시 칠하지 않습니다 *모든 자산에서 작동 나는 전보 사기에 개 또는 세트를 판매하지 않도록주의. 모든 설정은 블로그에 여기에 무료.  중요! 지침 및 보너스를 얻기 위해 구입 후 즉시 저에게 연락! 진짜 가동 감시는 뿐 아니라 나의 다른 제품 여기에서 찾아낼 수 있습니다: https://www.mql5.com/en/users/mechanic/seller&nbsp ; 설정 및 입력: 모든 자산에 대해 기본 설정을 권
Apollo SR Master
Oleg Rodin
5 (1)
Apollo SR Master는 지지/저항 구간에서의 거래를 더욱 쉽고 안정적으로 만들어 주는 특수 기능을 갖춘 지지/저항 지표입니다. 이 지표는 지역 가격의 고점과 저점을 감지하여 시간 지연 없이 실시간으로 지지/저항 구간을 계산합니다. 새롭게 형성된 저항 구간을 확인하기 위해 지표는 해당 저항 구간을 실제 매도 또는 매수 신호로 활용할 수 있음을 나타내는 특수 신호를 표시합니다. 이 경우, 저항 구간의 강도가 높아지고, 따라서 저항 구간에서의 성공적인 거래 가능성도 높아집니다. 이것이 바로 이 지표의 핵심 아이디어입니다. SR 존은 손절매와 이익실현을 더욱 쉽게 할 수 있도록 해줍니다. 신호 방향에 따라 SR 존 위 또는 아래 공간을 손절매로 활용할 수 있습니다. 또한, 반대쪽 SR 존은 잠재적 이익실현 영역으로 활용할 수 있습니다. 또한 Apollo SR Master 지표를 사용하는 모든 사용자에게 "Apollo Price Action System" 지표를 무료로 제공합니다.
Atomic Analyst
Issam Kassas
5 (3)
우선적으로 언급할 점은이 거래 지표가 다시 그리지 않고 지연되지 않으며 이를 통해 수동 및 로봇 거래 모두에 이상적이라는 점입니다. 사용자 매뉴얼: 설정, 입력 및 전략. Atomic Analyst는 가격의 강도와 모멘텀을 활용하여 시장에서 더 나은 이점을 찾는 PA Price Action Indicator입니다. 고급 필터를 장착하여 잡음과 거짓 신호를 제거하고 거래 잠재력을 높이는 데 도움이 됩니다. 복잡한 지표의 다중 레이어를 사용하여 Atomic Analyst는 차트를 스캔하고 복잡한 수학적 계산을 간단한 신호와 색상으로 변환하여 초보 트레이더가 이해하고 일관된 거래 결정을 내릴 수 있도록합니다. "Atomic Analyst"는 새로운 및 경험이 풍부한 트레이더를위한 종합적인 거래 솔루션입니다. 프리미엄 지표와 최고 수준의 기능을 하나의 거래 전략에 결합하여 모든 종류의 트레이더에 대한 다재다능한 선택지가되었습니다. 인트라데이 거래 및 스캘핑 전략 : 빠르고 정확한 일일
이 지표를 구매하면 제 프로페셔널 트레이드 매니저를 무료로 드립니다. 우선 이 거래 시스템이 리페인팅, 리드로잉 및 레이그 인디케이터가 아니라는 점을 강조하는 것이 중요합니다. 이는 수동 및 로봇 거래 모두에 이상적인 것으로 만듭니다. 온라인 강좌, 설명서 및 프리셋 다운로드. "스마트 트렌드 트레이딩 시스템 MT5"은 새로운 및 경험이 풍부한 트레이더를 위해 맞춤형으로 제작된 종합적인 거래 솔루션입니다. 10개 이상의 프리미엄 인디케이터를 결합하고 7개 이상의 견고한 거래 전략을 특징으로 하여 다양한 시장 조건에 대한 다목적 선택이 가능합니다. 트렌드 추종 전략: 효과적인 트렌드 추이를 타기 위한 정확한 진입 및 손절 관리를 제공합니다. 반전 전략: 잠재적인 트렌드 반전을 식별하여 트레이더가 범위 시장을 활용할 수 있게 합니다. 스캘핑 전략: 빠르고 정확한 데이 트레이딩 및 단기 거래를 위해 설계되었습니다. 안정성: 모든 인디케이터가 리페인팅, 리드로잉 및 레이그가 아니므로 신뢰
GOLD Impulse with Alert
Bernhard Schweigert
4.64 (11)
이 지표는 Advanced Currency IMPULSE with ALERT  +   Currency Strength Exotics  의 2가지 제품의 슈퍼 조합입니다. 그것은 모든 시간 프레임에 대해 작동하며 8개의 주요 통화와 하나의 기호에 대한 강약의 충동을 그래픽으로 보여줍니다! 이 표시기는 금, 이국적인 쌍, 상품, 지수 또는 선물과 같은 기호에 대한 통화 강도 가속을 표시하는 데 특화되어 있습니다. 금, 은, 오일, DAX, US30, MXN, TRY, CNH 등의 진정한 통화 강도 가속(충동 또는 속도)을 표시하기 위해 9번째 줄에 모든 기호를 추가할 수 있습니다. 새로운 기본 알고리즘을 기반으로 구축되어 잠재적인 거래를 훨씬 더 쉽게 식별하고 확인할 수 있습니다. 이는 통화의 강세 또는 약세가 가속되는지 여부를 그래픽으로 표시하고 가속 속도를 측정하기 때문입니다. 자동차의 속도계처럼 생각하면 됩니다. 가속화할 때 Forex 시장에서 동일한 일이 분명히 더 빠르
Scalper Inside PRO
Alexey Minkov
4.74 (69)
An exclusive indicator that utilizes an innovative algorithm to swiftly and accurately determine the market trend. The indicator automatically calculates opening, closing, and profit levels, providing detailed trading statistics. With these features, you can choose the most appropriate trading instrument for the current market conditions. Additionally, you can easily integrate your own arrow indicators into Scalper Inside Pro to quickly evaluate their statistics and profitability. Scalper Inside
M1 Sniper
Oleg Rodin
4.89 (18)
M1 SNIPER 는 사용하기 쉬운 거래 지표 시스템입니다. M1 시간대에 맞춰 설계된 화살표 지표입니다. 이 지표는 M1 시간대 스캘핑을 위한 단독 시스템으로 사용할 수 있으며, 기존 거래 시스템의 일부로도 사용할 수 있습니다. 이 거래 시스템은 M1 시간대 거래용으로 특별히 설계되었지만, 다른 시간대에도 사용할 수 있습니다. 원래는 XAUUSD와 BTCUSD 거래를 위해 이 방법을 설계했지만, 다른 시장 거래에도 유용하다는 것을 알게 되었습니다. 이 지표의 신호는 추세 방향과 반대로 거래될 수 있습니다. 저는 지표의 신호를 활용하여 양방향으로 거래할 수 있도록 돕는 특별한 거래 기법을 알려드립니다. 이 방법은 특별한 동적 지지선과 저항선 가격 영역을 활용하는 것을 기반으로 합니다. 구매하시면 M1 SNIPER 화살표 지표를 바로 다운로드하실 수 있습니다. 또한, 아래 스크린샷에 표시된 Apollo Dynamic SR 지표는 M1 SNIPER 도구를 사용하는 모든 사용자에게 무료로
Currency Strength Wizard
Oleg Rodin
4.84 (55)
통화 강도 마법사는 성공적인 거래를 위한 올인원 솔루션을 제공하는 매우 강력한 지표입니다. 표시기는 여러 시간 프레임의 모든 통화 데이터를 사용하여 이 또는 해당 외환 쌍의 힘을 계산합니다. 이 데이터는 특정 통화의 힘을 확인하는 데 사용할 수 있는 사용하기 쉬운 통화 지수 및 통화 전력선의 형태로 표시됩니다. 필요한 것은 거래하려는 차트에 표시기를 부착하는 것뿐입니다. 표시기는 거래하는 통화의 실제 강세를 보여줍니다. 지표는 또한 추세와 거래할 때 유리하게 사용할 수 있는 구매 및 판매 거래량 압력의 극한값을 보여줍니다. 지표는 또한 피보나치에 기반한 가능한 대상을 보여줍니다. 표시기는 PUSH 알림을 포함한 모든 유형의 알림을 제공합니다. 구매 후 연락주세요. 나는 당신과 거래 팁을 공유하고 당신에게 무료로 훌륭한 보너스 지표를 줄 것입니다! 나는 당신에게 행복하고 유익한 거래를 기원합니다!
Miraculous Indicator – Gann Square of Nine 기반 100% 비리페인트 Forex 및 바이너리 도구 이 영상은 Miraculous Indicator 를 소개합니다. 이 지표는 Forex 및 바이너리 옵션 트레이더를 위해 특별히 개발된 매우 정확하고 강력한 트레이딩 도구입니다. 이 지표가 독특한 이유는 전설적인 **Gann Square of Nine(Gann 9의 사각형)**과 **Gann's Law of Vibration(Gann 진동의 법칙)**에 기반을 두고 있기 때문입니다. 이는 현대 트레이딩에서 가장 정밀한 예측 도구 중 하나로 손꼽힙니다. Miraculous Indicator는 완전히 비리페인트(non-repaint) 됩니다. 즉, 캔들이 마감된 후에도 신호가 변경되거나 사라지지 않습니다. 보이는 것이 곧 결과입니다. 이는 트레이더가 자신감을 가지고 거래에 진입하고 청산할 수 있는 신뢰할 수 있고 일관된 기반을 제공합니다. 주요 특징: Gann
Currency Strength Exotics
Bernhard Schweigert
4.88 (33)
현재 20% 할인! 초보자 또는 전문가 트레이더를 위한 최고의 솔루션! 이 표시기는 Exotic Pairs Commodities, Indexes 또는 Futures와 같은 기호에 대한 통화 강도를 표시하는 데 특화되어 있습니다. 금, 은, 석유, DAX, US30, MXN, TRY, CNH 등의 진정한 통화 강도를 보여주기 위해 9번째 줄에 모든 기호를 추가할 수 있습니다. 이것은 독특하고 고품질이며 저렴한 거래 도구입니다. 우리는 많은 독점 기능과 새로운 공식을 통합했습니다. 새로운 추세 또는 스캘핑 기회의 정확한 트리거 포인트를 정확히 찾아낼 수 있기 때문에 거래가 어떻게 개선될지 상상해 보십시오. 사용 설명서: 여기를 클릭 https://www.mql5.com/en/blogs/post/708876 모든 시간대에 작동합니다. TREND를 빠르게 확인할 수 있습니다! 새로운 기본 알고리즘을 기반으로 설계되어 잠재적인 거래를 더욱 쉽게 식별하고 확인할 수 있습니다. 8개의
RFI levels PRO
Roman Podpora
사전 지표       시장 반전 수준과 영역을 파악하여   가격이 해당 수준으로 되돌아올 때까지 기다렸다가 새로운 추세의 시작점에서 진입할 수 있도록 해줍니다. 즉, 추세의 끝에서 진입하는 것이 아닙니다. 그는 보여준다       반전 수준       시장이 방향 전환을 확인하고 추가적인 움직임을 형성하는 지점입니다. 이 지표는 차트를 다시 그릴 필요 없이 작동하며, 모든 금융 상품에 최적화되어 있고, 특정 금융 상품과 함께 사용할 때 최대의 잠재력을 발휘합니다.       트렌드 라인즈 프로       지시자. 모든 계측기에 적용 가능한 가역 구조 스캐너 모든 거래 상품을 자동으로 추적하고 모든 R-반전 패턴을 즉시 식별하여 LOGIC AI 신호가 이미 존재하는 위치와 기타 유용한 정보를 표시합니다. 로직 AI – 진입점을 표시해주는 도우미 시장 진입에 가장 적합한 시점을 판단하는 지능형 신호입니다. TPSproSYSTEM 알고리즘을 사용하여 가격 변동, 추세 및 주요 시장 참
IQ Gold Gann Levels
INTRAQUOTES
5 (4)
Presenting one-of-a-kind Gann Indicator for XAUUSD IQ Gold Gann Levels is a non-repainting, precision tool designed exclusively for XAUUSD/Gold intraday trading. It uses W.D. Gann’s square root method to plot real-time support and resistance levels, helping traders spot high-probability entries with confidence and clarity. William Delbert Gann (W.D. Gann) was an exceptional market analyst whose trading technique was based on a complex blend of mathematics, geometry, astrology, and ancient calcul
Basic Harmonic Patterns Dashboard
Mehran Sepah Mansoor
5 (3)
이 대시보드는 선택한 심볼에 대해 사용 가능한 최신 고조파 패턴을 표시하므로 시간을 절약하고 더 효율적으로 사용할 수 있습니다 / MT5 버전 . 무료 인디케이터: Basic Harmonic Pattern 인디케이터 열 Symbol : 선택한 심볼이 나타납니다 Trend : 강세 또는 약세 Pattern : 패턴 유형(가틀리, 나비, 박쥐, 게, 상어, 사이퍼 또는 ABCD) Entry : 진입 가격 SL: 스톱로스 가격 TP1: 1차 테이크프로핏 가격 TP2: 2차 테이크프로핏 가격 TP3: 3차 테이크프로핏 가격 Current price: 현재 가격 Age (in bars): 마지막으로 그려진 패턴의 나이 주요 입력 Symbols : "28개 주요 통화쌍" 또는 "선택한 심볼" 중에서 선택합니다. Selected Symbols : 쉼표로 구분하여 모니터링하려는 원하는 심볼("EURUSD,GBPUSD,XAUUSD")을 선택합니다. 브로커에 쌍에 접미사 또는 접두사가 있는
Easy Breakout
Mohamed Hassan
4.71 (14)
After your purchase, feel free to contact me for more details on how to receive a bonus indicator called VFI, which pairs perfectly with Easy Breakout for enhanced confluence!    Easy Breakout is a powerful price action trading system built on one of the most popular and widely trusted strategies among traders: the Breakout strategy ! This indicator delivers crystal-clear Buy and Sell signals based on breakouts from key support and resistance zones. Unlike typical breakout indicators, it levera
Matrix Arrow Indicator MT4
Juvenille Emperor Limited
5 (3)
매트릭스 화살표 표시기 MT4 는 외환, 상품, 암호 화폐, 지수, 주식과 같은 모든 기호/도구에 사용할 수 있는 100% 다시 칠하지 않는 다중 기간 표시기를 따르는 고유한 10 in 1 추세입니다.  Matrix Arrow Indicator MT4 는 다음과 같은 최대 10개의 표준 지표에서 정보와 데이터를 수집하여 초기 단계에서 현재 추세를 결정합니다. 평균 방향 이동 지수(ADX) 상품 채널 지수(CCI) 클래식 하이켄 아시 캔들 이동 평균 이동 평균 수렴 발산(MACD) 상대 활력 지수(RVI) 상대 강도 지수(RSI) 포물선 SAR 스토캐스틱 오실레이터 윌리엄스의 백분율 범위 모든 지표가 유효한 매수 또는 매도 신호를 제공하면 강력한 상승/하락 추세를 나타내는 다음 캔들/막대가 시작될 때 해당 화살표가 차트에 인쇄됩니다. 사용자는 사용할 표시기를 선택하고 각 표시기의 매개변수를 개별적으로 조정할 수 있습니다. 매트릭스 화살표 표시기 MT4는 선택한 표시기에서만 정보를 수
F-16 비행기 지표를 소개합니다. 이것은 귀하의 거래 경험을 혁신하도록 설계된 최첨단 MT4 도구입니다. F-16 전투기의 비할 데 없는 속도와 정밀성에 영감을 받아이 지표는 고급 알고리즘과 최첨단 기술을 결합하여 금융 시장에서 압도적인 성능을 제공합니다. F-16 비행기 지표를 사용하면 실시간 분석을 제공하고 매우 정확한 거래 신호를 생성하여 경쟁을 앞서갈 수 있습니다. 다양한 자산 클래스에서 수익 기회를 식별하는 데 필요한 동적 기능을 갖추고 있어 확신을 가지고 정보에 근거한 결정을 내릴 수 있습니다. 사용자 친화적인 인터페이스로 구성된 F-16 비행기 지표는 인기있는 MetaTrader 4 플랫폼과 완벽하게 통합되어 원활하고 효율적인 거래 과정을 보장합니다. 초보자 트레이더든 경험 많은 전문가든 이 지표를 쉽게 사용자 정의하여 고유한 거래 스타일과 선호도에 맞출 수 있습니다. F-16 비행기 지표의 강력함을 경험해 보세요. 이 지표는 시장 트렌드를 정확하고 민첩하게 탐색하며
Gold Scalper Super
Aleksandr Makarov
5 (1)
Gold Scalper Super is an easy-to-use trading system. The indicator can be used as a standalone scalping system on the M1 time frame, as well as part of your existing trading system. Bonus: when purchasing an indicator, Trend Arrow Super is provided free of charge, write to us after purchase. The indicator 100% does not repaint!!! If a signal appears, it does not disappear! Unlike indicators with redrawing, which lead to the loss of a deposit, because they can show a signal and then remove it.
Advanced Supply Demand
Bernhard Schweigert
4.91 (296)
현재 33% 할인! 초보자나 전문 트레이더를 위한 최고의 솔루션! 이 보조지표는 우리가 다수의 독창적 기능과 새로운 공식을 통합한 독특하고 고품질이며 저렴한 거래 도구입니다. 이 업데이트를 통해 이중 시간대를 표시할 수 있습니다. 더 높은 TF를 표시할 수 있을 뿐만 아니라 차트 TF와 더 높은 TF 모두를 표시할 수 있습니다: 중첩 영역 표시. 모든 Supply Demand 트레이더들이 좋아할 것입니다. :) 중요한 정보 공개 Advanced Supply Demand의 잠재력을 극대화하려면 다음을 방문하십시오. https://www.mql5.com/ko/blogs/post/720245   진입 또는 목표의 명확한 트리거 포인트를 정확히 찾아냄으로 해서 거래가 어떻게 개선될지 상상해 보십시오. 새로운 알고리즘을 기반으로 매수자와 매도자 간의 잠재적인 불균형을 훨씬 더 쉽게 분간할 수 있습니다. 왜냐하면 가장 강한 공급영역과 가장 강한 수요 영역과 과거에 어떻게 진행 되었는지를(이전
TPSpro RFI Levels
Roman Podpora
4.85 (27)
러시아어 설명서  /  영어   설명서  /  MT5 버전 주요 기능: 판매자와 구매자의 활동 영역을 표시합니다! 이 지표는 매수 및 매도에 대한 모든 올바른 첫 번째 임펄스 레벨/존을 표시합니다. 진입점 검색이 시작되는 이러한 레벨/존이 활성화되면 레벨의 색상이 바뀌고 특정 색상으로 채워집니다. 상황을 더욱 직관적으로 파악할 수 있도록 화살표도 표시됩니다. LOGIC AI - 템플릿 활성화 시 진입점 검색을 위한 영역(원) 표시 시각적 명확성을 개선하기 위해 인공지능을 사용하여 진입점을 검색한 영역을 표시하는 기능이 추가되었습니다. 더 높은 시간대의 레벨/존 표시(MTF 모드) 더 높은 시간 간격을 사용하여 레벨/존을 표시하는 기능이 추가되었습니다. 또한, 이 지표는 자동 추세 감지 기능(   TPSproTREND PRO   )을 구현했습니다. 거래를 위한 별도의 전문적인 단계별 알고리즘 이 알고리즘은 추세 방향과 반대 방향으로의 당일 거래 모두에 적합하도록 설계되었습니다. 각
FX Volume
Daniel Stein
4.63 (38)
FX Volume: 브로커 시각에서 바라보는 진짜 시장 심리 간단 요약 트레이딩 접근 방식을 한층 더 향상시키고 싶으신가요? FX Volume 는 소매 트레이더와 브로커의 포지션을 실시간으로 파악할 수 있게 해 줍니다. 이는 COT 같은 지연된 보고서보다 훨씬 빠릅니다. 꾸준한 수익을 추구하는 분이든, 시장에서 더 깊은 우위를 원하시는 분이든, FX Volume 을 통해 대규모 불균형을 찾아내고, 돌파 여부를 확인하며 리스크 관리를 정교화할 수 있습니다. 지금 시작해 보세요! 실제 거래량 데이터가 의사결정을 어떻게 혁신할 수 있는지 직접 경험해 보시기 바랍니다. 1. 트레이더에게 FX Volume이 매우 유익한 이유 탁월한 정확도를 지닌 조기 경보 신호 • 다른 사람들보다 훨씬 앞서, 각 통화쌍을 매수·매도하는 트레이더 수를 거의 실시간으로 파악할 수 있습니다. • FX Volume 은 여러 리테일 브로커에서 추출한 실제 거래량 데이터를 종합해 명확하고 편리한 형태로 제공하는
PRO Renko System
Oleg Rodin
5 (30)
PRO Renko System 은 RENKO 차트 거래를 위해 특별히 고안된 매우 정확한 거래 시스템입니다. 이것은 다양한 거래 상품에 적용될 수있는 보편적 인 시스템입니다. 체계는 효과적으로 당신에게 정확한 반전 신호에 접근을 주는 소위 시장 소음을 중화합니다. 이 표시기는 사용하기가 매우 쉽고 신호 생성을 담당하는 매개 변수가 하나만 있습니다. 당신은 쉽게 당신의 선택의 어떤 무역 계기에 공구를 적응시킬 수 있고 renko 막대기의 크기. 나는 항상 당신이 내 소프트웨어로 수익성있게 거래 할 수 있도록 추가 지원을 제공 할 준비가되어 있습니다! 나는 당신에게 행복하고 수익성있는 거래를 기원합니다! 구매 후 저에게 연락하십시오! 내 렌코 차트 생성기를 보내드립니다. 또한 내 개인 권장 사항 및 시스템의 다른 모듈을 무료로 공유 할 것입니다!
Day Trader Master
Oleg Rodin
5 (15)
Day Trader Master 는 데이 트레이더를 위한 완벽한 거래 시스템입니다. 시스템은 두 개의 지표로 구성됩니다. 하나의 지표는 매수 및 매도를 위한 화살표 신호입니다. 얻을 수 있는 화살표 표시기입니다. 2차 지표를 무료로 드립니다. 두 번째 지표는 이러한 화살표와 함께 사용하도록 특별히 설계된 추세 지표입니다. 표시기는 반복하지 않고 늦지 않습니다! 이 시스템을 사용하는 것은 매우 간단합니다. 2색 선으로 표시되는 현재 추세 방향의 화살표 신호를 따라가기만 하면 됩니다. 파란색은 구매 추세입니다. 빨간색은 판매 추세입니다. 파란색 화살표는 매수 신호입니다. 빨간색 화살표는 매도 신호입니다. 추세선의 색상과 일치하려면 화살표의 색상과 신호의 방향이 필요합니다. 화살표 표시기는 주로 시간 간격 M5 및 M15에서 일중 거래를 위해 만들어졌습니다. 그러나 기술적으로 시스템은 다른 시간 간격으로 사용할 수 있습니다. 표시기에는 PUSH 메시지 기능이 있는 팝업 경고가 장착되어 있
FX Power MT4 NG
Daniel Stein
4.95 (20)
FX Power: 통화 강세 분석으로 더 스마트한 거래 결정을 개요 FX Power 는 어떤 시장 상황에서도 주요 통화와 금의 실제 강세를 이해하기 위한 필수 도구입니다. 강한 통화를 매수하고 약한 통화를 매도함으로써 FX Power 는 거래 결정을 단순화하고 높은 확률의 기회를 발견합니다. 트렌드를 따르거나 극단적인 델타 값을 사용해 반전을 예측하고자 한다면, 이 도구는 귀하의 거래 스타일에 완벽히 적응합니다. 단순히 거래하지 말고, FX Power 로 더 스마트하게 거래하세요. 1. FX Power가 거래자에게 매우 유용한 이유 통화와 금의 실시간 강세 분석 • FX Power 는 주요 통화와 금의 상대적 강세를 계산하고 표시하여 시장 역학에 대한 명확한 통찰력을 제공합니다. • 어떤 자산이 앞서고 있고 어떤 자산이 뒤처지는지 모니터링하여 보다 현명한 거래 결정을 내릴 수 있습니다. 포괄적인 멀티 타임프레임 뷰 • 단기, 중기 및 장기 타임프레임에서 통화와 금의 강세를
지진계 Marketquake Detector. Description in English : https://www.mql5.com/en/market/product/113869?source=Site+Market+Product+Page#description How to use the Seismograph : https://www.mql5.com/en/market/product/113869#!tab=comments&page=2&comment=52806941 Create an EA : https://www.mql5.com/en/market/product/113869#!tab=comments&page=3&comment=52816509 어떤 방식으로 거래하든 유동성이 낮은 시장에 진입하는 것을 피하고 싶을 것입니다.- 지진계는 시장 랠리 전에 시장에 진입할 수 있는 적절한 시기를 도와줄 것입니다. 그러나 바쁠 시장 시간에 진입을 확인했음에도 불구하고 많은 사람들이 유동성이 부족한 시
제작자의 제품 더 보기
The indicator for Forex and Binary options is based on 2 standard indicators in MT4: ADX and RVI. The signals are received when the lines of both indicators intersect simultaneously. But the reverse of the signals is also written into the codes. This is when the signals are converted in the opposite direction. You can also enable and disable each of the indicators. And also 2 types of signals can be used in RVI: 1) Just when one line is above/below the other (this is good to use as a recoilles
Super volumes
Yerzhan Satov
4 (1)
The arrow indicator for Forex and Binary options is based on tick volumes. Unlike many volume indicators, the "Super volumes" indicator calculates bullish and bearish volumes and gives signals based on the predominance of any of them. If, say, there was an advantage of bullish volumes in this range at the moment, then the signal will be on Buy. Or if the predominance was bearish volumes, then, accordingly, the signal will be on Sell. In the indicator settings in the "volumes" variable, you can
Anaconda LD
Yerzhan Satov
The arrow indicator "Anaconda LD" is a reversal indicator for the Forex market and mainly for Binary options. The algorithm is written on the basis of reversal patterns. It is better to use it together with other indicators to filter signals. Even with the standard ones in MT4, even with other custom ones. Any channel indicators or level indicators are especially suitable... You need to select your expiration time for different assets. Which are 1-5 bars on different pairs.
Cripton
Yerzhan Satov
The arrow indicator for Binary Options and Forex is a reversal indicator. Created and written on the basis of reversal patterns. It is recommended for Binary Options to put it on the M5 chart. Enter into transactions for 1-3 bars. Depending on the trading sessions, you need to select your expiration time for a different asset.  You can change settings in external variables. Thus, you can both increase and decrease the frequency of signals. The arrows of the indicator do not draw at all. So you
The arrow indicator "Create a cool signal" for the Binary options and Forex market is a kind of constructor of its signals! In which you can choose your own signal conditions based on 10 standard MT4 indicators prescribed in it, plus another third-party buffer indicator that you can add to the "buffer indicators" variable. This is done simply! Prescribe the name of your indicator and prescribe its numbers (you will find them in the colors section where the numbers up to the buffer color are in
Highway pro
Yerzhan Satov
바이너리 옵션 및 외환"고속도로 이익"에 대한 지표는 채널 라인 뒤에 가격을 찾는 원칙을 기반으로합니다. 가격이 채널을 떠나 서서히 돌아 가기 시작하면 신호가 나타납니다. 그러한 지표를 거래하는 것은 매우 쉽고 편리합니다. 그리고 초보자 상인 또는 수년간의 경험을 가진 상인조차도 그것을 거래 할 수 있습니다. 각 자산에 대해 고유한 설정을 선택해야 합니다. 예를 들어,추세에 대한 막대를 계산하기 위한 기간입니다. 추세는 채널의 중간 선으로 표시됩니다. 녹색은 구매를 의미하고 붉은 색은 판매를 의미합니다. 또한"범위"변수에 설정된 다른 거래 세션에서 채널 폭을 조정해야합니다. 디지털 값이 높을수록 채널이 넓어집니다. 음,낮은 변수에서 편리한 화살표 및 선 매개 변수를 선택할 수 있습니다. 두께,막대에서 화살표의 거리,코드 및 색상. 화살표는 실시간으로 그려지지 않습니다. 그들은 바에서 바로 뛰어 사라지지 않습니다. 그러나 타임 스탬프를 전환 한 후 값을 변경합니다... 모두
Space signals
Yerzhan Satov
The Space signals signal indicator is my new development for trading on the Forex and Binary options markets. The algorithm of the indicator is written so that it tracks the trend and gives signals for the end of the corrective price movement. In the settings, you can set the signal period yourself. The higher the value in the "period" variable, the less frequent the signals will be. But they will naturally be of higher quality.  You can also choose the arrow codes on the chart, the distance
The indicator for Forex and Binary Options trading is based on the standard Mt4 Simple Moving Average indicator. But the difference from the standard indicator is that its lines are repainted in different colors depending on the state of the trend. If the color is green, then the trend is to buy. If it's red, then it's for sale. During a trend phase change, an audio alert appears along with a buffer on the chart in the middle of the lines. Thus, it is possible to determine the state of the trend
The new Dynamic PACK Hi Tf indicator is based on tick volumes. The middle line shows the average price for the selected period of the selected senior timeframe. The upper and lower lines show the maximum/minimum of the same selected period of the same timeframe. In the settings, the user can optionally choose which timeframe and bar calculation period he needs. You can also change the style, thickness, and color of each of the lines.  In the "StsrtBars" parameter, you can select the start peri
Level Delta
Yerzhan Satov
The Level DELTA indicator for MetaTrader 4 (MT4) – a powerful volume analysis tool that stands out with its capabilities and accuracy. Indicator Description The Level DELTA indicator is designed for volume analysis in a separate MT4 window. Its main task is to identify and display divergences, allowing traders to make more informed and timely decisions. Indicator Features Volume Analysis : The indicator analyzes volumes in financial markets, allowing you to see how volumes are distributed over d
The "Volume POC WVAP" Indicator is a revolutionary tool for traders seeking in-depth analysis across various financial markets. This unique indicator, based on tick volumes in the MT4 terminal, provides indispensable information for making informed trading decisions in the following markets: Forex, binary options, cryptocurrency, spot, futures, and indices. Key Features: WVAP Line: Weighted Volume Average Price: The WVAP calculates the weighted volume average price on the selected timeframe, all
POC, Volume Profile, Market Profile, Volume Indicator, Dynamic POC, Tick Volume, Forex Volume The Dynamic POC Hi Tf Arrow indicator is a reliable volume analysis tool (volume profile, market profile, tick volume) for accurately determining POC levels and price reactions. Dynamic POC Hi Tf arrow for MT4 Description Dynamic POC Hi Tf arrow is a professional volume analysis indicator designed to accurately identify key price levels and market direction. It is built on tick volume data and displ
Quantum Empire GRID PRO - Next Generation Trading System Revolutionary Trading Technology Quantum Empire GRID PRO represents a breakthrough in automated trading, combining intelligent grid strategy with averaging system and signal filtering. After 2+ years of real-market testing, this EA has proven its stability and profitability across various asset classes. Key Features: Smart Averaging System : When closing a series of trades, profit averages 3:1 relative to losses 4 Signal Mode
Quantum Dynamic POC Hi Tf for MT5 Description: The "Quantum Dynamic POC Hi Tf" is a unique indicator developed for volume analysis. It is suitable for both real volumes (on futures contracts) and tick volumes (on the Forex market). The indicator is a channel tool consisting of three lines that dynamically change depending on the selected timeframe: Middle Line : the main dynamic Point of Control (POC), which reflects the average volume price. Upper Line : the maximum of the selected timeframe. L
Quqntum Delta
Yerzhan Satov
The Quantum   DELTA indicator for MetaTrader 5 (MT5) – a powerful volume analysis tool that stands out with its capabilities and accuracy. Indicator Description The Quantum   DELTA indicator is designed for volume analysis in a separate MT5 window. Its main task is to identify and display divergences, allowing traders to make more informed and timely decisions. Indicator Features Volume Analysis : The indicator analyzes volumes in financial markets, allowing you to see how volumes are distribute
Title: MACD Signals Discover the MACD Signals indicator – your reliable assistant in the world of trading! Description: The "MACD Signals" indicator is designed to make your trading more successful and efficient. It displays signals on the main chart as bright vertical lines that are easy to spot. You can customize the color and thickness of these lines to perfectly match your style and preferences. Features: Signals: Vertical lines on the main chart that stand out among other elements.
필터:
리뷰 없음
리뷰 답변