Voss Prediction Indicator MT4
- Indicatori
- Versione: 1.1
- Attivazioni: 5
Description
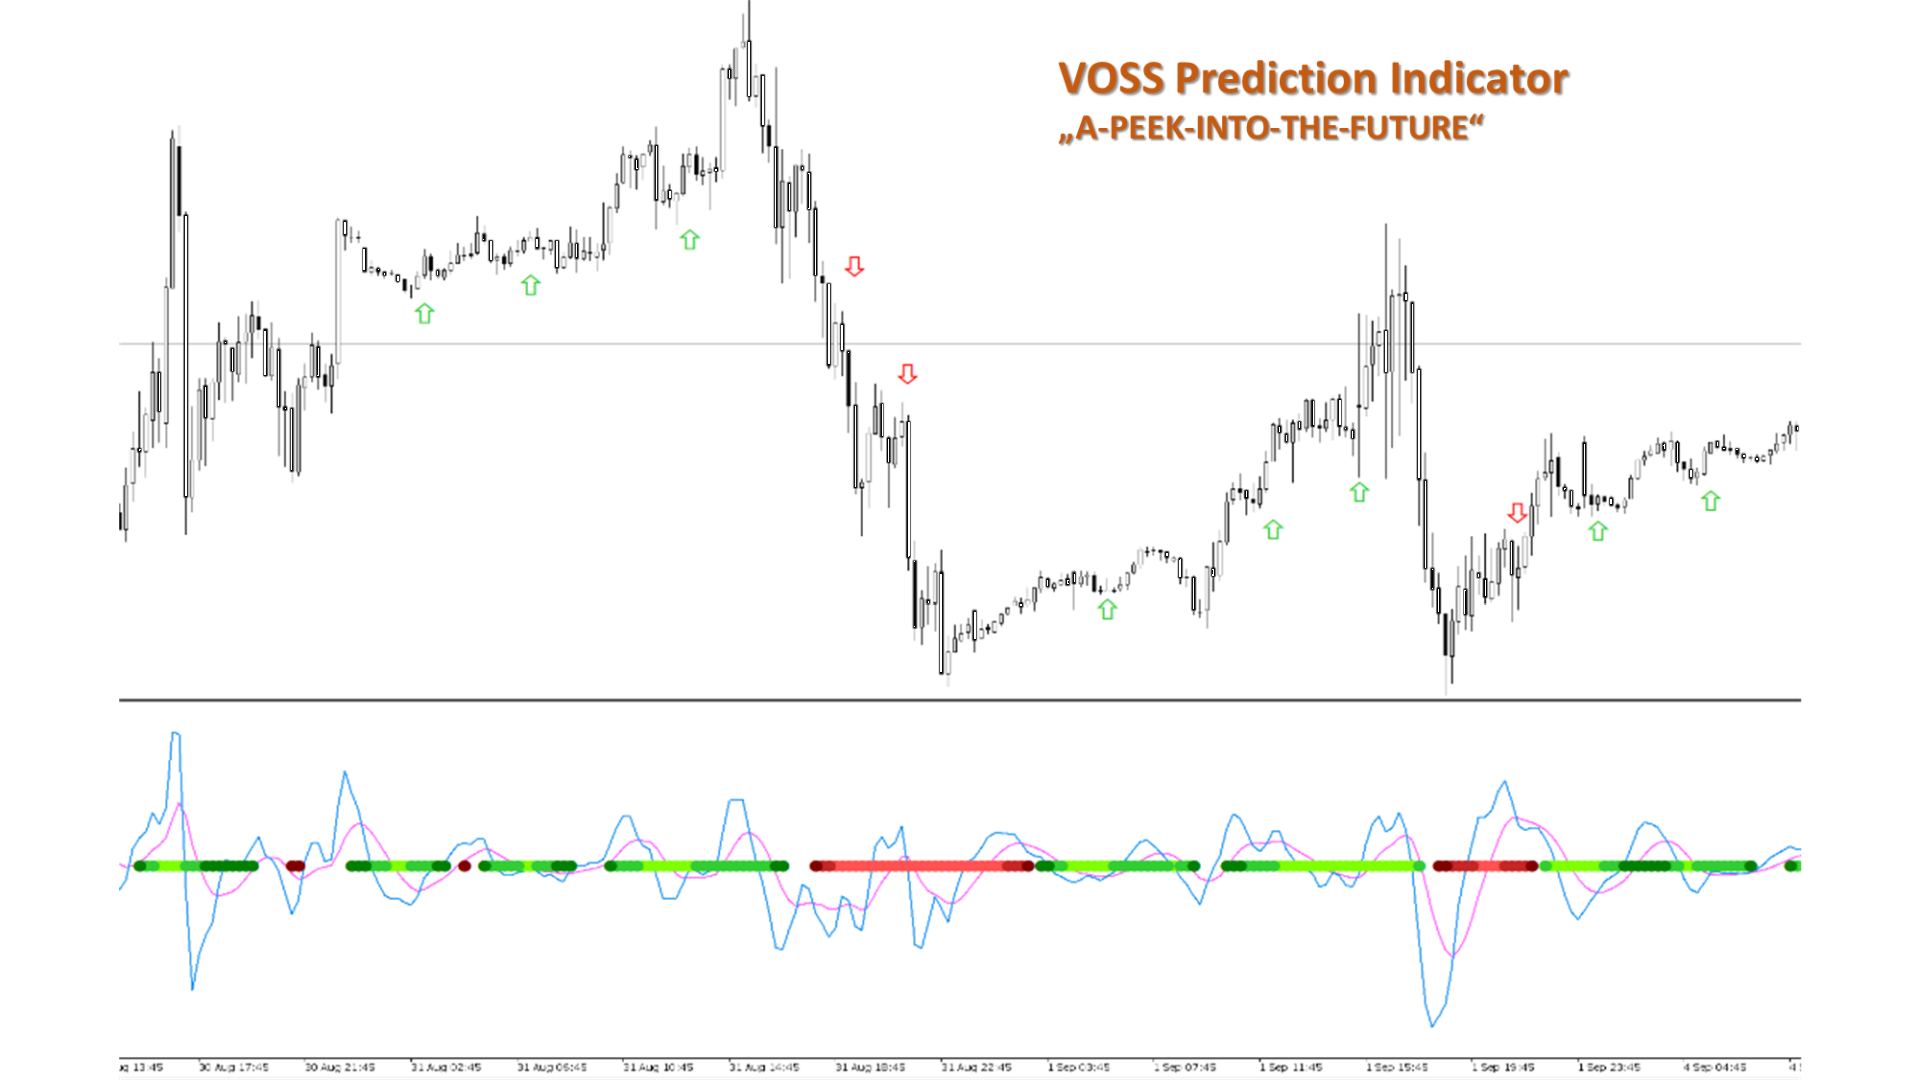
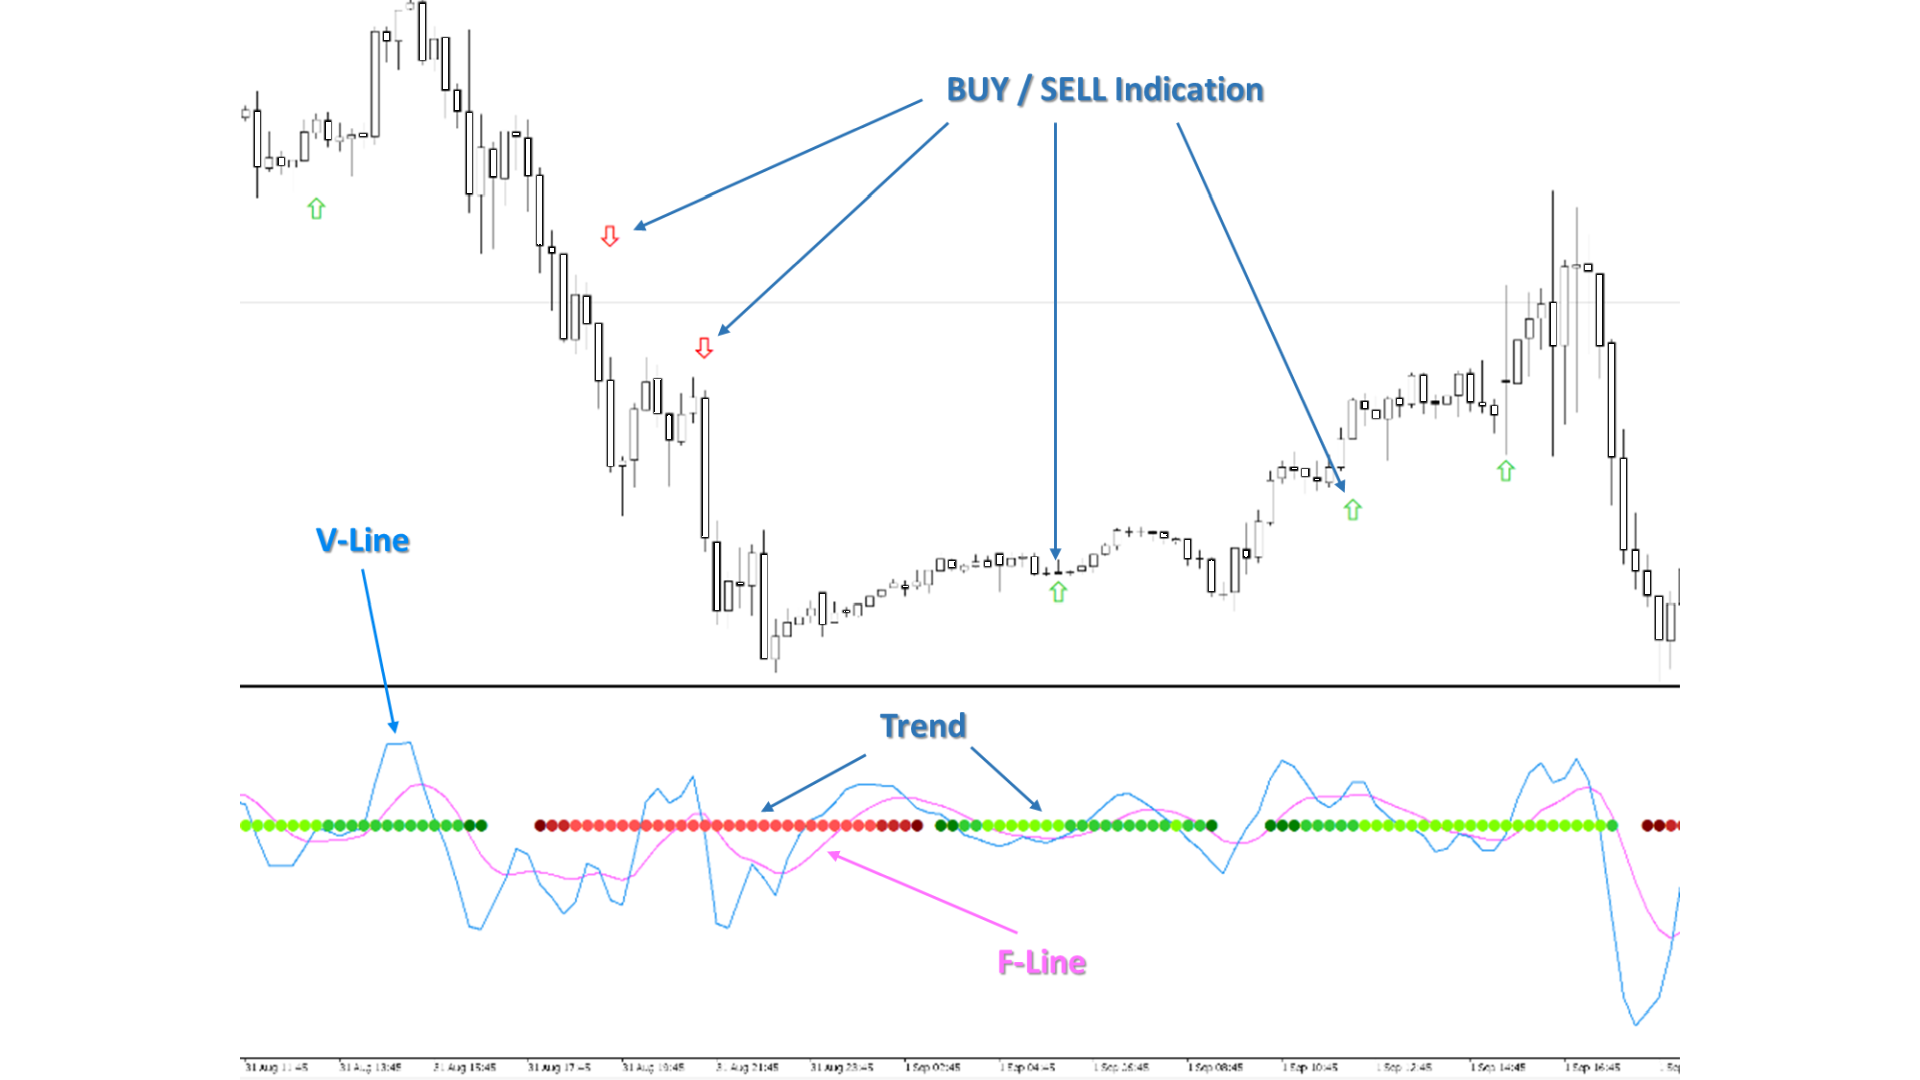
This is a modified version of the popular Voss Predictive Filter - A peek into the future by Dr. John Ehlers. It contains 2 lines - V-Line (blue) and F-Line (red), a trend indication and BUY/SELL signals.Usage
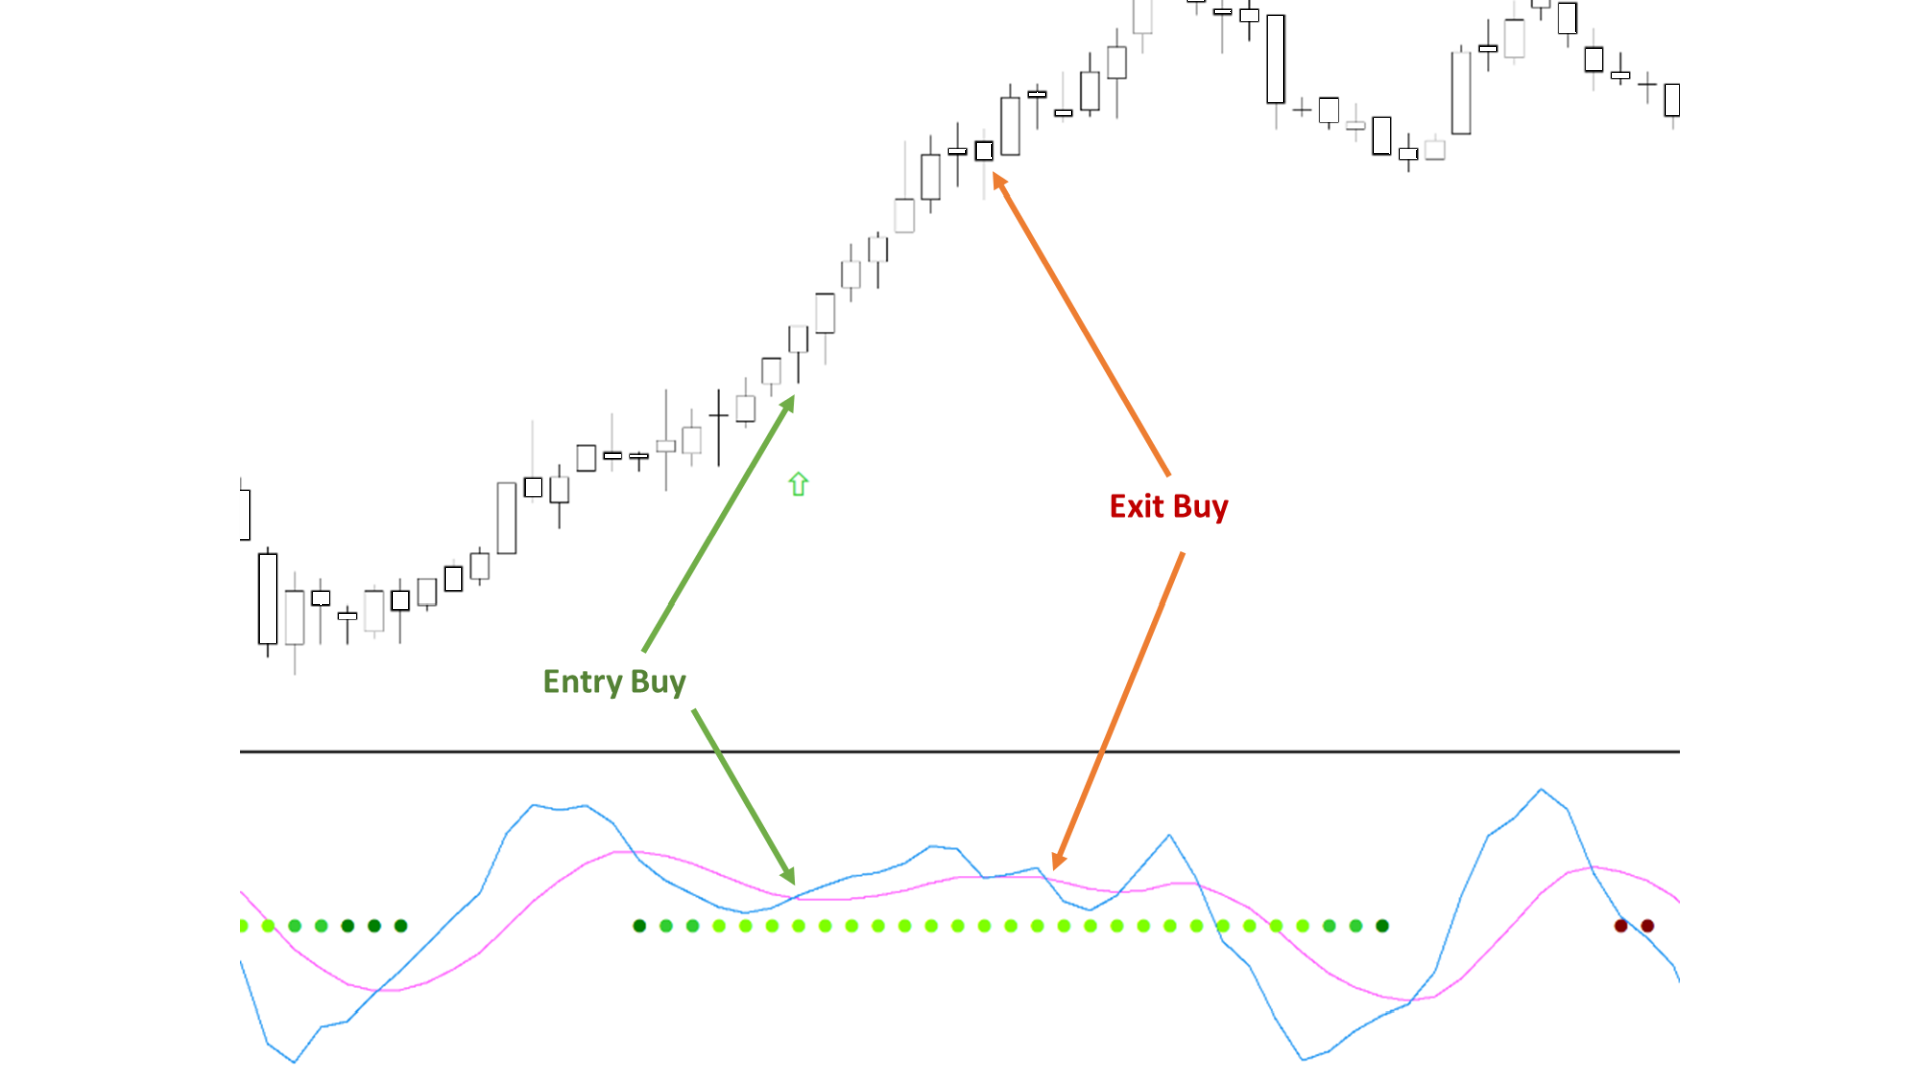
Buy
- Green dots indicate an up trend.
- Open a BUY position if the V-Line crosses the F-Line from below and an up trend is signaled (green dots)
- Close BUY position if V-Lines falls beneath F-Line again
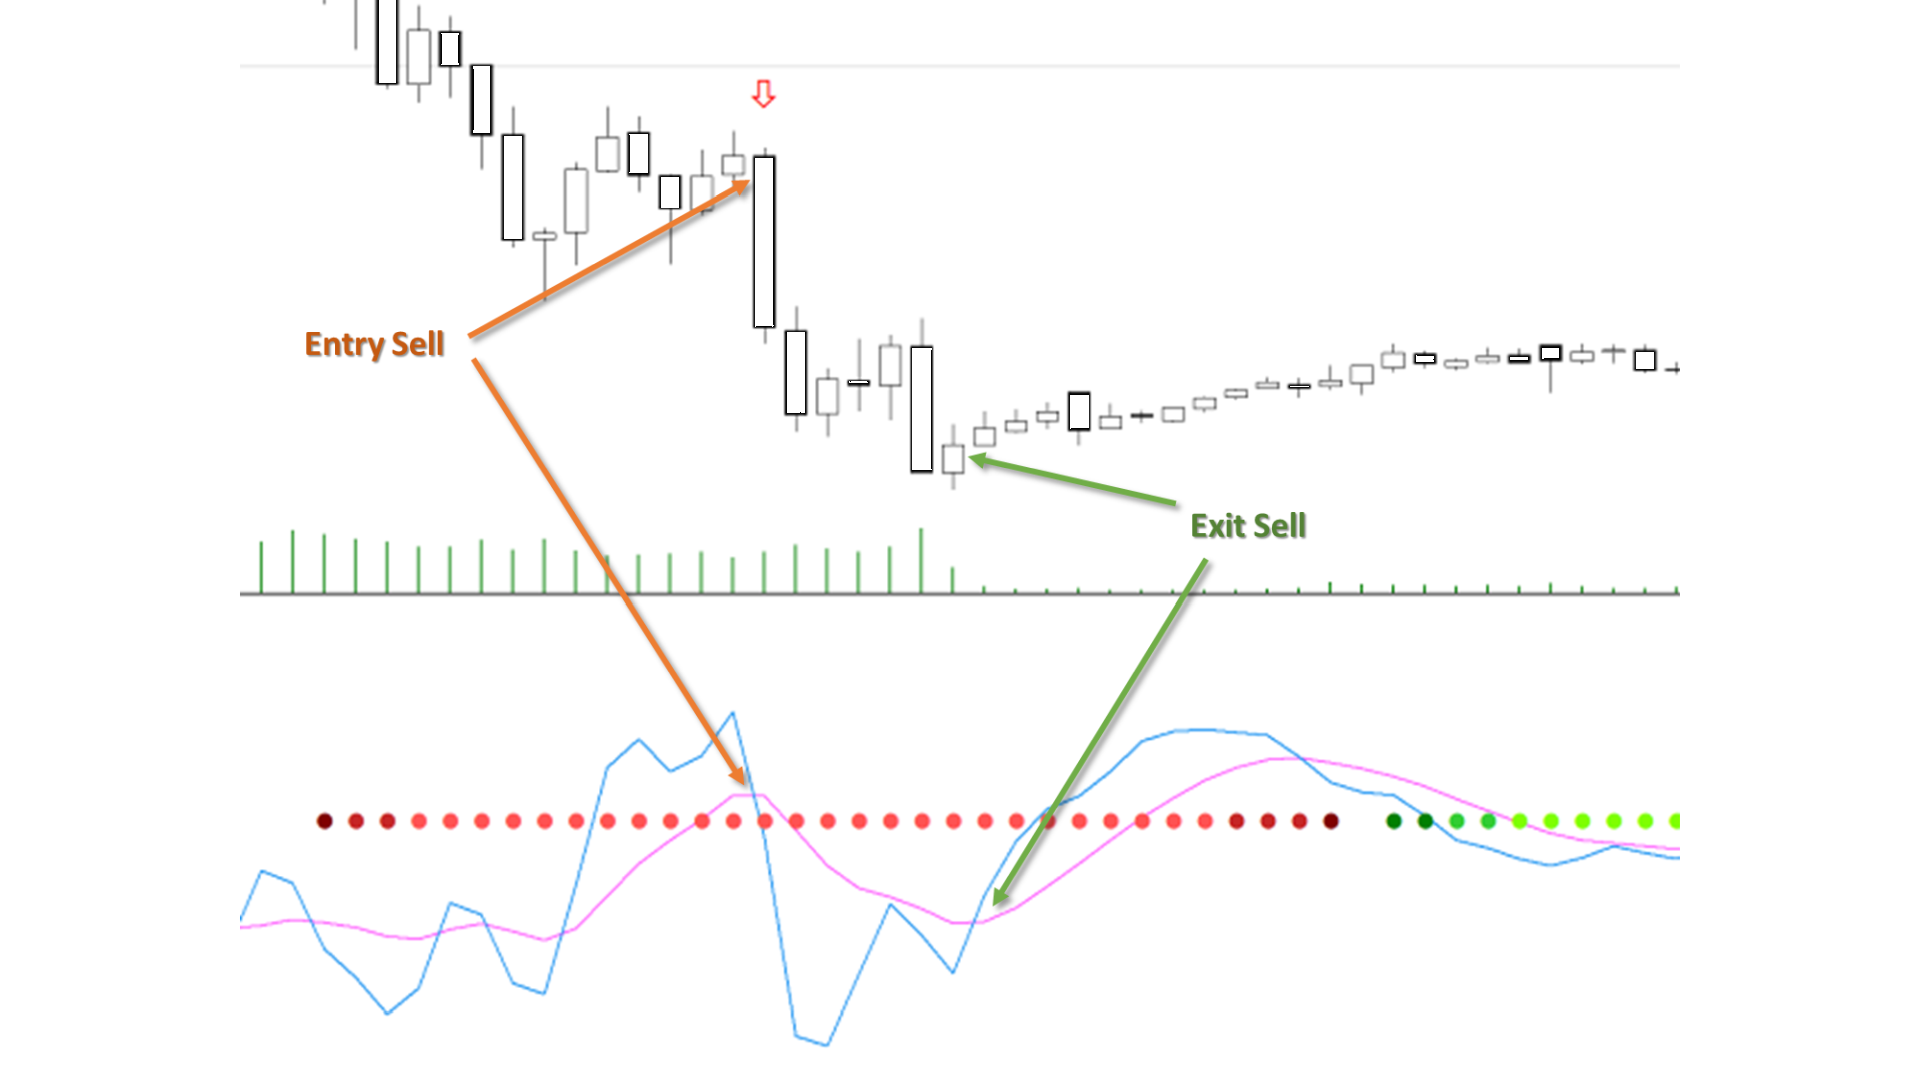
Sell
- Red dots indicate a down trend
- Open a sell position if V-Line falls below the F-Line and a down trend is signaled (red dots)
- Close sell position if V-Lines rises above F-Line again
Alerts
Serval alerts are included if a buy or sell signal occurs. I.e. Desktop alert, Mobil push alert, Email alert