Guarda i video tutorial del Market su YouTube
Come acquistare un Robot di Trading o un indicatore
Esegui il tuo EA
hosting virtuale
hosting virtuale
Prova un indicatore/robot di trading prima di acquistarlo
Vuoi guadagnare nel Market?
Come presentare un prodotto per venderlo con successo
Nuovi Expert Advisors e Indicatori per MetaTrader 5 - 142

Ottieni rendimenti eccezionali con un EA specifico per il bull run del Bitcoin, dotato di robusti backtest e supporto costante. Il concetto di BitcoinRIDER è quello di catturare questi movimenti parabolici e capitalizzare sulla volatilità e sui trend che definiscono i bull run. [ Guida all'installazione | Gruppo di supporto | Versione MT5 - MT4 ]
Dopo l'acquisto, inviaci un messaggio privato per ricevere il secondo setfile.
La strategia alla base BitcoinRIDER utilizza una strategia momentum co

Revert Edge è un algoritmo attentamente elaborato basato su oltre 7 anni di esperienza di trading live. Il suo obiettivo principale è la crescita lenta e costante dell'account con un'enfasi sulle prestazioni a lungo termine e non sui guadagni rapidi, insostenibili e a breve termine. L'EA è sviluppato per negoziare più valute come AUDCAD, AUDNZD, AUDUSD, EURUSD, EURAUD e altro ancora! Utilizza una strategia di mean reversion e sfrutta i livelli di prezzo che sono sensibili a un qualche tipo di re

Soutien et résistance Omega Un indicateur unique pour les stratégies d'achat bas et de vente élevée Entrées de type inversion, à mesure que le prix monte jusqu'à la ligne complète, attendez-vous à ce que le prix tourne/balance/inverse Peut échanger des graphiques de 1 à 5 minutes avec 4 heures pour les configurations interjournalières ou m15 et plus avec quotidiennement, 1 heure avec hebdomadaire pour les configurations à long terme Prédicteur de prix futur de haute précision pour le haut ou le
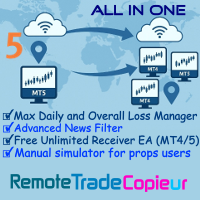
Remote Trade Copier is an advanced tool designed for efficiently copying trades between accounts in both local and remote modes. It allows for lightning-fast order replication from a master account to a slave account. In local mode, trades are copied instantly, while in remote mode, the copying process takes less than 1 second. MT4 Version (Only Local)
MT5 Version (Only Local)
MT4 Full Version (Local & Remote) Local mode refers to both MetaTrader platforms being installed on the same system,

Immergiti nell'entusiasmante mondo del trading manuale e scopri le illimitate possibilità che ti attendono. Con la tua esperienza e la tua sensibilità per il mercato, puoi ottenere un successo straordinario e far crescere continuamente il tuo portafoglio. Il trading manuale ti consente di assumere il controllo delle tue strategie e decisioni e di avere un'influenza diretta sulle tue attività di trading. Attraverso la tua conoscenza approfondita dei mercati e la comprensione dei vari strumenti d
FREE

Migliora la tua strategia di trading con il Big Candle Scanner Dashboard MT5, un dashboard multi-asset versatile progettato per rilevare candele rialziste e ribassiste sovradimensionate su numerosi pair di valute e timeframe, segnalando potenziali spostamenti di momentum o picchi di volatilità. Radicato in tecniche classiche di analisi candlestick popolari da trader come Steve Nison negli anni '90 attraverso il suo lavoro sui grafici candlestick giapponesi, questo tool è diventato un elemento es

L'EA (Expert Advisor) apre una posizione quando il mercato inizia a muoversi durante la sessione di New York (volume più alto). In questo modo, il momentum viene mantenuto dal volume e possiamo raggiungere il Take Profit con alta probabilità in modo immediato. Segnale https://www.mql5.com/en/blogs/post/764450
Entrata basata sul momentum durante la sessione di New York L'EA rileva l'impulso nascosto attraverso gli FVG (Fair Value Gaps) su timeframe inferiori. Quando l'impulso viene rilevato poc

risultato in tempo reale:
OFFERTA A TEMPO LIMITATO: Ottieni il miglior affare prima che il prezzo aumenti! Prezzo finale: 990$ Incontra il Cambiatore del Gioco: Precision FX Immagina un EA che fa più che semplicemente eseguire operazioni: gestisce strategicamente ogni ordine per un migliore controllo del rischio. Precision FX è progettato per eccellere in mercati volatili, adattandosi rapidamente ai movimenti di prezzo. Presenta un approccio unico in cui suddivide ogni posizione in più ordini

Ti sei mai chiesto se esiste un bot di trading che potrebbe fare trading per te, alle tue esatte condizioni di entrata e uscita? Beh, non preoccuparti, Pebble è qui!
Imposta semplicemente i tuoi parametri di trading nel pannello di trading RSI e premi "Inizia a fare trading" e il gioco è fatto! Pebble si occuperà del resto.
Ecco alcuni vantaggi dell'utilizzo di Pebble:-
Rimuove le emozioni umane dal trading. Attivo 24 ore su 24, 7 giorni su 7 e cerca le tue condizioni di trading. Inserisce a
FREE

Conquista il mercato EURUSD con Aetheria Opera in modo più intelligente, non più difficile! Aetheria è un Expert Advisor (EA) completamente automatizzato, progettato per dominare il mercato EURUSD con precisione, velocità e controllo. Identifica configurazioni di trade redditizie utilizzando pattern di engulfing combinati con la conferma della tendenza, garantendo l'esecuzione solo di trade ad alta probabilità. Perché i trader amano Aetheria Ingressi precisi — Rilevamento dei pattern di engulfi

Channel: https://www.mql5.com/en/channels/juliarealtrading
How to run: https://www.mql5.com/en/blogs/post/751646 Per un tempo limitato, prendi la tua copia di Algo Swift EA a un prezzo scontato ! Con solo un grafico e una configurazione minima, puoi iniziare a fare trading in modo più intelligente e veloce che mai.
Entra nel futuro del trading automatizzato con Algo Swift EA, un EA rivoluzionario progettato per precisione e prestazioni. Questo EA non è il tuo tipico bot di trading: è il tuo

```html Trade Focus identifica le crocette delle medie mobili veloci e lente, assicurandoti di capitalizzare sui cambiamenti di tendenza e di direzione del mercato. Con input minimi, ti aiuta a cogliere rapidamente i primi cambiamenti di tendenza in modo efficiente.
Trade Focus è progettato per i trader che mirano a raggiungere obiettivi di trading specifici, specialmente in ambienti difficili come le aziende prop . Offre strumenti strategici come obiettivi giornalieri di profitto e perdita e i

[Channel for news and updates] , [Guide on how to run EA]
Il EA opera con intelligenza artificiale avanzata e apprendimento automatico, adattandosi costantemente alle condizioni di mercato in tempo reale. Con analisi di dati storici ed esecuzione in tempo reale, Dynamic Edge garantisce di rimanere un passo avanti rispetto al mercato e di cogliere le migliori opportunità man mano che si presentano.
Per i trader che preferiscono un profitto garantito, Dynamic Edge include una funzione di zon

TradeLogic Pro – L'EA MT5 avanzato per rilevare gli squilibri di prezzo
TradeLogic Pro è un Expert Advisor (EA) MetaTrader 5 avanzato progettato per sfruttare la potenza degli squilibri di prezzo nei mercati di trading forex. Che tu sia un principiante o un trader professionista, TradeLogic Pro utilizza un'analisi di mercato sofisticata per identificare punti di ingresso ad alto potenziale, consentendoti di fare trading in modo più intelligente ed efficiente.
Come funziona TradeLogic Pro?
Al

GoldMaster EA per il trading di XAU/USD su MetaTrader 5
Il GoldMaster EA è uno strumento di trading completamente automatizzato progettato per il trading di XAU/USD (oro) sulla piattaforma MetaTrader 5. È pensato per i trader che preferiscono un approccio semplice e vogliono esplorare il trading automatico senza configurazioni complesse. Caratteristiche: Trading automatico: L’EA gestisce tutte le operazioni di trading in modo indipendente. Configurazione preimpostata: Non è necessaria alcuna c

Sblocca il Potere di Chart Sense EA Chart Sense EA non è solo un altro strumento di trading: è una soluzione sofisticata progettata per navigare le complessità dei mercati finanziari. Integrando logiche di trading avanzate con una gestione degli ordini robusta, offre un modo più intelligente per fare trading. Che tu sia un principiante o un trader esperto, questo EA si adatta al tuo stile, fornendo controllo e flessibilità. Caratteristiche Principali: Strategia Avanzata Guidata da IA: Utilizza

Presentazione del VXN Indicator
Codice sconto del 25% su Darwinex Zero: DWZ2328770MGM Il tuo alleato definitivo per navigare nelle acque volatili dell'indice Nasdaq-100. Progettato per i trader che esigono precisione e affidabilità, il VXN Indicator fornisce approfondimenti in tempo reale sul sentiment del mercato e sui potenziali movimenti dei prezzi. Con il VXN Indicator, puoi: Prevedere la Volatilità : Ottieni un vantaggio competitivo anticipando con precisione i movimenti del mercato. Otti
FREE
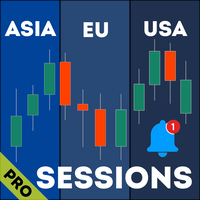
Haven Market Session Time PRO – your reliable assistant for market session and news analysis. This compact indicator keeps you informed about key trading sessions and important news events directly on the chart. Customize the display of the sessions you need – Asia, London, US, and other regions. The indicator automatically highlights activity periods, showing the start and end times of each session. You'll receive alerts about upcoming high-impact economic calendar events. A convenient panel in
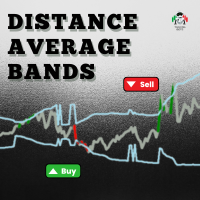
A very assertive and easy-to-view indicator, which can be used in any financial asset.
This indicator aims to show moments when the average price deviation in relation to the average deviation exceeds the configured standard deviation.
Step 1: We measure the distance between the price and the average configured in the "MAPrice" parameter;
Step 2: We calculate the average "MADistancePeriod" of the distances measured in Step 1.
Step 3: We calculate the standard deviation "Deviation" from th

NtickChart-BVcandle Features This is a free version with limited functionality.
This is a tick chart indicator that displays in a sub-window. Inspired by Bob Volman's (BV) scalping method, it is designed as a tool for achieving simple and effective trading. It is a tick chart specifically for day trading and scalping, focusing even on 1 pipette changes. Instead of time-based candle bars, it generates candle bars for a specified number of ticks (ticks_in_candle). This allows for a more detailed
FREE

Bullish EA v1.11 – A clean, powerful, and disciplined Gold-only trading robot for MetaTrader 5 (Author: Lungile Mbanjwa – built with help from ChatGPT & Grok) This EA was created from day one to trade XAUUSD (Gold) only and is used by the author himself every day with these exact settings: Signal timeframe: M5 (fast crossover detection) Trend filter timeframe: M30 (strong trend confirmation via Stop-Filter MA) How it works: Buy when Short MA > Long MA > Stop MA on the selected timeframes Sell w
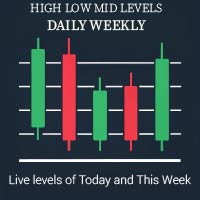
High Low Mid Daily Weekly Revolutionize Your Chart Analysis with Precision Levels! High Low Mid Daily Weekly is a powerful and intuitive indicator designed for traders seeking to elevate their technical analysis. This indispensable tool automatically plots the key price levels of the current day and week directly on your chart, ensuring you never miss crucial support and resistance zones. Key Features: Daily and Weekly Levels : Instantly displays today’s and this week’s High , Low , Mid levels

The Multi Position Expert Advisor (EA) is a powerful and flexible trading tool designed to open multiple trades simultaneously, allowing traders to manage several positions on a single chart. With customizable inputs, this EA provides precise control over trading parameters, including lot size, stop loss, take profit, and the number of positions to open. Key Features: Customizable Lot Size : Adjust the lot size for each trade to suit your risk management strategy. Stop Loss and Take Profit : Set
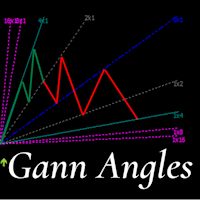
This indicator is, without a doubt, the best variation of the Gann Angles among others. It allows traders using Gann methods to automatically calculate the Gann angles for the traded instrument. The scale is automatically calculated when the indicator is attached to the chart. When switching timeframes, the indicator recalculates the scale for the current timeframe. Additionally, you can enter your own scales for the Gann angles. You can enter your own scales either for both vectors or for each

Overview In the fast-paced world of forex and financial markets, quick reactions and precise decision-making are crucial. However, the standard MetaTrader 5 terminal only supports a minimum of 1-minute charts, limiting traders' sensitivity to market fluctuations. To address this issue, we introduce the Second-Level Chart Candlestick Indicator , allowing you to effortlessly view and analyze market dynamics from 1 second to 30 seconds on a sub-chart. Key Features Support for Multiple Second-Level

Aetheris Quantum — AI-Powered Trading Solution Aetheris Quantum is a powerful trading bot designed to analyze market patterns using artificial intelligence technology. By continuously learning and adapting to changing market conditions, the bot ensures high-accuracy forecasts and effective trading even in challenging market environments. Unlike basic trading solutions, Aetheris Quantum offers customizable settings, allowing traders to tailor it to their unique trading strategies! Special Price:

Robô de Gradiente Linear para MT5 — Estratégia com Bandas VWAP O Robô de Gradiente Linear é o primeiro sistema brasileiro desenvolvido com base em Gradiente Linear aplicado às Bandas VWAP , voltado para operações automáticas no mini índice e no índice cheio da B3. Estratégia e funcionamento O robô identifica zonas de exaustão do preço, realizando operações de compra e venda nos pontos de maior probabilidade de reversão.
Sua gestão financeira segue parâmetros rigorosos para preservar o capital: S

Adaptive Reversal Star is a new generation indicator with an advanced Adaptive algorithm , which additionally tracks potential reversal points and compares the values of the current market volatility when forming the main signals of the indicator.It provides accurate signals in real time without delays and redraws.Adaptive Reversal Star does not require any complex settings and additional calculations, just set it to the desired timeframe and select the parameter - Signal Filter. Why choose

Fe el free to contact me for any extra features :) [SEE MT4 VERSION https://www.mql5.com/en/market/product/128848 ] The Local Copier EA is an Expert Advisor (EA) designed to synchronize trading positions between a master account and a slave account, operating in either Master or Slave mode. Key Features: Master Mode :
In Master mode , the EA monitors open positions and stores relevant trade details. These details include symbol, volume, stop loss, take profit, and position type, which are used

Feel free to contact me for any extra features or further assistance :)
[SEE MT4 VERSION https://www.mql5.com/en/market/product/128849 ] The Local Reverse Copier is an Expert Advisor designed to synchronize positions between a Master account and a Slave account with a twist: it reverses the trades. When a buy position is opened on the Master account, the EA opens a sell position on the Slave account, and vice versa. This allows for a unique form of trade copying where positions are mirrored in

This expert is under construction and is not yet completed
The development of this expert will be completed in 2 years at most.
Our goal in publishing this expert is to attract capital to develop our best expert.
This expert will definitely be the best expert of our team.
To participate in this project, you can buy this expert at the lowest possible price.
This expert will definitely be the most expensive expert of our team in the future.
This expert will be built with the latest methods and st
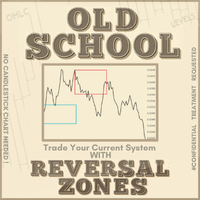
I'll keep it Short and to the point. Let Your Backtest Results Speak for Themselves. After much deliberation, we’ve decided to release the foundational logic behind our process for public use.
This isn’t about changing the way you trade—because we know that’s unique to you. The best ways to enter a position? Those have always been confidential ! What we can share is the first of three essential steps we use before entering any trade. This tool is designed to keep you on the right side of the m

The Pure Price Action ICT Tools indicator is designed for pure price action analysis, automatically identifying real-time market structures, liquidity levels, order & breaker blocks, and liquidity voids. Its unique feature lies in its exclusive reliance on price patterns, without being constrained by any user-defined inputs, ensuring a robust and objective analysis of market dynamics. Key Features Market Structures A Market Structure Shift, also known as a Change of Character (CHoCH), is a pivot

The Entry IQ Indicator is a technical analysis tool designed to assist traders in identifying potential entry points for long and short positions. It utilizes dynamic price boxes, equilibrium zones, and trend detection algorithms to analyze market trends and price movements. The indicator adapts to different broker price digit formats, provides customizable arrow signals, and plots real-time trendlines to refine signal accuracy. By assessing price action over a specific lookback period, Entry I
FREE

Introduction Welcome to the world of Forex trading, where every tick of the market can be influenced by news events. Introducing our expert advisor for MetaTrader, your ultimate tool for navigating the complexities of news trading. This innovative advisor is specifically designed to automate your trading strategy during key macroeconomic releases, ensuring you never miss an opportunity. When important indicators are announced, volatility often spikes, creating potential for profit. Our expert
FREE

Description The indicator based on Average True Range (ATR) is designed to accurately determine the possible range of price fluctuations on a selected timeframe. This tool is ideal for both beginner traders and experienced professionals looking to effectively plan their trades. Key Features: Displays possible price fluctuation levels on the chart, simplifying visual analysis. Utilizes the power of the ATR algorithm to calculate precise volatility values. Adapts to any timeframe, providing releva
FREE

Advanced Trading Chaos The main purpose of the indicator is to help the trader detect the signals described by Bill Williams in his books to make a quick and correct trading decision.
1)Bullish/Bearish Reversal Bar(BDB) 2) Divergent Bar(DB) 3) Second Sage Signal — the third consecutive Awesome Oscillator bar 4) Working fractals (Fractals that worked above/below the red forehead 5) Three bar coloring modes
5.1) Coloring of bars according to the AO indicator (Including the squatting bar)
5.2

Title: Powerful EA for GBP/USD | H1 Timeframe | Low-Risk Strategy Description: Overview:
This Expert Advisor (EA) is designed specifically for the GBP/USD currency pair on the 1-hour timeframe . It is optimized for $10,000 USD capital with a fixed lot size of 0.1 to ensure consistent and low-risk performance. Key Features: Currency Pair: GBP/USD Timeframe: 1 Hour (H1) Initial Capital: $10,000 USD Lot Size: 0.1 (Fixed Lot Size) Strategy: A robust algorithm that combines technical indicators for

Configurable Settings – Developed with user flexibility in mind. Allows adjusting lot size, risk parameters, and trading settings to match individual trading strategies. Risk Management Approach – Implements an algorithmic method to manage trading risks. Attempts to optimize lot size based on account balance, but users should understand that no risk management is foolproof. Spread Monitoring – Designed to track market conditions and potentially pause trading during unfavorable spread conditions

Introducing to your attention the unique trading advisor "Scaled Vidya Trends", designed for dynamic scalp trading on trend volatility pairs hour + timeframes.
Main features of Scaled Vidya Trends:
- Multi-level market analysis: it works on H1, H2, H3 timeframes; - Uses the most popular currency pairs: EURUSD, GBPUSD, USDCAD. Brokers usually set one of the lowest spreads for these pairs; - Applies a scalping method based on local targets for orders; - Works at the close of the timeframe, wait
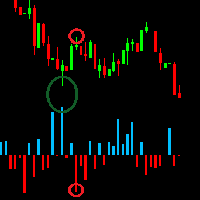
The Tick Volume Balance indicator is created based on the tick volumes of the instrument on the selected timeframe, taking into account the trading balance of supply and demand prices.
The indicator considers the nature of candle formation used in the Price Action strategy. With equal volume, a regular candle and a candle with a pattern will have a larger size and will be colored according to its pattern. I would like to note that large volume candles colored in bullish and bearish colors at t

Introducing to your attention the unique trading system/indicator "Scaled Vidya Trends", designed for dynamic scalp trading on trend volatility pairs hour + timeframes.
Main features of Scaled Vidya Trends:
-Multi-level market analysis: it works on H1, H2, H3 timeframes; -Uses the most popular currency pairs: EURUSD, GBPUSD, USDCAD. Brokers usually set one of the lowest spreads for these pairs; -Applies a scalping method based on local targets for signals; -Signals appears at the new open of

Title: Advanced XAUUSD Scalper EA Description:
This Expert Advisor (EA) is designed exclusively for trading XAUUSD (Gold) on the 15-minute timeframe . It incorporates advanced algorithms to identify optimal entry and exit points, ensuring precision and profitability. Features: Optimized for XAUUSD: Tailored to trade Gold for consistent performance. Timeframe: Specifically calibrated for the 15-minute chart. Lot Size: Default lot size is set to 0.01 for safer trading and better risk management.

The Easy Trend Trading Indicator delivers quick and accurate BUY/SELL signals, ensuring that traders can make timely decisions. It works flawlessly across various timeframes and supports all symbols, making it a versatile tool for any market. Whether you're trading short-term or long-term, this indicator adapts to your needs with ease. Quick Setup: Simply "Enable" the indicator via input settings With a low memory footprint, the indicator is designed for efficiency, ensuring smooth performance e

Indicator for Displaying Trade Results on the Chart This indicator is designed to visualize trading results directly on the chart, making it easier for traders to analyze their strategy and trade performance. It automatically displays all open, closed, and pending orders, along with additional information for convenient analysis. Features: Trade Visualization : Displays all entry and exit points on the chart with clear indications of direction (buy/sell). Profit/Loss Display : Each trade is anno
FREE

a script created with ChatGPT. It changes the symbol in every other chart window to the symbol of the window where you run the script. The story behind it. I use MT5 across 2 monitors. Same price/symbol, different candles. because changing the symbol in every window was tedious. So I had ChatGPT write this script. Important: this script only changes the symbol, everything else like indicators or objects is not transferred to other chart windows
FREE

This is a very simple backtesting tool. It starts from the most old chart in the past chart. It has 0.2pips spread, and you can do averaging 10 times. You can set the size of bars and the time frame as a parameter. You can't change the time frame during the backtest. These are the functions of buttons. ------------------------------------------------------------ Resume/Pause: Auto scroll stop and resume. Next bar: Showing candle sticks one by one. Speed1,2,3: The speed of auto scroll. Skip: ski
FREE

If you love this indicator, please leave a positive rating and comment, it will be a source of motivation to help me create more products <3 How to use Slope Direction Line Uptrend: When the SDL line slopes up and turns from red to green, it shows that the price is trending up. This is also considered a buy signal. Downtrend: When the SDL line slopes down and turns from green to red, it shows that the price is trending down. This is also considered a sell signal. Sideways: When the SDL line mo
FREE

This simple Expert Advisor (EA) provides a real-time count of the number of open positions for the current currency pair in your trading account. Features: Real-time Position Count: Accurately tracks and displays the number of open positions for the current symbol on the chart. Reliable and Efficient: Employs a robust and efficient algorithm to count positions. Easy to Use: No input parameters required. Simply attach the EA to any chart of the desired currency pair. Compact and Lightweight: Mini
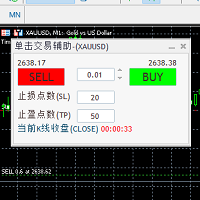
Comes with a one click order trading shortcut key and a trading panel that counts down the closing time of the candlestick in seconds. The take profit and stop loss points can be set in the panel; The displayed countdown seconds are the closing countdown time of the current candlestick in the chart cycle; A trading panel with built-in one click order trading shortcut key and K-line closing time countdown seconds
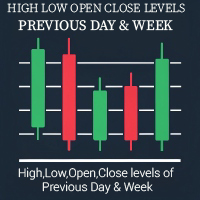
Revolutionize Your Chart Analysis with "Previous Daily Weekly HLOC Levels"! The Previous Daily Weekly HLOC Levels indicator is a must-have tool for traders who want to sharpen their technical analysis. This intuitive and powerful indicator automatically plots the High, Low, Open, and Close levels of the previous day and week on your chart, giving you a clear view of critical support and resistance zones. Key Features: Daily and Weekly Levels: Effortlessly displays the High, Low, Open, and Clos
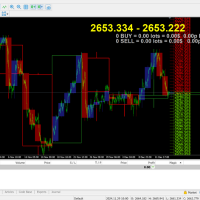
Multi TimeFrame Candle Indicator Description:
Tired of switching between charts to analyze multiple timeframes? The Multi TimeFrame Candle Indicator solves this problem by displaying candlestick data from any higher time frame directly on your current chart. Gain a broader market context and make more informed trading decisions without the clutter. Key Features: View Any Timeframe: Easily display candles from any larger time period (e.g., see H1 candles on your M15 chart). Customizable Appeara

This is an EA (Expert Advisor) designed to support manual and automatic order closing. Main Features: Automatically adjust Stop Loss (SL) and Take Profit (TP) for all buy and sell orders based on the specified points. Automatically close buy or sell orders when the specified profit level is reached. Automatically close all buy and sell orders when their total profit reaches the desired level. Can be closed manually: Buy orders, Sell orders, Close all with buttons Display the average price of buy
FREE
This EA performs well in sideways markets.
The above results are based on the default setup for the pairs GU, NU, and AC, which perform well during sideways market conditions. For other market phases with stronger trends, you should backtest and adjust the setup accordingly. The default setup works well for pairs with lower volatility such as EU, NU, AU, GU, AC, NC, and EG during low-volatility market conditions. Key Parameters to Note: Step Point Buy: Distance between buy orders. Step Point Se
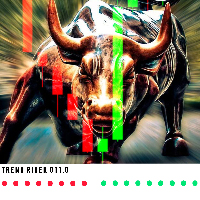
This is an indicator to assist a trader on trend detection of any market. This indicator is made up of a blend of moving averages for trend detection. I know no indicator is 100% accurate , but this might help you. I'm giving it for free and also , there are important settings on the last screenshot. This indicator should be on a separate window after you set it up on the chart.
FREE

This is an EA (Expert Advisor) supporting Trailing Stop. Key Parameters: Trailstart (Point): The starting point of trailing from the average price of buy or sell orders. Trailstep (Point): The Trailing Step value. Comm (Point): Commission fee per lot for the account, typically calculated in USD. However, you need to convert it into points. For example, if the EU pair's commission per lot is $7, you convert it to 7 points. Times to modify real StopLoss (seconds): The time interval for modifying
FREE

Detailed Explanation of Using the Indicator for Bitcoin Trading 1. Understanding the Indicator The indicator uses moving averages and ATR (Average True Range) to detect trends and generate buy/sell signals. This is similar to Trade Sniper except designed for BTC 2. Setting Periods for Different Time Frames Configure the indicator with periods suitable for each time frame. Here’s a suggested table for periods and ATR-based stoploss/take profit settings: Time Frame PERIOD Stoploss Take Profit 1

Raziel EA is a versatile and robust Expert Advisor designed to combine the power of multiple strategies and advanced risk management features. By leveraging moving averages for trend identification, Raziel EA adapts seamlessly to varying market conditions, offering traders precision and flexibility. With integrated trend filters, time filters, and adjustable trailing stops, this EA ensures controlled and informed trading decisions. Soon will have more updates to not only improve the strategies b

The ATR Trade System is a sophisticated trading tool designed for active traders seeking precise entry and exit points based on market volatility. This system combines adaptive trend identification with dynamic support and resistance levels, making it suitable for any trading instrument and timeframe. Key Features: Adaptive trend detection with color-coded signals Multiple volatility modes (Tight to FOMC) for different market conditions Higher timeframe trend analysis for better context Customiz

EMA SignalLine Pro EA Optimize Your Strategy: Your Trading, Your Way! The EMA SignalLine Pro EA is a dynamic, flexible trading tool designed to help traders capture trend momentum with precision. This EA is not pre-optimized, giving you full control to adapt it to your trading needs. Whether you’re a novice or an experienced trader, this EA empowers you to tweak, optimize, and master your strategy. Key Features and Logic Explained EMA Crossover Logic: Utilizes a dual EMA system (Fast and Slow)

EMA MultiFlex EA – Your Path to Trading Excellence! Take control of your trading strategy and optimize it your way! Why EMA MultiFlex EA?
This Expert Advisor (EA) is designed with flexibility and performance in mind, empowering YOU to become the architect of your trading success. Priced at just $65, this EA is perfect for traders who enjoy testing, optimizing, and mastering unique strategies. Important Note
The EA comes with a solid framework but is not pre-optimized. It's a tool created for tr

Introducing EMATrendForce: The Powerful EMA Trend Strategy EA Are you looking to take your trading to the next level? Look no further! The EMATrendForce EA is designed to help you harness the power of Exponential Moving Averages (EMA) with a dynamic trend-following strategy. Priced at only $65, this EA provides you with a solid foundation to optimize your trading strategy and make informed decisions in the market. Key Features: Fast and Slow EMA Strategy: The EA utilizes two EMAs (Fast and Slow

Welcome to the World of Precision Trading! CrossPulse EA is crafted with detailed trading logic to empower you, the trader, with a dynamic and customizable tool. Priced at just $65, this EA is designed for those who wish to refine and optimize trading strategies on their own. Please note, CrossPulse is not pre-optimized—it is built to offer a foundation for your optimization, giving you full control of the strategy. Why Choose CrossPulse?
CrossPulse employs a two-pronged strategy using MACD and

SignalProDivergence EA – Your Gateway to Customizable Trading Success!
Welcome to SignalProDivergence, an innovative Expert Advisor designed to empower traders with a robust foundation for optimized trading strategies. This EA is created with flexibility in mind, enabling you to fine-tune and customize it according to your preferences. SignalProDivergence is not pre-optimized, offering you the opportunity to unleash its full potential by tailoring it to your specific trading goals and market co

Visual EMA CrossPro - Your Ultimate Trading Companion! Are you ready to enhance your trading strategy with a powerful yet easy-to-use tool? Introducing the Visual EMA CrossPro, an intelligent indicator designed to help traders identify precise market entry and exit points based on EMA crossovers. For just $65, you get access to a reliable solution to simplify your trading journey. How It Works:
The Visual EMA CrossPro leverages two key EMAs (Exponential Moving Averages) to identify trends and p

The Visual EMA MultiFlex Indicator is designed to enhance your decision-making by combining the power of three Exponential Moving Averages (EMAs). Whether you're a beginner or an experienced trader, this tool helps identify precise market entries and exits. How It Works:
The Visual EMA MultiFlex Indicator leverages Short, Medium, and Long EMAs to analyze market momentum and confirm trend direction: Short EMA – Captures quick market shifts. Medium EMA – Smooths out short-term fluctuations. Long

The Visual EMA PriceSync Indicator is a cutting-edge trading tool designed to synchronize price action with EMA (Exponential Moving Average) trends. It helps you identify precise market entry and exit points, making it an essential tool for any trader. What does it do?
The indicator detects crossover signals between the price and EMA, which signify potential trend reversals or market corrections. These signals are displayed directly on your chart with clear and vibrant buy (lime green) and sell

The Visual EMA ReversalScout Indicator combines a powerful EMA crossover strategy with RSI-based divergence detection to generate reliable buy and sell signals. Its advanced logic ensures robust and actionable market insights while maintaining flexibility for optimization. Strategy Breakdown EMA Crossovers: Uses Fast EMA and Slow EMA to identify trend directions and reversals. Bullish signals arise when the Fast EMA crosses above the Slow EMA, indicating an uptrend. Bearish signals occur when t

Visual EMA SignalLine Pro – Your Ultimate Trading Companion Experience a smarter, more precise approach to trading with Visual EMA SignalLine Pro! This powerful indicator simplifies complex market analysis, allowing you to focus on what matters most: profitable trading decisions. Available now for just $65, this tool is your gateway to mastering trends, identifying entry and exit points, and managing trades like a pro. How Does It Work?
The Visual EMA SignalLine Pro combines the power of Expone

VisualEMA TrendForce Indicator — Empower Your Trading with Precision Price: $65
Discover a Smarter Way to Trade with EMAs! The VisualEMA TrendForce Indicator is designed to elevate your trading with a reliable and visually intuitive trend-following system. Leveraging the power of Exponential Moving Averages (EMAs), this indicator provides actionable buy and sell signals based on dynamic market conditions, enabling traders to capture profitable trends with confidence. Core Features: Dynamic EMA
Il MetaTrader Market è un sito semplice e pratico dove gli sviluppatori possono vendere le loro applicazioni di trading.
Ti aiuteremo a pubblicare il tuo prodotto e ti spiegheremo come prepararne la descrizione per il Market. Tutte le applicazioni sul Market sono protette da crittografia e possono essere eseguite solo sul computer dell'acquirente. La copia illegale è impossibile.
Ti stai perdendo delle opportunità di trading:
- App di trading gratuite
- Oltre 8.000 segnali per il copy trading
- Notizie economiche per esplorare i mercati finanziari
Registrazione
Accedi
Se non hai un account, registrati
Consenti l'uso dei cookie per accedere al sito MQL5.com.
Abilita le impostazioni necessarie nel browser, altrimenti non sarà possibile accedere.