Guarda i video tutorial del Market su YouTube
Come acquistare un Robot di Trading o un indicatore
Esegui il tuo EA
hosting virtuale
hosting virtuale
Prova un indicatore/robot di trading prima di acquistarlo
Vuoi guadagnare nel Market?
Come presentare un prodotto per venderlo con successo
Indicatori tecnici gratuiti per MetaTrader 5 - 4
YouTube Channel: https://www.youtube.com/@trenddaytrader FREE EA for GOLD , Anticipation can be found here: https://www.mql5.com/en/market/product/123143
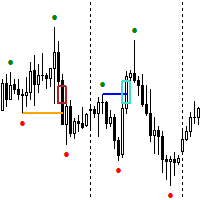
The Expert Advisor for this Indicator can be found here: https://www.mql5.com/en/market/product/115476 The Break of Structure (BoS) and Change of Character indicator with Fair Value Gap (FVG) filter is a specialized tool designed to enhance trading strategies by pinpointing high-probability trading opportunities on price charts. By
FREE

Pips Hunter PRO è stato sviluppato nel corso di diversi anni ed è una versione migliorata del suo predecessore. Questo potente indicatore analizza il mercato e la storia dei prezzi per generare entrate in acquisto e in vendita. Per il calcolo di queste entrate utilizza diversi indicatori che lavorano insieme, nonché un complesso logaritmo statistico che filtra le entrate meno favorevoli e le elimina / versione MT4 .
Caratteristiche Nessuna riverniciatura
Questo indicatore non cambia i suo
FREE
AI ChartPattern Pro
AI ChartPattern Pro è un indicatore ad alta precisione progettato per aiutare i trader a identificare oggettivamente pattern grafici avanzati, senza pregiudizi o manipolazioni. La versione 1.0 include due potenti pattern: l’Onda di Wolfe e la figura Testa e Spalle. Questo indicatore non si limita a mostrare i pattern, ma fornisce segnali operativi: Prezzo di ingresso Stop Loss (SL) Take Profit 1 (TP1) Take Profit 2 (TP2) Tutto questo con un’impostazione minima da parte dell’
FREE
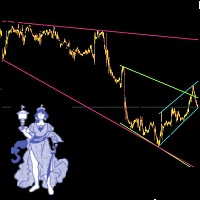
Leave a comment if you would like me to write an EA to trade these trendlines... if enough interest, will write an EA. Automatic Trendlines, updated automatically. To Set up 3 different (or mroe) Trendlines on chart, simply load the indicator as many times and name it differntly.. the example in the picture below is indicator 1 (loaded 1st time): Name: Long, StartBar: 50, BarCount: 500, Color: Pink indicator 2 (loaded 2nd time): Name: Short, StartBar: 20, BarCount: 200, Color: Green indicator 3
FREE
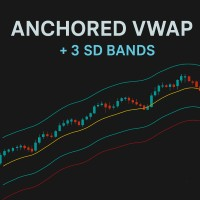
Anchored VWAP (AVWAP) con Bande di Deviazione Standard – MT5 Eleva la precisione del tuo trading con AVWAP arricchito da bande dinamiche di deviazione standard . Progettato per trader che cercano velocità, chiarezza e informazioni operative , questo indicatore porta l’analisi VWAP di livello professionale direttamente sui tuoi grafici MT5, aiutandoti a identificare rapidamente livelli chiave e opportunità ad alta probabilità. Funzionalità principali Molteplici ancoraggi: Aggiungi tutte le linee
FREE

If you like this free tool, check out my EA which is currently on a Launch Sale for only $39 ! https://www.mql5.com/zh/market/product/159451?source=Site Short Description: A specialized technical indicator designed for Gold (XAUUSD) trading. It automatically identifies market swings, plots key 0.382 and 0.618 Fibonacci retracement levels, and sen mobile push nothiations not sat 面紙 面 面 面面 筆/內托are detected. 【Key Features】 Dual Monitoring Mode: Simultaneously tracks the 0.382 (Shallow Retracement)
FREE

HiperCube AutoTrend Lines Codice sconto del 20% su Darwinex Zero: DWZ2328770MGM_20 Questo indicatore ti aiuta a identificare facilmente supporti e resistenze, tracciare linee nel grafico e sapere dove si trova un punto importante nel mercato. Questo strumento è il modo migliore per automatizzare in modo semi automatico il tuo trading, svolgendo parte del lavoro per te. Resistenza o supporto sono livelli importanti che a volte sono difficili da identificare, ma ora non ti creeranno più confusion
FREE

To get access to MT4 version please click https://www.mql5.com/en/market/product/130055  ; - This is the exact conversion from TradingView: "Ut Alart Bot Indicator". - You can message in private chat for further changes you need. Here is the source code of a simple Expert Advisor operating based on signals from Ut Bot Indicator . #property copyright "This EA is only education purpose only use it ur own risk" #property link " https://sites.google.com/view/automationfx/home " #property versio
FREE
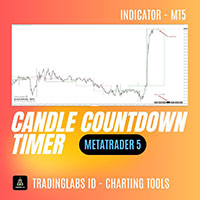
Candle Timer Countdown (CTC) – Minimalist & Precise Candle Timer Candle Timer Countdown (CTC) is a lightweight and non-intrusive MetaTrader indicator that displays the remaining time of the current candlestick on your chart. Designed with simplicity and clarity in mind, this tool helps traders stay aware of candle closures without cluttering the chart. Key Features: Real-Time Candle Countdown
Always know how many seconds are left before the current candle closes – works on all timeframes. Minima
FREE
Day Direction Scanner è un indicatore che utilizza la direzione della candela corrente nei periodi di 1 giorno, 4 ore, 1 ora, 15 minuti e 5 minuti per determinare la direzione del mercato. Quando tutte le candele convergono in un'unica direzione, l'indicatore indica se la giornata è rialzista o ribassista, o se non c'è una direzione chiara. È utile per farsi un'idea della direzione del mercato durante la giornata.
Caratteristiche:
- Funziona su tutte le coppie di valute, indici e materie pri
FREE
Assistente intelligente per ingressi di mercato accurati e tempestivi. L'indicatore emette un segnale acustico e avvisi quando il prezzo raggiunge i livelli. Puoi impostare manualmente i livelli di supporto e resistenza o affidarlo a un algoritmo. Nel momento in cui il prezzo raggiunge il livello, vengono inoltre contrassegnati i modelli di candele. I modelli di candele unici sono una simbiosi dei modelli classici e dei modelli di rottura e sospensione dei livelli. Per il trading altamente reddi
FREE

Stochastic MTF Dashboard Lo Stochastic MTF Dashboard è una soluzione visiva progettata per massimizzare l'efficienza operativa. Ti permette di monitorare lo stato dell'oscillatore stocastico su un massimo di 6 diversi intervalli temporali (timeframe) simultaneamente, il tutto senza dover cambiare il grafico corrente. Il suo obiettivo è eliminare la confusione e offrirti una lettura istantanea della forza del mercato: Rosso: Zona di Ipercomprato: Possibile esaurimento del prezzo (Opportunità di v
FREE

Magic Trend Indicator MT5 is an easy to use 100% Non-Repaint Forex System. It is an arrow Indicator which is designed for ALL time frames.
The Indicator can be used as a standalone system for scalping on M1 time frame or for long-term at H4 and it can be used as a part of our existing Golden Birds EA MT5 .
Magic Trend Indicator is fully non-repaint, meaning that its signals do not change or disappear after the candle closes—what you see is what you get. This provides traders with a reliable
FREE

Volumes with Moving Average è un indicatore di volume semplice e diretto integrato con una media mobile.
Come si usa?
È adatto per filtrare i segnali di entrata in un'operazione sia dai livelli di supporto/resistenza sia al breakout della volatilità dei canali di tendenza. Può anche essere un segnale per chiudere una posizione in base al volume.
Parametri di ingresso:
Volumi - volume reale o tick. MA_period - periodo della media mobile.
FREE

Market Profile 3 MetaTrader 5 indicator version 4.70— is a classic Market Profile implementation that can show the price density over time, outlining the most important price levels, value area, and control value of a given trading session. This indicator can be attached to timeframes between M1 and D1 and will show the Market Profile for daily, weekly, monthly, or even intraday sessions. Lower timeframes offer higher precision. Higher timeframes are recommended for better visibility. It is als
FREE
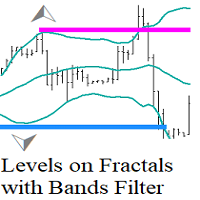
Levels on Fractals with Bands Filter questi sono livelli basati su frattali filtrati con l'indicatore Bollinger Bands.
Il Levels on Fractals with Bollinger Bands Filter è uno strumento di analisi tecnica che utilizza una combinazione di frattali e l'indicatore Bollinger Bands per identificare i livelli di supporto e resistenza.
Come si usa.
Quando un frattale si forma dietro la banda di Bollinger esterna (breakout della volatilità) indica che il prezzo ha raggiunto un livello estremo e potr
FREE

Trend-Based Trading Assistant PRO is a professional-grade Smart Money Concepts (SMC) and Price Action toolkit designed for MT5. It automates the detection of essential market structure shifts, allowing traders to identify high-probability trend reversals and continuation patterns without manual charting. By combining institutional-level logic with a powerful EMA trend filter, this indicator helps you stay on the right side of the market while avoiding "noise" and false signals. Core Features: A
FREE

NOTE: Turn Pattern Scan ON
This indicator identifies Swing Points, Break of Structure (BoS), Change of Character (CHoCH), Contraction and Expansion patterns which are plotted on the charts It also comes with Alerts & Mobile notifications so that you do not miss any trades. It can be used on all trading instruments and on all timeframes. The non-repaint feature makes it particularly useful in backtesting and developing profitable trading models. The depth can be adjusted to filter swing points.
FREE

The SuperTrend Strategy is a widely-used technical indicator based on the Average True Range (ATR), primarily employed as a trailing stop tool to identify prevailing market trends. The indicator is designed for ease of use while providing reliable insights into the current market trend. It operates based on two key parameters: the period and the multiplier . By default, it uses a period of 15 for the ATR calculation and a multiplier of 3 . The Average True Range (ATR) plays a crucial role in th
FREE
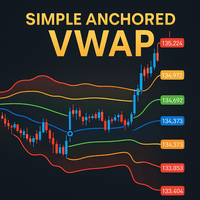
Simple Anchored VWAP is a lightweight yet powerful tool designed for traders who want precise volume-weighted levels without complexity.
This indicator lets you anchor VWAP from any point on the chart and instantly see how price reacts around institutional volume zones. MT4 Version - https://www.mql5.com/en/market/product/155320
Join To Learn Market Depth - https://www.mql5.com/en/channels/suvashishfx Using VWAP bands and dynamic levels, the tool helps you understand where real buying and s
FREE

Smart Money Breakout Channels Indicator
The Smart Money Breakout Channels indicator is a powerful technical analysis tool designed to identify potential breakout opportunities in financial markets by detecting consolidation channels based on price volatility. Built for MetaTrader 5 (MT5), it overlays dynamic channels on the price chart, highlighting areas of low volatility that often precede significant price movements. This indicator is inspired by smart money concepts, focusing on institution
FREE

Introducing the MACD Enhanced – an advanced MACD (Moving Average Convergence Divergence) indicator that provides traders with extended capabilities for trend and momentum analysis in financial markets. The indicator uses the difference between the fast and slow exponential moving averages to determine momentum, direction, and strength of the trend, creating clear visual signals for potential entry and exit points. Attention! To achieve the best results, it is recommended to adapt the indicator
FREE
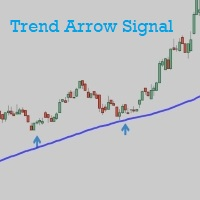
Trend Arrow Signal gives buy/sell signals and alerts with up and down arrow at potential reversal of a pullback or a trend continuation pattern. As the name indicated, this is an indicator which gives signals based on trend => It works best in trend market with the principle is to ride on the trend not trade against the trend. The main trend is determined by EMA 50 and can be changed manually to suit your preference. Trend arrow signal can work on all time frames. It gives signal at close of th
FREE
Versione Expert Advisor Se preferisci il trading automatico invece dei segnali manuali, puoi trovare la versione Expert Advisor di questo indicatore qui: https://www.mql5.com/en/market/product/148310
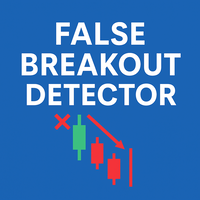
False Breakout Detector è un indicatore progettato per individuare situazioni in cui il prezzo supera un livello di supporto o resistenza recente e successivamente rientra rapidamente nel range. Il rilevamento di questi falsi breakout può essere utile nell’ambito di analisi tecnica discrezionale o
FREE

GDXM Period Open Line The GDXM Period Open Line is a powerful institutional tool designed for traders who follow ICT concepts , SMC (Smart Money Concepts) , or price action strategies that rely on time-based price levels. In institutional trading, the opening price of a specific period (Yearly, Monthly, Weekly, or Daily) serves as the "Equilibrium" point. Trading above the opening price is considered a premium (seek shorts), and trading below is considered a discount (seek longs). This indicator
FREE
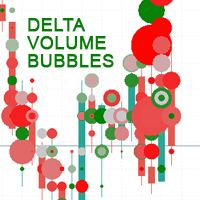
Delta Volume Bubbles è un indicatore avanzato per MetaTrader 5 progettato per visualizzare in modo chiaro e intuitivo la pressione di acquisto e vendita sul mercato. Attraverso bolle colorate e dinamiche, mostra in tempo reale la differenza tra volumi in buy e sell (Delta Volume), aiutando il trader a individuare zone di forte squilibrio tra domanda e offerta. L’indicatore rappresenta una forma visiva del flusso degli ordini (order flow) , semplificando l’analisi volumetrica anche per chi non di
FREE

This indicator allows to display Renko charts in the indicator window. Renko charts show only price movements that are bigger than the specified box size. It helps to eliminate noise and allows to focus on main trends.
Time is not a factor here. Only price movements are taken into account. That's why Renko chart is not synchronized with the main chart it is attached to. Indicator works in two modes: CLOSE - only close prices are taken into account while building the chart HIGH_LOW - only high/l
FREE

It is a MetaTrader 5 integrated drawing tool inspired on the "Pointofix" software. You can paint, make annotations and drawings on the chart in real time. It works in multiple timeframes, that is, the drawings can be visualized in different timeframes. The drawings are also saved in files and can be restored even on MetaTrader restarting.
Simple and Pratical
Chart Pen is designed as simple, beautiful and innovative way to create and manage all your chart analysis. There is no existing drawing
FREE
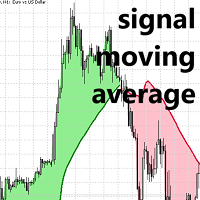
Algoritmo Lux per la media mobile Signal per MT5
Scopri un indicatore di media mobile unico, progettato specificamente per l'utilizzo della linea di segnale nei sistemi di crossover di media mobile. Questo strumento avanzato si differenzia divergendo dal prezzo nei mercati in range, mentre rispecchia fedelmente una media mobile standard nei mercati in trend. Questa caratteristica aiuta i trader a evitare rumore di fondo inutile e potenziale overtrading dovuto alle fluttuazioni del mercato.
La
FREE

Developed by MMQ — Session Based Market Profile TPO Indicator This indicator organizes price and time information into session-based Market Profiles, helping you identify value areas, points of control, and single prints for more informed trading analysis. Inspired by Jim Dalton’s book “Mind Over Markets”.
LINKS [ Documentation | Upgrade ]
What is Session-Based Market Profile? Session Based Market Profile is a powerful analytical tool that organizes price and time information to reveal mar
FREE

Anchored VWAP (AVWAP) per MT5 Porta la tua analisi dei grafici al livello successivo con Anchored VWAP per MT5 , uno strumento potente e flessibile progettato per trader che vogliono livelli di prezzo chiave precisi, rapidi e chiari . Questo indicatore offre un’analisi VWAP in stile istituzionale, simile alle funzionalità di TradingView, ma completamente ottimizzato per MT5. Caratteristiche principali Più ancoraggi per grafico: Aggiungi tutte le linee AVWAP necessarie, ciascuna con data e ora di
FREE

Indicatore Chaikin Money Flow (CMF) con supporto multi-timeframe, segnali visivi personalizzabili e sistema di avvisi configurabile.
Cos'è il CMF? Il Chaikin Money Flow (CMF) è un indicatore di momentum ponderato per volume sviluppato da Marc Chaikin che misura la pressione di acquisto e vendita in un periodo specificato. L'indicatore calcola il Moltiplicatore di Flusso Monetario per ogni periodo e crea una media ponderata sul periodo di riferimento. Il CMF oscilla tra +1 e -1, con valori posi
FREE

Azimuth has been created for structure-first traders looking for complete market cycle analysis in one professional suite.
While most ZigZag indicators show only major swings, Azimuth reveals 4 nested swing levels simultaneously (L1/L2/L3/L4) — giving you early-cycle entries, late-cycle warnings, and full structural context. Combined with swing-anchored VWAP (not arbitrary daily resets), MTF zigzag swings, and automated ABC pattern detection, you get institutional-level structure analysis with
FREE

This indicator shows the TLH and TLL and some trendlines that allow us to estimate the trend of market. It also shows the values of the angles of the lines in percentage in points (pip) , the standard deviation, and the trend of each line, and when it breaks the lines of support and resistance (TLH and TLL). And finally, it also shows the points identified as supports and resistances through the fractal algorithm in the graph. The high and low trend lines are supported by the highs and lows, th
FREE

Peak Trough Analysis is the great tool to detect peaks and troughs in your chart. Peak Trough Analysis tool can use three different peaks and troughs detection algorithm. The three algorithm include the orignal Fractals Indicator by Bill Williams, the Modified Fractals indicator and ZigZag indicator. You can use this peak and trough analysis tool to detect the price pattern made up from Equilibrium Fractal-Wave process. For further usage, there are good guide line on how to use this peak trough
FREE

Indicador gratuito para Metatrader 5 que muestra en pantalla una caja rectangular para cada una de las sesiones de mercado "Londres, New York y Tokio". Se puede establecer la zona horaria de forma automática o mediante un valor de offset. Parámetros de configuración para cada una de las sesiones. Visible / No visible Hora Inicial Hora Final Caja sólida o transparente. Estilo del borde de la caja. Grosor del borde de la caja. Color.
FREE

Range Detector Sniper — Smart Range Breakout Visualizer for MT5 Range Detector Sniper is a precision range breakout visualization indicator for MetaTrader 5 that automatically detects consolidation zones and highlights confirmed breakout moves in real time. It identifies valid price ranges using volatility and structure filters, draws dynamic range boxes on the chart, and prints directional breakout signals when price exits the range. It works on all major metals - XAUUSD, Forex pairs - EURUSD,
FREE

Desenvolvido por smart2trader.com Smart Super Trend é um indicador avançado de identificação de tendências, desenvolvido para detectar com alta precisão movimentos de alta e baixa do mercado . O indicador Super Trend da Smart utiliza algoritmos adaptativos combinados com filtros de volatilidade , proporcionando sinais mais limpos e alinhados à dinâmica real do preço. Conta ainda com um sistema inteligente de monitoramento que notifica, em tempo real, sempre que ocorre uma mudança de tendência ,
FREE

This is the Cumulative Volume Delta (CVD) , it's an indicator that calculates the long and short volumes plotting it then as a line on the chart, the most efficient way to use this indicator is by comparing the CVD line to the current chart and looking at the Divergence beetween the two of them, so that you can identify fake-outs and liquidty sweeps. for example in the picture that i put below you can see that the price has made a lower low but the CVD didn't, that means the volumes didn't suppo
FREE
### Best Order Block Detector Indicator for MT5
The Order Block Detector is a technical analysis indicator designed for MetaTrader 5 (MT5). It identifies potential order blocks (OBs) in the market, which are key price levels where significant buying or selling activity has occurred, often acting as support or resistance zones. These blocks are detected based on volume pivots and market structure swings, helping traders spot areas of institutional interest for potential reversals or continuation
FREE

Introduction
The Bounce Zone indicator is a cutting-edge non-repainting technical tool built to identify key areas on the price chart where market sentiment is likely to cause a significant price reversal. Using advanced algorithms and historical price data analysis, this indicator pinpoints potential bounce zones. Combined with other entry signal, this indicator can help forex traders place the best trades possible
Signal
A possible buy signal is generated when price is in the green zone an
FREE

Description
This is a sophisticated hybrid momentum indicator that combines the classic Williams %R oscillator with Bollinger Bands. Unlike standard Bollinger Bands that are applied directly to price, this indicator calculates the volatility bands based on a smoothed Williams %R value. By smoothing the raw WPR data before applying the standard deviation formula, the indicator filters out market noise and focuses on significant momentum shifts. When the smoothed WPR line breaks through the Bol
FREE

FOR CRASH 500 ONLY!! MT5
*This is a smooth heiken ashi setup meant to be used on CRASH 500 in combination with other indicators. *You are welcome to test it on other markets aswell. *I will be posting other indicators aswell to help with trading the crash 500 market. *You can use this to help smooth out price if you do struggle with reading the charts as is. * Just note heiken ashi doesnt represent real price action only smoothes it out for ease of read.
FREE

Consulta "Novità" per una descrizione delle funzioni più recenti. La versione 1.4 è stata solo una pulizia, niente di speciale.
//+---------------------------------------------------------------------------------------------------------------+ Ho creato questo perché avevo bisogno di un indicatore frattale personalizzabile. Verifica anche la diminuzione dei volumi per avere una sorta di conferma. Ecco la descrizione: Panoramica Questo indicatore è progettato per aiutare a identificare i punti ch
FREE

Perfect Day Scalper Pro
Your Daily 5-Point Routine for a 5-Figure Income.
Price: $150 USD (Stop Chasing, Start Cashing)
---
One Trade. One Target. One Victory Lap. Your Day is Done.
(Forget the 1000+ pip dreams that turn into 100+ pip losses. Real wealth is built on consistency, not complexity. What if your entire trading day was over in 15 minutes, with a single, high-probability trade that hands you a clean, professional profit? Welcome to the Perfect Day Scalper.)
---
What is The
FREE

The Volume Weighted Average Price is similar to a moving average, except volume is included to weight the average price over a period. Volume-Weighted Average Price [VWAP] is a dynamic, weighted average designed to more accurately reflect a security’s true average price over a given period . Mathematically, VWAP is the summation of money (i.e., Volume x Price) transacted divided by the total volume over any time horizon, typically from market open to market close.
VWAP reflects the capitali
FREE
The Omega Trend Indicator is an advanced tool that has been specifically designed to detect market trends early, and follow them efficiently. The indicator draws two lines. The main (thicker) Trend Line represents the presumed lower or upper volatility limits of the current market trend. A break in the main Trend Line indicates a potential reversal or shift in the movement of the trend. The Trend Line also indicates the best point to place a stop loss order. In Omega Trend Indicator, the Trend L
FREE

This indicator finds and displays the Double Bottom and Double Top technical analysis patterns. Signals (displays a message on the screen) if the shape was formed recently. Often after the appearance of these patterns, the trend reverses or a correction occurs. In order not to search for them yourself, or not to miss their appearance, it is enough to add an indicator to the chart. The indicator can be used on different timeframes and currency pairs, there are settings for a better search on a c
FREE

Indicator Guide: Key Price Levels & Structure Shifts 1. Description The indicator is a technical analysis tool for the MetaTrader 5 platform. It is designed to automatically identify specific price movements and to highlight corresponding price zones based on preceding price action. This provides a visualization of key price areas according to the indicator's internal logic. 2. Visual Elements & Their Identification The indicator identifies and draws several types of visual elements on the chart
FREE

Versione migliorata del MACD Histogram (per monitorare i cambiamenti del momentum) L’indicatore MACD standard di MT5 utilizza il valore della linea MACD stessa per costruire l’istogramma. In condizioni di movimenti rapidi o mercati laterali, questi istogrammi cambiano lentamente e spesso non riflettono chiaramente l’accelerazione o il rallentamento della forza rialzista o ribassista. Ciò è particolarmente evidente quando il prezzo non mostra ancora un’inversione chiara, causando segnali in ritar
FREE

Candle Range Theory – Dual Timeframe Analyzer with Alerts & 50% Midline This powerful visual tool helps you identify and track classic **mother candle → inside bar** patterns (including patterns where the inside candle wicks beyond the mother high/low but **closes back inside** the range, which is known as CRT).
Key features: • Works on two independent timeframes simultaneously (e.g. D1 + H4, H4 + H1, any combination) • Draws horizontal range lines (high & low) that stop exactly when the next v
FREE

Descrizione generale Questo indicatore è una versione avanzata del classico Donchian Channel , arricchita con funzioni operative per il trading reale.
Oltre alle tre linee tipiche (massimo, minimo e linea centrale), il sistema rileva i breakout e li segnala graficamente con frecce sul grafico, mostrando solo la linea opposta alla direzione del trend per semplificare la lettura. L’indicatore include: Segnali visivi : frecce colorate al breakout Notifiche automatiche : popup, push e email Filtro R
FREE

Custom Spread Indicator *Please write a review, thanks!
Also MT4 version is available
Spread Indicator show the current spread in pips with color codes. Handle 3 levels, Low, Medium, High. You can set levels and colors for each level (eg. Low: Green, Medium: Orange, High: Red), and can choose display position on the chart.
There is two spread calculation mode: -> Server spread value -> Ask - Bid value
Can set opacity, for better customization. When spread jump bigger, then display do not
FREE

This is a simple order block locator. Searched for the existence of order blocks only at extremums. If you want multi criteria order block location check my other indicator which is more powerful here These order blocks are ICT order blocks without any buttering.
The indicator can be a useful tool for detecting reversals, continuations. You can also use the indicator as confluence with your other tools
FREE
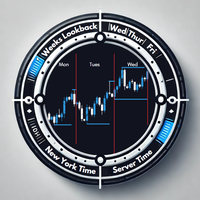
Overview The Daily Session Separator indicator is a powerful tool designed to enhance your trading experience by clearly marking daily trading sessions on your chart. It helps traders visualize daily boundaries, session highs and lows, and essential day-specific data to make informed decisions. With its seamless integration into any chart and dynamic adaptability, this indicator is a must-have for traders who rely on precision and clarity. Key Features Daily Session Separators Automatically adds
FREE

Auto Candle Sequence Counter – Indicatore MT5
Descrizione Auto Candle Sequence Counter è un indicatore professionale per MetaTrader 5 che rileva automaticamente sequenze consecutive di candele rialziste e ribassiste. Fornisce visualizzazione in tempo reale, statistiche e avvisi per migliorare l’analisi dell’azione dei prezzi.
Caratteristiche principali
Rilevamento di sequenze da 2 a 7 candele (rialziste/ribassiste).
Mappatura precisa senza perdita di segnali.
Rilevamento dei doji (sensibili
FREE

OBV MACD
Calculating MACD based on OBV data Features
3 outputs: MACD & Signal & Histogram 4 Colored Histogram Smoothing factor show/hide option for MACD & Signal lines Description
Among the few indicators developed for working with volume data, OBV (On Balance Volume) is the simplest yet most informative one. Its logic is straightforward: when the closing price is above the previous close, today's volume is added to the previous OBV; conversely, when the closing price is below the previous close
FREE

Questo indicatore è uno strumento interattivo di etichettatura delle Onde di Elliott per MetaTrader 4 e 5.
Consente all’utente di posizionare manualmente le etichette delle onde direttamente sul grafico, selezionando la dimensione dell’etichetta, il colore e il tipo di onda (correzioni ABC, impulsi a 5 onde o strutture WXY) da un menu sul grafico.
Con un solo clic sul grafico, l’indicatore posiziona in modo sequenziale le etichette delle onde appropriate nel prezzo e nel tempo scelti, aiutando i
FREE

# Simple Fibo MT5 - Professional Fibonacci Indicator A lightweight and efficient Fibonacci retracement indicator designed for professional traders who need clean, automatic technical analysis without chart clutter. This indicator automatically identifies swing highs and lows, draws Fibonacci levels, detects key Support/Resistance zones, and displays a real-time candle countdown timer.
Perfect for day traders, swing traders, and scalpers who rely on Fibonacci retracements and key price levels f
FREE
AlgoRhythm ZLSMA - The Ultimate Trend Trading Solution Unlock the power of precision trading with AlgoRhythm ZLSMA , an advanced technical indicator designed to deliver razor-sharp trend signals. Engineered for MetaTrader 5, this cutting-edge Zero Lag Smoothed Moving Average (ZLSMA) combines sophisticated smoothing techniques, multi-timeframe analysis, and dynamic bands to give traders a competitive edge in any market. Whether you're a scalper, swing trader, or long-term investor, AlgoRhythm ZLS
FREE

Filigrana centralizzata
Aggiunge una filigrana centrata con il nome della risorsa e il periodo scelto.
È possibile ignorare il tipo di carattere, la dimensione del carattere, il colore del carattere e il carattere separatore.
La filigrana è posizionata dietro le candele, non disturbando la visualizzazione.
Ha il ricentramento automatico se la finestra viene ridimensionata.
Spero che questo indicatore ti aiuti, buon trading;)
FREE

Cybertrade Auto Fibonacci retraction and projection - MT5
Auto Fibonacci is an indicator that automatically plots the Fibonacci retracement and projection based on the number of bars you select in the indicator setting. You can customize nine different levels of retraction and three levels of projection. It works on periods longer than the period visible on the chart. All values are available in the form of buffers to simplify possible automations. This indicator is the same one we use in ou
FREE

Are you tired of drawing Support & Resistance levels for your Quotes? Are you learning how to spot Support & Resistances? No matter what is your case, Auto Support & Resistances will draw those levels for you! AND, it can draw them from other timeframes, right into you current chart, no matter what timeframe you are using... You can also Agglutinate regions/zones that are too much closer to each other and turning them into one single Support & Resistance Level. All configurable.
SETTINGS
Timefr
FREE

Indicatore Calendario Economico Avanzato Questo indicatore mostra direttamente sul grafico tutti gli eventi economici futuri rilevanti per la coppia o lo strumento selezionato, permettendo di anticipare i momenti di maggiore volatilità e pianificare le proprie strategie con precisione. Funzionalità principali Visualizzazione degli eventi futuri fino a 5 giorni avanti (configurabile). Filtraggio per impatto della notizia (alto, medio, basso). Possibilità di scegliere se mostrare linee verticali s
FREE
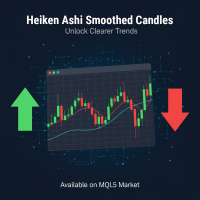
Indicatore Heiken Ashi Smoothed per MT5 Heiken Ashi avanzato con filtro di smoothing. Riduce il rumore, elimina falsi segnali e individua trend precocemente. Ideale per Forex, indici e crypto (H1-D1). Come funziona e come viene levigato? L'Heiken Ashi tradizionale calcola le candele mediando i valori di apertura, chiusura, massimo e minimo dei periodi precedenti, riducendo già l'impatto delle fluttuazioni minori. Tuttavia, l' Heiken Ashi Smoothed eleva questo approccio applicando un filtro di le
FREE

This is a derivative of John Carter's "TTM Squeeze" volatility indicator, as discussed in his book "Mastering the Trade" (chapter 11).
Gray dot on the midline show that the market just entered a squeeze (Bollinger Bands are with in Keltner Channel). This signifies low volatility, market preparing itself for an explosive move (up or down). Blue dot signify "Squeeze release".
Mr.Carter suggests waiting till the first blue after a gray dot, and taking a position in the direction of the moment
FREE

Il Matrix Arrow Indicator Multi Timeframe Panel MT5 è un componente aggiuntivo gratuito e una grande risorsa per il tuo Matrix Arrow Indicator MT5 . Mostra l'attuale segnale Matrix Arrow Indicator MT5 per 5 timeframe personalizzati dall'utente e per 16 simboli/strumenti modificabili in totale. L'utente ha la possibilità di abilitare/disabilitare uno qualsiasi dei 10 indicatori standard di cui è composto il Matrix Arrow Indicator MT5 . Anche tutti i 10 attributi degli indicatori standard sono re
FREE
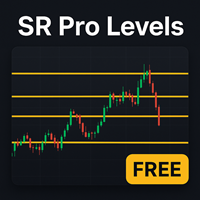
Ottieni una struttura di mercato chiara in pochi secondi – senza disegnare manualmente!
L’ Indicatore HTF Auto Support & Resistance segna automaticamente sul grafico i livelli chiave di supporto e resistenza. Questi livelli si basano su un timeframe superiore (HTF), quindi sono molto più affidabili delle linee casuali a breve termine. Caratteristiche principali: Rilevamento automatico delle zone di supporto e resistenza più forti Analisi multi-timeframe: scegli un timeframe più alto per livelli
FREE
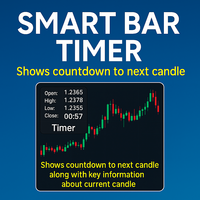
L' Enhanced Bar Timer è un indicatore versatile e personalizzabile per MetaTrader 5 (MT5) che fornisce informazioni in tempo reale sulla candela corrente, inclusi un timer di conto alla rovescia per la prossima barra, dettagli della candela, volume e spread. Visualizzato nell'angolo specificato dall'utente della finestra del grafico, questo indicatore offre un formato a più linee o a linea singola, consentendo ai trader di monitorare i dati di mercato critici a colpo d'occhio, migliorando il pro
FREE
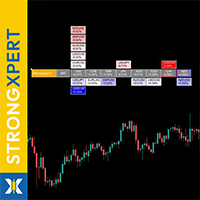
CLICCA QUI PER VEDERE TUTTI I MIEI PRODOTTI GRATUITI
StrongXpert è il tuo strumento preciso per monitorare in tempo reale la forza delle valute nel mercato globale. È stato sviluppato per mostrarti dove il capitale sta realmente entrando - e da dove sta uscendo dal mercato . L’indicatore misura la forza relativa delle otto principali valute (USD, EUR, GBP, JPY, AUD, CAD, CHF, NZD) e trasforma movimenti di prezzo complessi in un pannello visivo semplice e leggibile - direttamente sul grafico. I
FREE
Scopri come acquistare un robot di trading dal MetaTrader Market, il negozio di applicazioni per la piattaforma MetaTrader.
Il sistema di pagamento di MQL5.community supporta le transazioni tramite PayPal, carte bancarie e gli altri sistemi di pagamento più diffusi. Per essere pienamente soddisfatto, ti consigliamo vivamente di testare il robot di trading prima di acquistarlo.
Ti stai perdendo delle opportunità di trading:
- App di trading gratuite
- Oltre 8.000 segnali per il copy trading
- Notizie economiche per esplorare i mercati finanziari
Registrazione
Accedi
Se non hai un account, registrati
Consenti l'uso dei cookie per accedere al sito MQL5.com.
Abilita le impostazioni necessarie nel browser, altrimenti non sarà possibile accedere.