 MetaTrader 5
 专家
 指标
 程序库
 实用工具
 窗口小部件
 规则
适用于MetaTrader 5的免费技术指标 - 4
 技术指标的信号外汇和股票市场的开仓交易和平仓交易起着至关重要的作用。指标的本质就是一种交易品种的数学转换,旨在预测未来的价格变化。
测试技术指标可以更有利于预测市场行为并从中获利。

每侧最多 7 个斐波那契枢轴水平。如需带有重测次数统计的分级供需区域: Supply Demand RSJ PRO Pivot Point Fibo RSJ 绘制每日枢轴点,以及按斐波那契比率计算的支撑位和阻力位。 它根据前一交易日的最高价、最低价和收盘价,最多绘制 7 个支撑位和 7 个阻力位。交易者将这些水平作为参考区域,用于规划当日的入场、出场和止损位置。 功能 最多 7 个支撑位和 7 个阻力位 四种计算类型:三种斐波那契变体和经典枢轴点 每个水平可单独设置颜色 输入参数 Pivot Type Pivot Fibo RSJ1 = 斐波那契比率组 1 Pivot Fibo RSJ2 = 斐波那契比率组 2 Pivot Fibo RSJ3 = 斐波那契比率组 3 Pivot Fibo Classic = 经典枢轴点计算 Minimum Pivot Levels:每侧 3、4、5、6 或 7 个水平 如有任何问题,请给我发送私信: https://www.mql5.com/en/users/robsjunqueira/ 完整手册: https://www.mql5.com/zh/bl
FREE

随时知道当前哪个交易时段正在进行、还剩多久、下一个何时开始,每个时段的最高价和最低价都直接画在图表上。 ICT Killzone and Session Tracker 以 GMT 把整个交易日放到您的图表上,因此在任何经纪商那里读数都一致,并且可以在 时段或 Killzone 开启或结束的那一刻提醒您 。没有信号,不重绘。 它显示什么 实时时段面板 ,带 GMT 时钟,悉尼、东京、伦敦、纽约各占一行。每一行要么显示「进行中」以及剩余时间,要么显示距离开盘还有多久。正在进行的时段会以其专属颜色高亮。 时段区间框 ,按各时段的交易时间,从最高价画到最低价,带标签并按颜色区分,覆盖最近几天。当前时段的框会实时向右延伸。 按您自己的 Killzone 设置 时段时间就是普通的 GMT 输入项。可以保留默认值使用标准时段,也可以填入您自己的 Killzone 时间窗,例如伦敦 Killzone 设为 GMT 07:00 到 10:00。标签同样可以改,让面板和区间框按照您的交易方式来显示。 自动处理夏令时 您永远不需要一年调两次。每个时段都带有自己的夏令时规则(欧洲、美国、澳大利亚,东京则
FREE

概述 本指标是经典 Donchian 通道 的增强版,增加了多种实用的交易功能。
除了标准的三条线(最高、最低和中线),系统能够检测 突破 ,并在图表上用箭头进行可视化标记,同时只显示 与当前趋势方向相反的那条线 ,让图表更加简洁。 功能包括: 可视化信号 :突破时在图表上绘制彩色箭头 自动通知 :弹窗、Push 推送和 Email 邮件 RSI 过滤 :根据市场相对强弱验证信号 个性化设置 :颜色、线条粗细、箭头符号、RSI 阈值等 工作原理 Donchian 通道计算: 上轨线 :最近 N 根已收盘 K 线的最高价 下轨线 :最近 N 根已收盘 K 线的最低价 中线 :最高价和最低价的平均值 看涨突破 :收盘价高于上轨线
看跌突破 :收盘价低于下轨线 指标会: 绘制三条 Donchian 通道线 仅在 方向变化后的首次突破 绘制箭头 隐藏顺应趋势方向的那条线(上涨趋势: 只显示红色下轨线;下跌趋势: 只显示绿色上轨线) 可选用 RSI 过滤突破信号,减少虚假突破 支持实时发送通知 参数说明 Donchian 通道设置 indPeriod :计算通道高低点的已收盘 K 线数量 Lin
FREE
免费获取我所有的 MT4 和 MT5 指标 — 点击这里了解方法
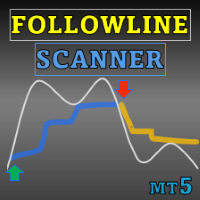
新工具 售价 $30 限于 首周 或 前 3 次购买 ! MQL5 Trading Tools 频道 : 加入我的 MQL5 频道,获取我的最新动态 通过 Follow Line MT5 与扫描仪,最大化您的交易优势,这是一款为严肃交易者设计的先进基于波动率的指标。此工具结合了布林带的强大功能和可定制的设置,提供对价格波动的精准见解。 See more MT4 version at: Follow Line MT4 with Scanner See more products at: https://www.mql5.com/en/users/ndhsfy/seller Follow Line 的关键在于其能够检测价格何时超出设置为 1 标准差的布林带。以下是其工作原理: 买入信号: 当价格突破上布林带时,Follow Line 变为蓝色,提示潜在的买入机会。 卖出信号: 当价格跌破下布林带时,Follow Line 变为红色,指示可能的卖出信号。 但 Follow Line 不仅仅
FREE

Dual Fibo Auto Pro 是一款面向技术分析与波浪理论的专业级指标工具。它通过优化版之字形(ZigZag)自动甄别价格极值,并基于智能算法在其之上部署两组相互独立的斐波那契网格。 第一组网格 :展示当前价格相对于最近一个已完成之字形波段的运行方向。 第二组网格 :自动在历史数据中检索对当前行情走势具有深远影响的主流波段(涵盖强力推动浪、急涨急跌、深度回调及大型趋势行情)。 该指标能够随市场波动实现动态自适应, helping traders 深度解析任意交易品种与时间周期下的盘面微观及宏观结构。 图表显示要素 优化版之字形(ZigZag): 在经典算法基础上扩展了外包线(Outside Bar)处理机制(由 Depth 、 Deviation 与 Backstep 参数驱动)。若某根K线同时刷新高点与低点,系统将依据K线实体颜色判定优先级,从而允许在同一根K线上同时构建峰值与谷底。 波段百分比标签: 在每个峰值上方与谷底下方直观呈现当前波段相对于前一波段的规模比例(例如: 61.8% 表示前一波浪的回调幅度, 161.8% 意味着当前波浪为前一波的 1.618 倍)。该标签
FREE
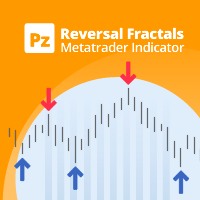
This is the latest iteration of my famous indicator, Reversal Fractals, published for the first time almost a decade ago. It examines the price structure of fractals to determine possible reversal points in the market, providing timing to positional traders that already have a fundamental or technical valuation model. [ Installation Guide | Update Guide | Troubleshooting | FAQ | All Products ] Reversal fractals can start long trends The indicator is non repainting
It implements alerts of all k
FREE

介绍 Koala Supply Demand 欢迎使用 Koala Supply Demand 指标。该指标专为识别不同时间周期中的 未被突破的供需区域 而设计。该指标可以帮助交易者以区域的方式观察市场,您可以看到价格如何尊重某些强力区域。该指标还可以在价格行为信号形成于区域内部时显示相关信号。 Koala Supply Demand 的 MT4 版本 也已提供 : 下载 加入我的 MQL5 频道以 获取更多免费产品 : 加入 主要功能:
图表回测功能: 通过独特的 On Chart Back Test 功能体验全新的分析方式。只需点击图表上的任意位置,即可立即查看该时刻尚未失效的供需区域。此功能为用户提供实时洞察,以帮助做出更明智的交易决策。 价格行为形态识别: 通过选择不同的价格行为形态来自定义您的交易策略。该指标支持 engulfing patterns 等热门形态。当选择后,指标会在未突破的供需区域内,为每个出现的形态显示清晰的买入和卖出箭头。 新信号提醒: 通过及时提醒保持领先市场。接收发生在已识别供需区域内部的新价格行为信号通知。这确保您不会错过任何潜在交易机会
FREE

ERGOSPHERE 是一款专为 MetaTrader 5 开发的智能市场分析指标,内置人工智能(AI)技术。它将神经网络逐笔报价分析与专有的市场价格结构算法相结合,用于生成 BUY(买入)和 SELL(卖出)方向信号。 核心神经网络拥有 超过1000万个参数 。额外的 AI 模型结合市场环境,对主模型提出的信号进行进一步评估,并可在特定条件下过滤部分候选信号。 当前主要开发与基准测试配置为 EURUSD M15,使用默认参数。 AI 分析功能在技术上也支持其他 M15 外汇货币对,包括带有经纪商专用后缀的交易品种。不同交易品种的信号质量可能有所差异。使用其他货币对之前,建议结合历史数据和经纪商报价条件进行独立评估。 所有神经网络模型均已嵌入指标内部。无需单独下载模型文件,也无需外部程序、DLL 动态链接库或云端计算服务。历史报价数据由交易终端提供。 信号生成原理 价格结构分析引擎研究价格与结构区域中心及边界之间的重复交互。神经网络模块分析真实逐笔报价序列,并独立生成方向性候选信号。候选信号还需经过额外验证和重复信号控制机制。 常规信号在 K线收盘后 计算生成。使用逐笔报价数据并不意味
FREE

Key Liquidity Levels and Confirmation shows where liquidity is resting on the chart and marks the moment it is taken. It combines three steps of one trading idea in a single tool: the key level, the sweep of that level, and the confirmation that follows.
KEY LEVELS - Asia, London and New York session highs and lows - Previous day high and low (PDH / PDL) - Previous week high and low (PWH / PWL) - Previous month high and low - All-time high and all-time low Levels that share the same price are
FREE

在图表下方的一条色带中,一眼看出三个时间周期何时趋势方向一致。不重绘。
任意品种,M1 到 W1 任意时间周期。2 分钟加载到图表。可在 Strategy Tester 中免费测试。
Get more indicators here
Baselines, volatility filters and oscillators. No repaint.
为什么需要它 你在一个时间周期入场,之后发现更高周期的方向相反。检查需要来回切换图表,而行情快时你往往会跳过。逆着更高周期趋势的入场,常常是停滞或反转的那些。 你将获得 Fabii Half Trend Mtf Alignment 在一条色带中显示当前图表和两个更高时间周期的 Half Trend 方向,让你无需切换图表就能确认趋势。 三条叠放的色带,当前周期在上,两个更高周期在下,让你一眼读懂整个趋势结构。 只有两种颜色,绿色代表上升,红色代表下降,让你更快做出决定。 更高周期可自动选择(后面的两个)或由你指定,让它适合你自己的方法。 当前图表转向、更高周期转向和完全一致时均有提醒,让你不必一直盯着图表。 提供可被 Expert A
FREE

Smart Session Box 在图表上以方框形式显示悉尼、东京、伦敦和纽约交易时段,并配有实时交易时间与倒计时面板。 交易时间与倒计时 面板列出每个时段的 UTC 时间和您经纪商的时间。进行中的时段显示距离收盘的剩余时间,高亮行显示下一个开盘的时段及剩余时间。同时提供东京、伦敦、纽约和悉尼证券交易所时间作为参考。 时段方框 每个时段绘制带有最高价和最低价线的方框,可作为日内支撑与阻力。时段重叠部分会着色,标出全天流动性最强的时段。当价格突破已结束时段的最高价或最低价时,会绘制突破线。方框可以填充显示,也可以仅显示边框。 交易时段 时段 冬季 UTC(默认) 重叠 悉尼 21:00 - 06:00 与东京:00:00 - 06:00 东京 00:00 - 09:00 与伦敦:08:00 - 09:00 伦敦 08:00 - 17:00 与纽约:13:00 - 17:00 纽约 13:00 - 22:00 - 伦敦、纽约和悉尼会在夏令时自动平移一小时。东京没有夏令时。所有时段时间均可按 15 分钟步长调整。 控制面板 按钮可切换紧凑模式、标签、最高/最低价线、重叠区、突破线和方框填充
FREE

Shved Supply and Demand is an automated market structure indicator that identifies and plots dynamic Support (Demand) and Resistance (Supply) zones in real time. Powered by a dual Fast and Slow Fractal algorithm combined with ATR-based (Average True Range) volatility sizing, the indicator filters out market noise and highlights high-probability liquidity zones. Designed for price action traders, scalpers, and Expert Advisor (EA) developers looking for objective key level detection. Key Features
FREE

免费赠品:SMART STRUCTURE EA
下载 Smart Structure Concepts,并在 MQL5 上给我发送私信,即可免费获得 Smart Structure EA。这是我基于同一结构逻辑开发的 Smart Money Concepts 智能交易系统。它专为美分账户设计,您可以用小额资金在真实账户中测试,同时学习读懂市场。请先在模拟账户或美分账户中测试。领取无需留下评价。 这不是又一个只画区域、让您自己猜的结构指标。Smart Structure Concepts 为您读懂市场,在 XAUUSD(黄金)、外汇、指数、加密货币及任何其他市场上实时标记 Smart Money Concepts(SMC / ICT)结构。无需进入参数逐个设置区域:通过图表上的交互式面板,一键决定显示、隐藏或调整的内容,无需打开属性,也无需重启指标。 每个工具都在您交易时教您:将鼠标悬停在任何区域、信号或价位上,解释会直接出现在图表上。没有黑箱,没有盲目下单。 问题 手动标记市场结构会让新手和老手都疲惫不堪。每次切换图表或周期都要重新开始:标记区域、画线、手动识别 BOS 和 CHo
FREE

This indicator allows to display Renko charts in the indicator window. Renko charts show only price movements that are bigger than the specified box size. It helps to eliminate noise and allows to focus on main trends.
Time is not a factor here. Only price movements are taken into account. That's why Renko chart is not synchronized with the main chart it is attached to. Indicator works in two modes: CLOSE - only close prices are taken into account while building the chart HIGH_LOW - only high/l
FREE

PivoTrack VP 一款适用于MetaTrader 5的枢轴锚定成交量分布指标,在连续的枢轴高点与低点之间绘制成交量分布图,揭示价格接受与拒绝区域。 PivoTrack VP是MetaTrader 5的成交量分析指标。它自动识别任意图表上的枢轴高点(Pivot High)和枢轴低点(Pivot Low),并为它们之间的每个区间绘制完整的成交量分布图。指标显示控制点(POC)、价值区高点(VAH)、价值区低点(VAL)以及价值区背景填充,让交易者清晰了解每次价格波动中成交量的分布情况。另有一个实时发展中的分布图,持续追踪从最近确认的枢轴到当前K线的区间。 概述 指标通过识别具有可配置左右K线数量的枢轴高点和低点,将图表历史划分为多个区间。对于每个已完成的区间,指标计算成交量在可配置数量的价格行上的分布,绘制直方图,将成交量最高的行标记为控制点,并从该行向外扩展以确定价值区。价值区代表用户定义的区间总成交量百分比所对应的价格范围。直方图柱的颜色区分价值区内外的行。从最后一个确认枢轴到实时K线的发展中区间在每根K线上重新绘制,始终显示当前结构。当价格穿越发展中区间的POC、VAH或
FREE

Wyckoff Architectural Range Wyckoff Architectural Range is an automatic range-detection indicator built around Wyckoff market theory. It scans price action for valid consolidation ranges, then maps the range into a clear premium/discount structure so you can instantly see where price sits relative to fair value. What it does: Auto range detection — automatically identifies valid consolidation ranges based on volatility (ATR), so you don't have to draw them manually. Premium & Discount zones — sp
FREE

如果你象这个项目一样,就有5个饥饿审查。 这项指标采用了既定价格的公开、高、低价和关闭价格
可以对特定时间区加以调整。 许多机构和专业人士都认为这些是重要的。
贸易商可以为你了解他们可能更进一步的地点,
积极。 现有期间为: 前一日。 前一星期。 曾任Month。 曾任。 前一年。 或: 目前日。 目前周。 目前 Month。 目前配额。 今年。
FREE

FREE Heiken Ashi Smoothed indicator is fully adjustable, easy to use and comes with possibility to access the indicator via iCustom function so you can use it in your own trading software. Indicator can also pop up alerts when signal changes or send push notifications. For Metatrader 4 version click here: https://www.mql5.com/en/market/product/70824 For detailed information click: >>HERE<< Features
Easy to use Accessible via iCustom Fully adjustable Alerts and Push notifications Possib
FREE
蜡烛结束前的时间指标。显示蜡烛结束前的时间,以及服务器时间。文本可以显示蜡烛的趋势或方向,内置声音通知 特点:
显示到当前蜡烛结束的时间以及其他可以根据需要调整或禁用的时间范围 AW Candle Time 可以用 AW Super Trend 指标选择当前蜡烛或趋势的方向 趋势策略以所选颜色突出显示 更换蜡烛前的内置声音通知和额外的时间着色 显示可配置在当前价格旁边或图表任意一角,在输入设置中灵活调整 Instruction -> 这里 / 更多产品 -> 这里 输入变量:
主要的 Candle_Time_Location - 蜡烛时间戳的位置。可以位于图表的角落或当前价格旁边 Trend_Strategy - 使用彩色蜡烛时间戳。可以使用 AW SuperTrend 指标在趋势方向上着色。可以根据当前蜡烛的方向着色。或者不考虑趋势策略 Show_Server_Time - 显示或隐藏服务器时间 Current_Time_Location - 选择一个位置来显示服务器时间。可以显示在图表的角落 蜡烛时间 Show_used_trend_mode_in_this_label
FREE

ICT Killzones and Liquidity Levels is a clean chart tool that marks the main ICT killzones and key liquidity levels directly on your chart. It is designed for traders who follow Smart Money Concepts and ICT-style price action and want a simple, non-repainting reference on the chart. The indicator draws the Asian, London, New York and London Close killzones as boxes based on the session high and low. A vertical line marks the start of each killzone for the current day, so you can see when each se
FREE

Scalp Signal 2 is a MetaTrader 5 indicator that runs three independent trading strategies on one chart and prints color-coded buy/sell arrows with a full set of ATR-based levels: entry, stop loss and three take-profit targets. Each strategy can be turned on or off, so you can run one, two or all three at once. Features Three strategies in one tool, each with its own arrow color so you always know which logic fired: Strategy 1 - Trend Pullback (EMA + ADX): buys pullbacks to the fast EMA inside an
FREE
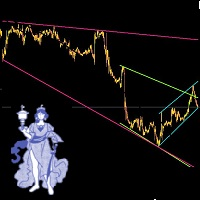
Leave a comment if you would like me to write an EA to trade these trendlines... if enough interest, will write an EA. Automatic Trendlines, updated automatically. To Set up 3 different (or mroe) Trendlines on chart, simply load the indicator as many times and name it differntly.. the example in the picture below is indicator 1 (loaded 1st time): Name: Long, StartBar: 50, BarCount: 500, Color: Pink indicator 2 (loaded 2nd time): Name: Short, StartBar: 20, BarCount: 200, Color: Green indicator 3
FREE

Fixed Range VP MT5 固定范围成交量 profile (FRVP) 是一款专为 MetaTrader 5 设计的高性能机构级分析工具。它能够映射特定用户自定义时间段内的交易活动,揭示关键的高成交量和低成交量节点。与合并买卖数据的传统成交量 profile 不同,该指标将总 Tick 成交量拆分为独立的买入和卖出结构。这种划分让您能够直接在主图表窗口中清晰透明地观察订单流。 该指标采用超快速的 MT5 Canvas 库构建,可呈现流畅、无延迟的图形。它通过在后台处理复杂的结构化数据,绕过了标准的 MetaTrader 图表性能瓶颈,完全不会拖慢您的终端运行速度。 核心功能: 买入/卖出成交量拆分:通过独特的颜色编码子直方图,立即识别在特定价格水平上是买方还是卖方占据主导地位。 动态价值区 (VA) 引擎:自动计算并显示自定义百分比的价值区(默认 70%),即交易最密集的区域。 控制点 (POC) 追踪:清晰标记在您所选时间范围内成交量最集中的单一价格水平。 高性能 Canvas 渲染:使用直接画布内存映射绘制像素级完美的自定义形状。这确保 your MT5 工作区始终保
FREE

Swing High/Low Identifier Swing High/Low Identifier 是一个为 MetaTrader 5 (MT5) 设计的自定义指标,用于突出显示图表上的重要摆动点。该指标基于可配置的柱范围识别并标记高摆动和低摆动点。 高摆动点以红色箭头标记在相应的蜡烛上方。 低摆动点以蓝色箭头标记在相应的蜡烛下方。 该工具帮助交易者快速发现重要的价格水平和模式,这对于做出明智的交易决策至关重要。 有效策略 趋势反转识别: 高摆动点可以指示潜在的阻力水平,可能会开始下跌趋势。 低摆动点可以指示潜在的支撑水平,可能会开始上升趋势。 支撑和阻力分析: 使用标记的高摆动点和低摆动点绘制水平线或通道,作为关键的支撑和阻力水平。 价格行为交易: 将指标与价格行为技术(如蜡烛图模式或突破策略)结合使用,以确认在摆动点的进出点。 摆动交易: 利用高摆动点和低摆动点,根据观察到的价格摆动和潜在的反转区域确定进出点。 其他指标的确认: 使用摆动点确认其他技术指标(如移动平均线或振荡器)的信号,以增强交易信号的可靠性。 该指标提供了关键价格点的可视化表示,帮助交易者增强技术分析和决策过
FREE

Ichimoku Nexus Pro 一目均衡表,将细田悟一的全部三大理论呈现在同一张图表上:五条线、波动论(I、V、N、P、Y、W 波)、价格论(N、V、E、NT 目标)和时间论(基本数值与对等数值的时间计数)。 另外还包含:不重绘的高周期云图、经过测算的迟行带(Chikou Span)、在基准线走平、云层过薄或价格处于云中时暂停交叉信号的震荡过滤器,以及读取"市场报价"中全部品种并按可靠度排序的扫描器。 多数一目均衡表工具只画五条线,再加一个面板和一个提醒。五条线只是一目均衡表的第一部分。细田悟一把这套系统建立在三大理论之上:行情的形态、应走的幅度,以及何时应当发生变化。Ichimoku Nexus Pro 三者全画。 五条线 转换线、基准线、云(先行带 A 与 B)和迟行带均在指标内部计算。策略测试器中的数值与实盘图表完全一致,没有断档,也没有空值。 周期预设: Traditional 9 / 26 / 52 / 26 Crypto 20 / 60 / 120 / 30 Doubled 18 / 52 / 104 / 26 Auto:加密货币品种用 Crypto,其余一律用 Tr
FREE

The Oracle是需要精准市场分析而无需管理多个指标的交易者的完美伴侣。
大多数指标只显示单一视角的信号,而The Oracle将经过科学验证的方法与专有增强功能融合到一个共识直方图中。 七个模型,包括我们的Ultimate Flow Index(UFI)配合Ehlers平滑算法,在每根K线上独立投票。
当足够多的模型达成一致——根据您设置的从4/7激进到7/7保守的阈值——方向就变得清晰。
主要功能
七模型共识系统 - 经验证的指标与专有模型的组合 - 包含具有高级平滑功能的UFI(Ultimate Flow Index) - 预优化参数(无需配置)
可配置警报阈值 - 4/7模型:激进(早期信号,噪音较多) - 5/7模型:标准(平衡) - 6/7模型:推荐(最佳信噪比) - 7/7模型:保守(稀少,仅高确信度)
信号持续模式 - Persisted模式:信号保持直到强烈反向信号 - Hybrid模式:稳定性与响应性之间的平衡 - 防重绘逻辑(信号在K线收盘时确定)
多时间框架就绪 - 在同一图表上叠加2-3个实例 - 每个分析不同时间框架(当前/M5/M15
FREE

SMC Mechanical Structure is an advanced, all-in-one trading indicator designed to combine objective Smart Money Concepts (SMC) market structure analysis with multi-session tracking and an intelligent theme engine. It automatically identifies Break of Structure (BOS), Change of Character (CHoCH), Inducement (IDM), and Order Blocks (OB) while mapping out major global market sessions to provide a complete institutional trading workspace. With the built-in Smart Theme Engine , the indicator instan
FREE
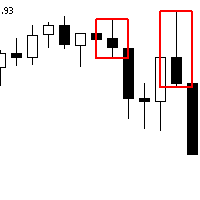
Next Arrival : Flip or Die Trading Arena. Flip a trading account: https://flipordie.com/chapter-1-thirteen-doublings-double-a-trading-account/ The Advanced Order Block Indicator for MetaTrader 5 is designed to enhance technical analysis by identifying significant order blocks that sweep liquidity and create Fair Value Gaps (FVG) when pushing away. This indicator is ideal for traders who focus on institutional trading concepts and wish to incorporate advanced order flow and price action strategi
FREE

======================================================== OFX ICT — MQL5 MARKET PRODUCT DESCRIPTION (formatting notes: **bold** = editor Bold button; lines starting with "•" = bullet-list button; UPPERCASE lines = section headings) ========================================================
SHORT TITLE (product name field): OFX ICT — FVG, CE, Hangman, CRT & Top-Down Bias for XAUUSD (Gold)
------------------------------------------------------- OVERVIEW -----------------------------------------
FREE

SMC Structure Map 用固定、公开的规则画聪明钱市场结构、订单块、FVG 和流动性扫掠,只用已收盘的 K 线。历史上看到的,就是当时实时会看到的,事后不会重画。 应用程序说明 更多风控工具: 查看我的全部产品 。 市场结构 已确认的摆动高低点,标 HH / HL / LH / LL(等高 / 等低标 EQH / EQL)。 K 线收盘越过当前摆动价位时标 BOS(顺势突破)或 CHoCH(性质转变)。 可选内部结构,摆动长度单独设置。 订单块和 FVG 订单块:结构突破前最后一根反向 K 线。 FVG:三根 K 线留下的缺口,带 50% 中线和回补百分比。 价格回来时状态实时更新:OB 已回测 / 已失效,FVG 已触及 / 50% / 已回补 / 跳空越过。失效区域可以灰色显示。 默认只画离现价最近的区域,面板会告诉你还有多少没画。 流动性扫掠 K 线冲过已确认的摆动高 / 低点,或前一交易日高 / 低点,收盘又回到里面。 面板上的多周期解读 最多 4 个更高周期的方向(比如 M15 图上显示 H1 · H4 · D1 · W1)。 可在图上叠加一个高周期(结构、O
FREE
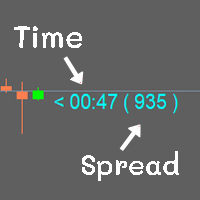
Show the time of candlesticks and spread. All data will be displayed in a rod. Can change color Can fix the size as needed
MT4 : Link https://www.mql5.com/en/market/product/102742 MT5 : Link https://www.mql5.com/en/market/product/102834
Most free code on various websites I didn't write it myself. I only do a little bit.
If you like it, please give 5 stars with it. Thank you.
FREE

该指标在图表上绘制了供需区域。结合您自己的规则和技术,该指标将允许您创建(或增强)您自己的强大系统。还请查看提供更多功能的 付费版本 。我的建议是寻找在至少 25 个条形图后发生第一次区域测试的交易机会。 特征 区域有 3 种颜色(可通过输入调整)。深色表示未测试区域,中色表示已测试区域 ,浅色表示损坏区域 。 每个区域都写有区域外边界的价格以及区域测试的数量。 输入参数 最大后退柱线以搜索第一个极值 - 默认值为 3000。将搜索 xx 前的第一个极值。值越高,需要的系统资源就越多 。对于较慢的计算机,500-1000 的值可能更合适。 区域测试之间的最小蜡烛数量 未经测试的需求颜色 测试需求颜色 破碎需求颜色 未经测试的供应颜色 已测试的供给颜色 破损供给颜色 文本颜色 测试次数标签的字体大小 价格标签尺寸 [1-3]
FREE
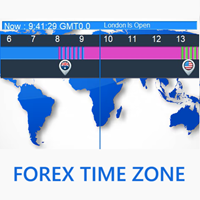
Forex Time Zone 简介 欢迎使用全新的免费专业工具—— Forex Time Zone !专业交易员深知时间在外汇交易中的重要性。每一秒,全球的一些市场开放,而另一些关闭,这会影响市场波动性以及个别货币的走势。此工具能够帮助交易员轻松了解当前哪个市场正在开放,以及当前的时区。 它是如何工作的? 只需根据您的国家选择您的时区,并将指标添加到图表中。您会看到一个水平的彩色框,每个市场用不同的颜色标记。如果两个市场重叠,框将显示两个市场的混合颜色。此外,还有一条竖直的蓝线,显示基于您所选时区的当前 GMT 时间。蓝线顶部的短标签会告诉您当前哪个市场开放。例如,它可能会显示“伦敦和东京现在开放”。 每个国家的旗帜表示什么? 在水平导航栏中,有四面代表每个市场开盘的国家国旗。 竖直的蓝线是否与图表时间或经纪商时间相关? 不,竖直的蓝线显示的是您所选时区的当前时间。此产品是独立运行的,与经纪商时间无关。 我们还有什么? 我们还提供了 Session Break Out 产品——这是由 Forex Time Zone 衍生出的高级版本。此工具专为突破交易策略设计,可将您的交易提升到新
FREE

Market Depth Pro:终极订单流与市场微观结构终端 停止交易历史。开始交易实时拍卖。 Market Depth Pro 将您的标准 MetaTrader 5 图表彻底转变为专业级订单流和市场微观结构终端。这款多合一工具专为严肃的日内交易者和剥头皮交易者设计,通过分析逐笔报价(tick-by-tick)数据,准确揭示机构在哪里买入、卖出以及诱捕散户交易者。 在实时中查看真实德尔塔(Delta)、追踪交易量并解读市场叙事。 逐笔订单流与市场深度(DOM): * 实时追踪激进买家与卖家的对决。 以堆叠水平柱状图的形式,直接在图表上可视化足迹(Footprint)风格的市场深度数据。 即时识别 控制点(POC) 并计算买入/卖出德尔塔(Delta),以显示谁真正掌控市场。 动态成交量分布: * 在图表左侧生成无延迟的视觉直方图。 精准定位高成交量节点和重磅机构支撑/阻力区,让您确切知道价格会在哪里产生反应。 自动SMC市场叙事: * 积极扫描多个时间周期以勾勒价格行为(Price Action)逻辑。 在图表上自动打印关键事件标签: 流动性获取(Liq
FREE

画一条水平线。每根K线收盘后,Line Sweep Watch 会告诉您价格是扫过了它(影线穿过、K线收回线内),还是突破了它(K线收在线外)。仅触碰不会提醒。 免费。它基于您自己画的水平线工作:不会自行寻找价位,不提供入场信号,也不承诺任何盈利。 使用方法
1. 在您的价位上画一条水平线。
2. 点击该线,然后按 Track line(图表右上角)。
3. 查看图表左边缘、该线正上方的标签,或等待K线收盘时的提醒。 标签含义
- H1 · watching since 14:05 · untouched — 尚未发生任何事件。
- H1 · swept ×2 · last 15:00 — 已被扫过两次;该线仍在监视中。
- H1 · broken 16:00 · stopped — 有K线收在线外;监视已停止。按 Restart 或移动该线即可重新监视。
在线上,圆点标记每根扫荡K线,叉号标记突破K线。将鼠标悬停在标记上可查看详情,悬停在标签上可查看其所属的线。相邻线的标签会依次叠放,绝不重叠。 规则(仅限已收盘K线)
- 价位在价格上方:收盘高于该线为突破;否则最高价高于该线为
FREE

XAUUSD Reaper 是一款专为 MetaTrader 5 上的黄金(XAUUSD)开发的交易指标。 该指标旨在通过直接在图表上显示清晰的 BUY 和 SELL 信号,简化图表分析。它为交易者提供一个有条理的可视化环境,用于跟踪 XAUUSD 的价格走势,并识别市场方向可能发生的变化。 XAUUSD Reaper 可用于任何时间周期。 推荐时间周期:M15 建议在一般使用中采用 M15 时间周期,因为它能够提供实用的黄金日内走势视图,同时保留足够的市场结构用于信号分析。 XAUUSD Reaper 的工作方式 XAUUSD Reaper 会持续分析 XAUUSD 的价格状况,并在其内部条件得到确认时显示信号。 BUY 和 SELL 信号会以可视化方式直接显示在图表上,使交易者无需持续监控每一次价格波动,也能识别所检测到的市场方向。 该指标适用于手动交易和市场分析。它不会自动开仓或管理交易。 最终是否进入或退出市场的决定始终由交易者自行作出。 主要功能 • 专为黄金 / XAUUSD 开发 • 适用于 MetaTrader 5 • 支持所有时间周期 • 推荐时间周期:M15 •
FREE

Quant Institutional SMC 是一款用于 MetaTrader 5 的 Smart Money Concepts 可视化指标。该指标通过十二个机构级模块解读价格行为,并将结果以多层图表叠加加上驾驶舱仪表板的形式呈现。
该指标完全为可视化工具。不下单,不触发交易。仅读取价格历史并将关键信息一目了然地呈现。
指标检测内容: - 市场结构事件(BOS 和 CHoCH) - 订单块(多头和空头,每侧最多五个) - 公允价值差距(三柱缺口检测,经 ATR 过滤) - 等高点与等低点(流动性池聚类) - 流动性扫荡,具有 FRESH / SWEPT / EXPIRED 生命周期 - 溢价区与折扣区,带 50% 平衡线 - OTE 回撤水平 0.618、0.705、0.79 - 诱导形态(主流动性前的次级枢轴) - 突破块,具有 FORMING / ACTIVE / FAILED 状态 - 缓和块(失败的订单块,带斜线标记) - 多周期偏向(可配置高周期,基于 EMA) - 24 格小时机会热图
仪表板显示内容: - 信号总数及质量分布(Premium、High、Medium
FREE
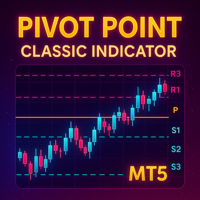
Detailed Description: The Pivot Point Classic Indicator is designed for traders who rely on classic pivot points and midpoints levels for their trading strategies. By automatically calculating and plotting these levels, the indicator provides a clear, visual representation of critical price areas where the market may reverse or break out. Key Features: Automatic Pivot Point Calculations : Automatically calculates pivot points, three support (S1, S2, S3) and resistance (R1, R2, R3) levels bas
FREE

UZFX-Alpha Strike Signals v2.0是一款专业级市场分析工具,旨在精准清晰地识别高概率交易机会。该先进指标融合了精密的价格行为识别与动态风险管理可视化功能,直接在图表上呈现清晰的买入与卖出信号。 注意:结合使用 { LTL 164343 } 指标,可提高获胜信号的准确率。 利用 LTL 信号判断趋势,并以 Alpha 信号作为入场信号。 这种方法将最大限度地提高您的胜率,并有助于避免误判信号。 工作原理 该指标通过识别特定K线形态来分析市场结构,这些形态预示着潜在趋势反转或延续。当这些形态符合专有算法条件时,指标将生成清晰视觉信号:
• 买入信号(蓝色箭头)出现在市场底部,表明看涨动能显现 • 卖出信号(红色箭头)出现在市场顶部,确认看跌压力形成
交易者核心优势 1. 清晰可执行的信号 无需解读猜测——信号位置直接在图表上显示箭头
色彩编码信号(买入蓝标/卖出红标)实现即时识别
可配置信号灵敏度以匹配您的交易风格
2. 完整交易管理可视化 信号出现时,指标自动绘制:
入场点位——最佳建仓价格
止损位——基于近期价格走势的保护性位
多级止盈位(1
FREE

Haven RSI Candlestick 是一款创新的技术指标,它将传统的相对强弱指数 (RSI) 线形图转化为直观的蜡烛图(K线)形式。
该工具专为依赖技术分析的交易者设计,旨在帮助他们更快速、更深入地解读市场动量和潜在的反转点。 其他产品 -> 此处 . 主要特点: RSI 可视化为蜡烛图: 核心功能。您现在可以直接在RSI窗口中应用价格行为 (Price Action) 和蜡烛图形态分析(例如,吞没形态、十字星),从而更早地发现动量变化的信号。 结合经典分析与RSI动态: 将主图表上的蜡烛图形态与RSI蜡烛图的形态进行相互验证。当价格图和RSI图同时出现相似的反转信号时,交易的可靠性将显著提高。 适用于所有交易品种和时间周期: 无论您交易外汇、股票、加密货币还是商品,该指标都能在从M1到MN的任何时间周期上稳定运行,满足不同风格交易者的需求。 简洁清晰的界面: 指标在单独的副图窗口中显示,不会干扰您的主价格图表。显示结构简单,无冗余信息,让您能专注于核心数据分析。 实际应用场景: 该指标在以下交易场景中尤其有用: 识别超买和超卖区域: 当RSI蜡烛进入极端区域(通常是70以上
FREE

Stoch RSI Band Fill 是一款适用于 MetaTrader 5 的 Stochastic RSI 指标。MT5 没有内置的 Stoch RSI,本指标补上了这一项。它采用与 TradingView 内置 Stoch RSI 相同的计算步骤,并使用相同的布局:K 线和 D 线、80 / 50 / 20 水平线,以及上下水平线之间的阴影带。
计算步骤 1. 对所选价格(默认:close,周期 14)计算 RSI,并用 Wilder 方法(RMA)平滑。第一个平均值是前 14 个价格变化的简单平均。 2. 在 Stochastic Length(默认 14)范围内计算该 RSI 的随机值:100 x (RSI - 最低 RSI) / (最高 RSI - 最低 RSI)。 3. K = 随机值的 SMA(默认 3)。D = K 的 SMA(默认 3)。 当窗口内的最高 RSI 与最低 RSI 相等时,分母为零(价格没有变动时会出现这种情况)。此时保留前一个值,这与 TradingView 的做法相同。
与 TradingView 的比较 - 我们使用 TradingView
FREE

SMC Fair Value Gap Detector 是一款专为 MetaTrader 5 开发的 Smart Money Concepts (SMC) 价格失衡区检测指标 (BISI / SIBI)。
公允价值缺口 (FVG) 源于机构订单的大幅三根K线位移,银行算法通常会将价格回调至失衡区重新提供流动性。
核心功能: • 动态ATR波动率过滤,自动排除微小杂波。 • 自动绘制 50% Consequent Encroachment (C.E.) 机构均衡线。 • 严格基于已收盘K线确认,绝不重绘。 • 价格触及FVG或穿透50% CE时即时声音弹窗警报。 • 图表极简 Cyber HUD 仪表盘,显示当前点差与活跃缺口数。 • 100% 免费,原生轻量代码,无任何外部DLL。
需要手机端推送通知 (Push) 与多周期 (MTF) 分析? 请在 MQL5 卖家主页中查看高级版本 "SMC Fair Value Gap Pro": - 手机端即时 Push 警报推送 (iOS / Android)。 - 多周期 (MTF) 高级结构共振与深度历史回溯。 - 无限制活跃失衡区
FREE

VaultEdge FVG 一款面向 MetaTrader 5 的、以市场结构为驱动的公允价值缺口(Fair Value Gap)指标。它用多因子引擎为每一次回踩机会评分,并仅在收盘 K 线上确认入场——让您清楚知道该交易什么,以及为什么交易。 大多数 FVG 交易者都遇到过这一刻:价格回到缺口,但决策依然不明朗。VaultEdge FVG 正是为此而生。它确认结构突破,找出最有可能守住的缺口,按七项标准为其评级,并且只有当合格 K 线的收盘确认回踩时才触发。入场价、止损以及三个止盈目标都会绘制在图表上。决策权在您手中——分析已经为您完成。 概述 引擎分两个阶段运行。第一阶段,它跟踪枢轴高点与低点,等待具有说服力的结构突破——BOS 延续或 CHoCH 反转。突破一经确认,引擎便扫描突破序列,寻找在位移过程中形成的公允价值缺口。每个候选缺口都按七个维度评分:与突破水平的接近度、相对 ATR 的大小、位移强度、形成时的成交量、在交易区间内的位置、新鲜度,以及先前触碰次数。 第二阶段,得分最高的缺口被武装(armed)。引擎在每根收盘 K 线上监测有效回踩——一次带有方向意图的回归。四
FREE

This tool was developed to help traders on candle by candle and replay training. In the indicator settings, the user can set the training start datetime. The indicator will autommatically hide all candles after this datetime. So the user can make studies before starting the training. Starting the training, the user can simulate your trades quickly and easily!
This is a product developed by Renato Fiche Junior and available to all MetaTrader 5 users!
Input Parameters
Training Start - training
FREE

FIBONACCI WITH AVG 250 — автоматические уровни Фибоначчи по экстремумам за 250 баров. Индикатор сам находит максимум и минимум за последние 250 баров и строит по ним полноценную сетку Фибоначчи с ценовыми метками: 0 / 23.6 / 38.2 / 50 / 61.8 / 78.6 / 100%. ЧТО ДЕЛАЕТ ИНДИКАТОР: • Автоматически определяет High/Low за период 250 баров и строит уровни Фибоначчи • Показывает цену каждого уровня прямо на линии • Определяет направление тренда текущего таймфрейма (Trend: Up/Down) • Выводит фильтр вола
FREE
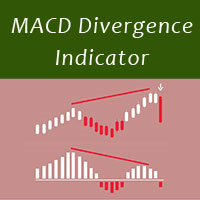
MACD divergence indicator finds divergences between price chart and MACD indicator and informs you with alerts (popup, mobile notification or email) . Its main use is to find trend reversals in the chart. Always use the divergence indicators with other technical assets like support resistance zones, candlestick patterns and price action to have a higher possibility to find trend reversals. Three confirmation type for MACD divergences: MACD line cross zero level Price returns to previous H/L Crea
FREE

Sweep Liquidity GP Sweep Liquidity GP is a price action indicator designed to identify institutional liquidity sweeps around key swing highs and lows. It detects Bullish and Bearish Sweeps, highlights important liquidity levels, and displays confirmed sweep signals with customizable lines, swing markers, and alerts. Designed to help traders identify potential liquidity grabs and market reversal opportunities.
FREE
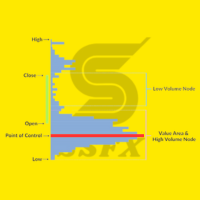
The indicator works to convert normal volume into levels and determine financial liquidity control points.
It is very similar in function to Fixed Volume Profile.
But it is considered more accurate and easier to use than the one found on Trading View because it calculates the full trading volumes in each candle and in all the brokers present in MetaTrade, unlike what is found in Trading View, as it only measures the broker’s displayed prices.
To follow us on social media platforms:
telegram
FREE

SMC Zones 仅根据已收盘的K线在图表上标记 Fair Value Gaps (FVG) 和 Order Blocks (OB),默认只显示距离当前价格最近的未回补区域。 主要功能 基于三根已收盘K线识别 FVG,并可按 ATR 倍数和点数设置最小尺寸过滤。 Order blocks:形成 FVG 的那段走势之前最后一根反向K线。 不重绘:区域一旦出现便不会移动或消失,除非被价格回补。 可选显示更高时间周期的区域,以虚线边框绘制。 与图表背景色混合的透明填充、细边框,可选 50% 中线和简短标签。 三种回补规则(Full、Half、Touch);已回补区域可删除、淡化或保留。 新区域出现及价格进入可见区域时提醒,支持弹窗、推送通知或声音。 四个缓冲区提供最近的未回补看涨和看跌 FVG,可在EA中通过 iCustom 读取。 如何解读 绿色区域为看涨 FVG,红色为看跌 FVG,青色为看涨 order block,橙色为看跌 order block。实线边框表示图表时间周期,虚线边框表示更高时间周期。鼠标悬停在区域上会显示品种、方向、类型、时间周期和价格范围。可见区域的选择在每根新
FREE

Goal Renko 在您常用的K线图上标出黄金(XAUUSD)的 Renko 波浪完成反转形态的位置。您可以向后滚动图表,查看每个信号最后的结果。它在内部用图表K线的收盘价构建传统 Renko 砖块,因此不需要离线或自定义的 Renko 图表。每个信号以 BUY 或 SELL 标签显示在它出现的那根K线上。 它可以独立使用,没有时间限制。它不会开仓、管理或平仓。 图表上显示的内容 当两点波浪形态完成时,会出现 BUY 和 SELL 标签。带对勾的标签通过了内置的附加过滤器;颜色较淡、不带对勾的标签没有通过。标有 3P 的标签来自三点形态。每个已确认的信号都有一个细框突出显示。 对于每个被统计的信号,指标会画出一笔带固定止损和止盈的模拟交易:入场箭头、目标区域、止损区域,以及出场处的小结果标签(例如 #12 +15 或 #13 -15)。模拟交易结束时区域会变色,因此您可以向前翻看,研究每个信号的结局。 统计表汇总这些模拟交易:交易数、盈利笔数、亏损笔数、胜率、净点数、盈利因子、每笔平均、最长连续亏损、BUY 和 SELL 的结果,以及在模拟交易持仓期间被跳过的信号。可选的 Forwa
FREE

Quant Supply & Demand Pro: Institutional Structure Levels Quant Supply & Demand Pro is a high-performance MQL5 indicator designed for traders who prioritize Clean Charts and Institutional Logic. Instead of flooding your screen with noise, this algorithm scans market structure to identify high-probability "Smart Money" imbalances—Supply and Demand zones where price is highly likely to react. This tool is built for the trader who is tired of over-complicated "black box" indicators. This isn't an a
FREE

DeltaDOM v2.0 — Volume Profile + DOM + Delta Volume Professional Order Flow Analysis for MetaTrader 5 DeltaDOM is a real-time order flow indicator that combines three powerful tools in a single high-performance panel: Volume Profile, Depth of Market (DOM), and Delta Volume — giving you a complete picture of market structure and buying/selling pressure at every price level. VOLUME PROFILE Up to 80-row resolution over up to 200 bars VPOC (Point of Control) — highest-volume price level Value Area H
FREE

Daily Entry M1 – MT5 指标 Daily Entry M1 是一款为 MetaTrader 5 开发的指标,专为专注于 M1 时间周期短线日内交易机会的交易者设计。 该指标会分析市场状况,并在其内部入场条件得到确认后,直接在图表上显示清晰的 BUY 和 SELL 箭头。 该指标旨在寻找潜在的市场转折区域,并尝试识别接近日内顶部或底部的入场机会,帮助交易者专注于可能的反转机会,而不是随机的市场位置。 每个交易箭头都带有其自身预设的目标水平,使交易者能够立即看到与该特定信号相关的目标。 Daily Entry M1 的主要目标是提供一个简洁且实用的交易环境,让交易者能够快速识别入场信号及其对应目标,而不会让图表变得过于复杂。 free expert Group: https://www.mql5.com/en/messages/01d5acd1bb56dd01/edit
主要功能 专为 MetaTrader 5 设计 针对 M1 时间周期进行优化 清晰的 BUY 和 SELL 入场箭头 尝试识别接近潜在市场顶部和底部的入场机会 专注于可能的日内反转区域 每个箭头都包
FREE
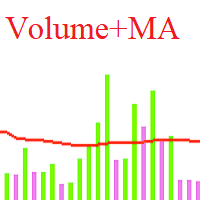
Volumes with Moving Average (带移动平均线的成交量)是一个简单明了的成交量指标,并辅以移动平均线。
如何使用?
它非常适合在从支撑/阻力位以及趋势通道的波动突破口进入交易时过滤信号。它也可以作为通过成交量平仓的信号。
输入参数:
Volumes - 真实或刻度线成交量。 MA_period - 移动平均周期。
Volumes with Moving Average(带移动平均线的成交量)是一个简单明了的成交量指标,并辅以移动平均线。
如何使用?
它非常适合在从支撑/阻力位以及趋势通道的波动突破口进入交易时过滤信号。它也可以作为通过成交量平仓的信号。
输入参数:
Volumes - 真实或刻度线成交量。 MA_period - 移动平均周期。
FREE

BEHOLD!!!
One of the best Breakout Indicator of all time is here. Multi Breakout Pattern looks at the preceding candles and timeframes to help you recognize the breakouts in real time.
The In-built function of supply and demand can help you evaluate your take profits and Stop losses
SEE THE SCREENSHOTS TO WITNESS SOME OF THE BEST BREAKOUTS
INPUTS
MaxBarsback: The max bars to look back
Slow length 1: Period lookback
Slow length 2: Period lookback
Slow length 3: Period lookback
Slow leng
FREE

当市场的价格走势逆转并改变方向时,我们的支撑位或阻力位就形成了,在市场上留下了一个高峰或低谷(摆动点)。支撑位和阻力位可以划出交易区间。该指标根据指标集中定义的 X 根柱线数 (Period) 识别摆动高点和摆动低点。
注意:如果您喜欢我们的价格行为指标,请尝试我们的多合一趋势指标(趋势筛选器、趋势线、强趋势和趋势反转信号等)。 要获取它, 请单击此处
主要特点 技术分析的一个关键概念是,当阻力位或支撑位被突破时,它的作用就会逆转。如果价格跌破支撑位,该位将成为阻力位。如果价格升至阻力位以上,则通常会成为支撑位。 水平支撑和阻力水平是这些水平中最基本的类型。它们只是由一条水平线标识:
图表中的绿色水平,是阻力水平。 图表中的红色水平,是支撑水平。
我们的支撑位和阻力位用于确定价格趋势更有可能停止并可能改变方向的关键水平。它可以是特定的价格或价格区域。对水平重要性程度的解释取决于交易者的时间框架。
文件(说明) 所有 PR 支撑和阻力指标、文档(说明)均可在我们 MQL5 博客的这篇文章中找到: 单击此处。
优势 处理所有货币对(外汇、加密货币、指数和商品) 处理所有时
FREE
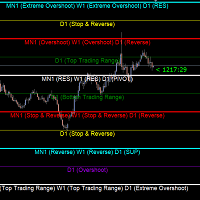
Gold Levels MTF - this is a fine stock technical indicator. The indicator algorithm analyzes the movement of the asset price, displays price levels of support and resistance from all time frames (TF) using the Murray method based on the Gann theory. The indicator indicates overbought and oversold fields, giving an idea of possible reversal points and at the same time giving some idea of the strength of the current trend.
Description of levels: (Extreme Overshoot) - these levels are the ultimate
FREE

Sentinel Gold Signals is a free, NON-REPAINTING buy/sell signal indicator for Gold (XAUUSD) - and it works on any symbol and any timeframe. It does one thing, cleanly: a green arrow under a bar for a BUY, a red arrow above a bar for a SELL. Every signal is confirmed on the CLOSE of the bar and never moves, disappears or "repaints" afterwards - what you see in history is exactly what you would have seen live. An on-chart panel shows your LAST 3 SIGNALS (direction, price, and how long ago) at a gl
FREE
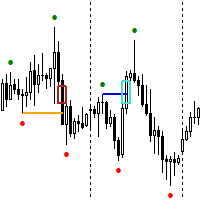
Next Arrival : Flip or Die Trading Arena. Flip a trading account: https://flipordie.com/chapter-1-thirteen-doublings-double-a-trading-account/ YouTube Channel: https://www.youtube.com/@trenddaytrader FREE EA for GOLD , Anticipation can be found here: https://www.mql5.com/en/market/product/123143
The Expert Advisor for this Indicator can be found here: https://www.mql5.com/en/market/product/115476 The Break of Structure (BoS) and Change of Character indicator with Fair Value Gap (FVG
FREE

PHSB Elliott Wave — MT5 艾略特波浪指标 通过艾略特波浪识别市场结构 PHSB Elliott Wave 是一款专为 MetaTrader 5 开发的指标,旨在帮助交易者直接在图表上识别和跟踪**艾略特波浪(Elliott Wave)**结构。 该指标的目标,是将一种有时具有较强主观性的理论,转化为一种 更加客观、直观和系统化的价格结构分析方式 。 PHSB Elliott Wave 并不是简单地寻找孤立的形态,而是通过跟踪**市场枢轴点(Pivot)**的形成,利用这些关键点构建并验证可能的艾略特波浪结构。 指标是如何工作的? 市场不断形成新的 高点和低点 。 PHSB Elliott Wave 利用这些价格变化来识别市场中的主要 结构性枢轴点 。 基于这些枢轴点,指标尝试寻找艾略特波浪的典型结构: 1 → 2 → 3 → 4 → 5 例如,在一个上升推动浪结构中: 第1浪: 上升运动的开始
第2浪: 对第1浪的回调
第3浪: 扩张性上涨,通常是最强的一浪
第4浪: 再次进行调整
第5浪: 推动结构中的最后一段上涨 推动浪完成后,市场可能进入调整结构,通常表示为
FREE
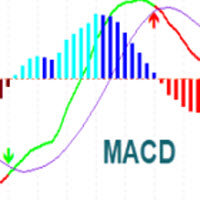
MACD Indicator It has MACD line, Signal line, and Histogram. The Histogram has 4 colors based on Direction Above and Below the Zero Line, showing its movement direction as simple as possible. Allows Show MACD & Signal Line, Show Change In color of MACD Line based on cross of Signal Line. Show Dots at Cross of MacD and Signal Line, Turn on and off Histogram. Enjoy your trading experience, and feel free to share your comments and reviews.
If you are interested in this indicator, you might be i
FREE

一款免费的 MetaTrader 5 倒计时工具。挂到任意图表上,它就会显示当前这根 K 线还剩多少时间收盘、K 线成型过程中的进度条,以及同时显示其他周期(M5 到 D1)的实时倒计时。精确到秒,而且不碍事。 它显示什么 距离收盘的准确时间。 针对当前图表周期的大号实时倒计时,每秒跳动一次,最后几秒会高亮。 进度条。 一眼看出当前这根 K 线已经走了多少。 M5 到 D1 一起看。 M5、M15、M30、H1、H4、D1 的实时倒计时排成一个列表,每个周期一行,不用切换图表就知道哪个周期下一根什么时候收。列出哪些周期由你决定。 为什么有用 按 K 线收盘来安排进出场,而不是凭感觉估。 在小周期上操作时,知道大周期的 K 线马上就要收了。 按服务器时间校准,所以倒计时和你的经纪商那边真实的 K 线收盘时刻一致。 它不做什么 不发信号、不做预测、绝不交易。它就是一个时钟,仅此而已。不重绘。 面板可拖动、可锁定,并始终完整地留在屏幕内。适用于任意品种和任意周期。免费使用。如果它值得留在你的图表上,欢迎留下评价,或者告诉我还想加点什么。
FREE

Support Resistance Volume Boxes is a MetaTrader 5 indicator that identifies important support and resistance areas using pivot points and volume analysis. The indicator displays dynamic support and resistance boxes on the chart. Each box represents a price area where market activity has been detected, while the box color intensity reflects the relative volume strength. This helps traders analyze potential reaction zones, monitor price structure, and observe important areas where buying or sellin
FREE

Alpha StepRSI Pro with Dynamic Zones & Mobile Alerts MT5 Non-Repainting Step RSI with Probability Dynamic Zones and Instant Push Alerts
### Overview Alpha StepRSI Pro MT5 is an institutional-grade momentum oscillator designed to filter out consolidation market noise and pinpoint high-probability trend continuation and exhaustion turns. Traditional RSI curves often produce false signals during ranging markets. Alpha StepRSI Pro solves this by quantizing momentum changes into discrete mathematic
FREE

一款免费的 MetaTrader 5 整数关口指标。挂到任意图表上,它就会画出交易者关注的心理整数价位:整数大关用实线,每一条都标注价格;大关之间的半档用虚线。行情移动时会自动跟随价格。 它做什么 替你画好整数关口。 当前价格附近的整数大关和半档都会画出来,不必再手动标记。 自动适配品种。 它会读取价格,自行选择约为价格 1% 的整数间距:按今天的价格,EURUSD 是 100 点,黄金是 50 美元,US30 是 500 点。间距也可以自己设定。 带标注,易读。 每条主要关口都显示价格,标注位置经过安排,浅色和深色配色下都能看清。 跟随价格。 行情进入新的区间时,关口会自动重新居中。 与 Daily Weekly Monthly Key Levels 的区别 那款画的是已收盘周期的高低点(前一日、前一周、前一月)。这款画的是吸引价格的整数关口。两者回答的问题不同,可以同时使用。 它不做什么 不发出交易信号,不做行情预测,也绝不下单。它只画关口,仅此而已。不重绘。 面板可拖动、可锁定,并始终完整地留在屏幕内。适用于任意品种和任意周期。免费使用。如果它帮你省去了手动标记整数关口的功夫,留
FREE

该指标显示当前交易品种的盈利(亏损)。 您可以自由拖放线条来显示当前的盈利或亏损。 You can find my products here .
参数 Calculation in money or in points — 以点数或货币计算利润/损失。 Add pending orders to calculate — 在计算中考虑挂单。 Magic Number (0 - all orders on symbol) — 幻数,如果需要评估特定订单。 Offset for first drawing (points from the average price) — 线距第一次开始时的平均价格的偏移量。 Decimal places for calculating the Sum — 显示总和的小数点后的位数。 Decimal places for calculating the Percentage — 显示百分比的小数点后的位数。
Tuning 调音 Color of the profit line — 利润线的颜色。 Color of the loss line
FREE

Daily VWAP Indicator (Volume Weighted Average Price) Special Deal! Leave a review and get the indicator Long & Short Cointegration Analyzer for free — just send me a message!
Description The Daily VWAP (Volume Weighted Average Price) indicator is an essential tool for traders seeking to identify the true average price of an asset throughout the day, adjusted by traded volume. Primarily used by institutional and professional traders, the daily VWAP serves as a reference point to identify the av
FREE

GTM FVG and Order Block Zones 在 MetaTrader 5 图表上以区域形式绘制公允价值缺口(FVG)和订单块,同时标出 BOS / CHoCH 以及当前走势的强、弱高点和低点。一个小面板显示趋势、价格上方和下方最近的区域,以及价格当前所在的区域。 这是一个免费的看图工具。它不交易,也不给出买入或卖出信号。 区域只在已收盘的K线上寻找
确认区域的那根K线收盘后,区域才会出现。之后它不会移动,也不会从历史中消失:只有被突破时才结束。只有当您更改影响寻找方式的设置(例如 FVG 的测量方法)时,区域才会重新计算。 公允价值缺口 公允价值缺口是由三根K线组成的形态:第一根和第三根K线不重叠,中间那根K线穿过留下的空隙。 两种测量方式: Wicks (ICT 定义,第 1 根K线影线与第 3 根K线影线之间的空隙)或 Bodies (K线实体之间的空隙)。在面板上切换。 很小的缺口可以不显示:最小尺寸为 ATR(14) 的一个比例,默认 0.15。设为 0 则全部显示。 可选的虚线标出每个缺口的中点(50%)。 订单块 当一根
FREE

Smart Entry Hulk KPG – MT5 H-Band 与 Trend 多时间框架指标 总体描述 Smart Entry Hulk KPG 是由 Billion KPG Club 为 MetaTrader 5 开发的技术分析指标。它结合了 H-Band 的平滑特性与 Trend 算法的方向逻辑。 通过将 Trend 计算应用于平滑的 H-Band 数据,该工具旨在过滤市场噪音并提供趋势方向的清晰视觉表示。它具有多时间框架 (MTF) 仪表板、更高时间框架 (HTF) 数据注入以及“力量聚合 (Force Aggregation)”摘要,以协助交易者分析不同时间框架下的市场状况。
主要功能 - H-Band 变体:支持多种计算模式(标准、指数、三角),以适应不同资产的波动性。 - H-Band 上的 Trend:将基于 ATR 的 Trend 逻辑直接应用于 H-Band 计算,从而产生更平滑的趋势视觉表示。 - 多时间框架 (MTF) 仪表板:同时显示多达 8 个可自定义时间框架的当前趋势状态。 - 力量聚合 (Force Aggregation) 摘要:通过聚合所选时
FREE

Quantum Intraday KPG – 日内/波段买卖信号指标,带多时间周期预测表 Quantum Intraday KPG 是一款适用于 MT5 的指标,基于价格、成交量与波动性的结合,帮助识别短期(日内)和中期(波段)趋势。该指标专注于清晰、易于使用的信号,无需深入的编程知识。
主要优势
1. 自适应动态趋势线 - 绿线表示上升趋势。 - 红线表示下降趋势。
2. 箭头反转信号 - 当趋势改变时,指标立即在图表上绘制绿色向上箭头(潜在上涨)或红色向下箭头(潜在下跌)。 - 箭头与K线的距离基于ATR计算并可调节。 - 建议在 M5、M15、M30 或更高时间周期上使用该指标(避免使用 M1,因为噪音较大)。
3. 多时间周期预测表 - 同时显示9个时间周期:M1, M3, M5, M15, M30, H1, H2, H4, D1。 - 每个周期显示当前趋势:买入(绿色)、卖出(红色)或N/A(灰色)。 - 汇总行显示基于加权时间周期的买入/卖出百分比,快速把握整体趋势。
4. 全面的警报系统 - 支持弹窗、声音(自定义.wav文件)、电子邮件以及通过MT5应用推送
FREE
MetaTrader市场是 出售自动交易和技术指标的最好地方。
您只需要以一个有吸引力的设计和良好的描述为MetaTrader平台开发应用程序。我们将为您解释如何在市场发布您的产品将它提供给数以百万计的MetaTrader用户。
