UTBot Alerts
- Indicatori
-
Ulises Calderon Bautista
 I am a candidate for Actuary with a strong expertise in the field of insurance and social security, in addition to being an active investor with a talent for mathematics. My passion for programming and finance drives my constant pursuit of learning and improvement.
 - Versione: 1.0
Faithful MQL5 & MQL4 conversion of the legendary "UT Bot Alerts" indicator by QuantNomad from TradingView.
Originally developed by Yo_adriiiiaan with the core idea by HPotter, and refined into Pine Script v4 with alerts by QuantNomad (Vadim Cissa) — one of the most followed quant developers on TradingView with over 100K followers. The original script has accumulated 1.1 million+ views and 35,500+ favorites on TradingView, making it one of the most popular open-source trading indicators ever published.
This conversion replicates the original algorithm with 100% logical fidelity: same 4-branch recursive trailing stop, same crossover detection, same signal generation. Non-repainting on closed bars.
What is UT Bot Alerts?
UT Bot Alerts is a trend-following signal system built on a single, elegant concept: an adaptive trailing stop that uses the Average True Range (ATR) to dynamically adjust its distance from price.
When price is trending up, the trailing stop ratchets upward and never moves down — protecting gains. When price is trending down, the stop ratchets downward and never moves up. When price crosses the trailing stop, the system flips direction and generates a Buy or Sell signal.
The result is a clean, responsive indicator that:
- Identifies trend direction with a color-coded trailing stop line
- Generates precise entry signals at trend reversals
- Adapts automatically to market volatility via ATR
- Works on any instrument (Forex, Crypto, Stocks, Commodities, Indices)
- Works on any timeframe (M1 to Monthly)
Think of it as a smarter, ATR-adaptive version of a Supertrend indicator that uses closing price instead of the midpoint (High+Low)/2.
How the Algorithm Works
The indicator calculates three things on every bar: (1) an adaptive trailing stop, (2) the current trend state, and (3) buy/sell crossover signals.
Step 1 — ATR and Loss Distance
The Average True Range (ATR) is calculated using Wilder's smoothing method (RMA) over the configured period. The trailing stop distance is defined as:
nLoss = Key Value × ATR
A higher Key Value places the stop farther from price (fewer signals, less noise). A lower Key Value places it closer (more signals, faster reaction).
Step 2 — The 4-Branch Recursive Trailing Stop
This is the core of the algorithm. On every bar, the trailing stop is updated using four mutually exclusive conditions:
Branch 1 — Uptrend Continuation: If the current price AND the previous price are both above the previous trailing stop, the stop can only move upward. It is set to the maximum of the previous stop and (current price - nLoss). This "ratchet" mechanism locks in gains as price rises.
Branch 2 — Downtrend Continuation: If the current price AND the previous price are both below the previous trailing stop, the stop can only move downward. It is set to the minimum of the previous stop and (current price + nLoss). The stop follows price down, tightening on rallies.
Branch 3 — Bullish Reversal: If the current price crosses above the previous trailing stop (but the previous price was below), the stop resets to (current price - nLoss), initiating a new upward trailing sequence.
Branch 4 — Bearish Reversal: If the current price crosses below the previous trailing stop (but the previous price was above), the stop resets to (current price + nLoss), initiating a new downward trailing sequence.
Step 3 — Signal Detection
Buy and Sell signals are generated using crossover detection between the source price and the trailing stop:
- Buy Signal = Price crosses above the trailing stop (price was below on the previous bar, now it is above)
- Sell Signal = Price crosses below the trailing stop (price was above on the previous bar, now it is below)
Signals fire exactly once per crossover event. They do not repaint on closed/confirmed bars.
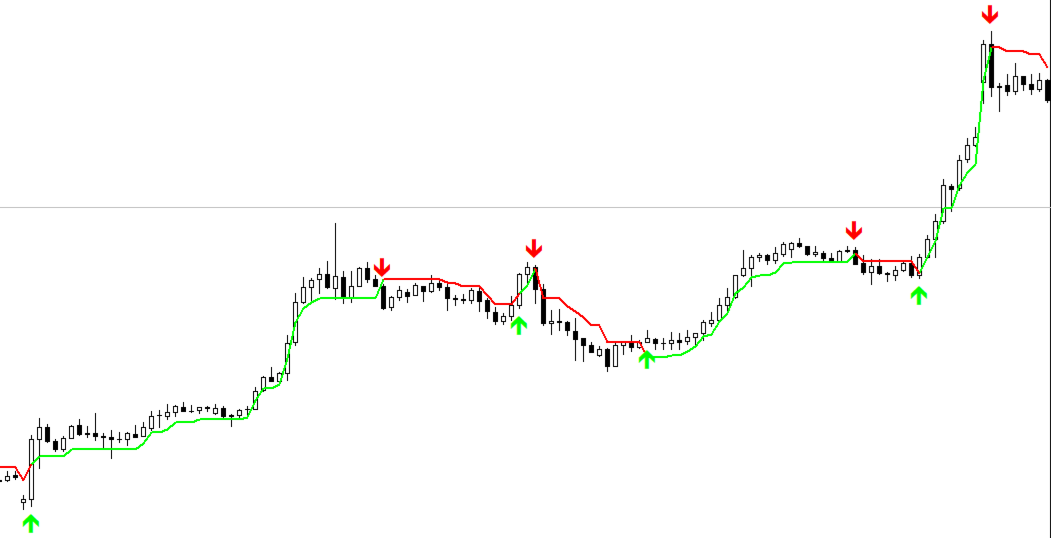
Step 4 — Visualization
The indicator displays:
- Trailing Stop Line — Color-coded by trend direction: green during uptrend (long), red during downtrend (short), blue during neutral/undefined state
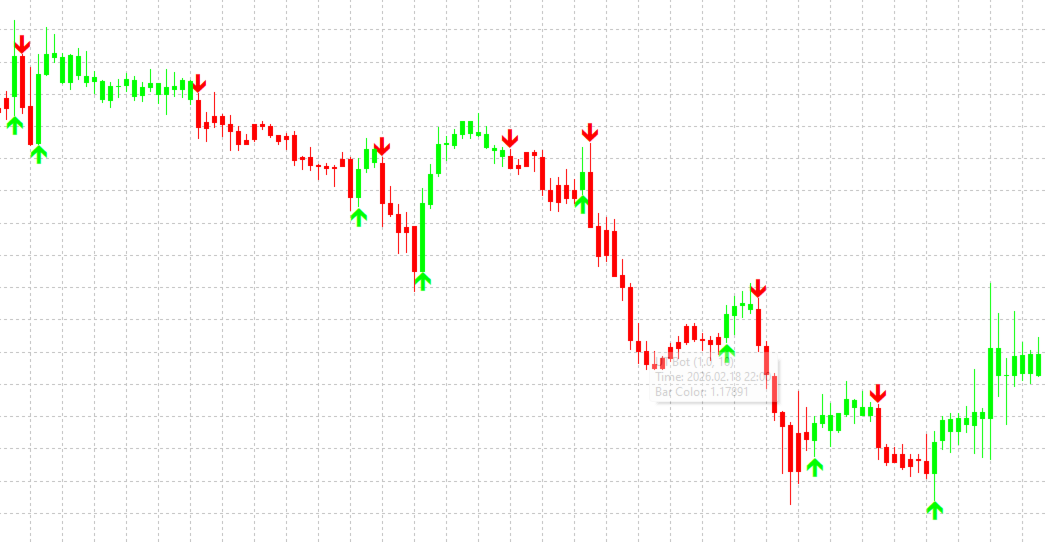
- Buy Arrows — Green upward arrows below the signal bar
- Sell Arrows — Red downward arrows above the signal bar
- Bar Coloring (MQL5 only) — Candles are colored green when price is above the trailing stop and red when below
- Position State Buffer — Available for EA access via iCustom (value: +1 for long, -1 for short, 0 for neutral)
Input Parameters
UT Bot Core
| Parameter | Type | Default | Description |
|---|---|---|---|
| Key Value | double | 1.0 | ATR Multiplier / Sensitivity. Controls the distance of the trailing stop from price. Higher values = wider stop, fewer signals, better noise filtering. Lower values = tighter stop, more signals, faster reaction. Original HPotter defaults were 3.5; QuantNomad changed to 1.0. |
| ATR Period | int | 10 | Period for the Average True Range calculation using Wilder's smoothing (RMA). Higher values produce a smoother, slower-reacting ATR. Original HPotter default was 5; QuantNomad changed to 10. |
| Use Heikin Ashi Candles as Source | bool | false | When enabled, the indicator uses Heikin Ashi closing prices instead of regular closing prices as the source for all calculations. Heikin Ashi smooths price action and can reduce false signals in choppy markets, at the cost of slightly delayed entries. |
Visuals
| Parameter | Type | Default | Description |
|---|---|---|---|
| Show Trailing Stop Line | bool | true | Toggle the visibility of the ATR trailing stop line on the chart. The line changes color based on the current trend state (green/red/blue). |
| Show Buy/Sell Arrows | bool | true | Toggle the visibility of buy and sell signal arrows on the chart. |
| Color Price Bars | bool | true | (MQL5 only) When enabled, candles are colored green when price is above the trailing stop and red when below. Not available in MQL4 due to platform limitations. |
| Arrow Distance from Bar | int | 10 | Distance in points between the signal arrow and the bar's high/low. Increase this value if arrows overlap with candles on your chart. |
Alerts
| Parameter | Type | Default | Description |
|---|---|---|---|
| Popup Alert | bool | true | Show a popup alert dialog when a buy or sell signal is generated. |
| Sound Alert | bool | true | Play a sound when a signal is generated (alert.wav for buy, alert2.wav for sell). |
| Push Notification | bool | false | Send a push notification to your mobile device. Requires MetaTrader mobile app configured in Tools → Options → Notifications. |
| Email Notification | bool | false | Send an email notification. Requires SMTP email configured in Tools → Options → Email. |
Recommended Settings by Market
These are community-tested parameter guidelines. Always backtest on your specific instrument and timeframe before trading live.
Forex
- Stable pairs (EURUSD, USDJPY, USDCHF): Key Value 1.0–1.5, ATR Period 10–14
- Moderate pairs (AUDUSD, USDCAD, EURJPY): Key Value 1.5–2.0, ATR Period 10–14
- Volatile pairs (GBPJPY, GBPNZD): Key Value 2.0–3.0, ATR Period 10–14
Crypto
- BTC, ETH: Key Value 2.0–3.5, ATR Period 10–14
- Altcoins: Key Value 3.0–5.0, ATR Period 10–20
Commodities
- Gold (XAUUSD): Key Value 2.5–3.5, ATR Period 10–14
- Oil (USOIL): Key Value 2.0–3.0, ATR Period 10–14
Indices
- NASDAQ, S&P 500: Key Value 3.0–4.0, ATR Period 10–14
- DAX, FTSE: Key Value 2.5–3.5, ATR Period 10–14
Timeframe Guidelines
- Scalping (M1–M5): Lower Key Value (0.5–1.0) for faster reaction. More signals, more noise.
- Intraday (M15–H1): Key Value 1.0–2.0. Good balance between signal frequency and reliability.
- Swing (H4–D1): Key Value 2.0–3.5. Fewer but higher-quality signals.
- Position (W1–MN): Key Value 3.0–5.0. Long-term trend following.
How to Trade with UT Bot Alerts
Basic Strategy
The simplest approach:
- Buy when a green Buy arrow appears (price crosses above the trailing stop)
- Sell/Close when a red Sell arrow appears (price crosses below the trailing stop)
- Use the trailing stop line itself as a dynamic stop-loss level
With Trend Filter (Recommended)
Add a 200-period EMA as a trend filter to significantly reduce false signals:
- Only take Buy signals when price is above the 200 EMA (bullish macro trend)
- Only take Sell signals when price is below the 200 EMA (bearish macro trend)
With Additional Confirmation
Combine UT Bot with other indicators for higher-probability setups:
- RSI: Only take Buy signals when RSI is below 70 (not overbought), Sell signals when RSI is above 30 (not oversold)
- VWAP: Use VWAP as an institutional bias filter — Buy above VWAP, Sell below VWAP
- Volume: Require above-average volume on signal bars for confirmation
- Support/Resistance: Only take signals near key S/R levels for better risk/reward
Risk Management
- Use the trailing stop line as your initial stop-loss
- The distance between entry price and the trailing stop line = your risk per trade
- Size your position accordingly (e.g., risk 1–2% of account per trade)
- Consider using the trailing stop as a dynamic exit: close when the bar color changes from green to red (or vice versa)
Using with Expert Advisors (EAs)
The indicator exposes its data through buffers accessible via iCustom() . Here is the buffer mapping for both platforms:
MQL5 Buffer Index Map
| Buffer | Content | Values |
|---|---|---|
| 0 | ATR Trailing Stop value | Price level |
| 1 | Trail line color index | 0=Green, 1=Red, 2=Blue |
| 2 | Buy signal | Price level or EMPTY_VALUE |
| 3 | Sell signal | Price level or EMPTY_VALUE |
| 4–7 | Bar coloring OHLC | Price levels |
| 8 | Bar color index | 0=Green, 1=Red, 2=None |
| 9 | Position state | +1 (long), -1 (short), 0 (neutral) |
MQL5 Example:
int ut_handle = iCustom(_Symbol, PERIOD_CURRENT, "UTBotAlerts", 1.0, 10, false);

double buy_signal[];
double sell_signal[];
CopyBuffer(ut_handle, 2, 1, 1, buy_signal);  // Buy buffer, bar 1
CopyBuffer(ut_handle, 3, 1, 1, sell_signal);  // Sell buffer, bar 1

if(buy_signal[0] != EMPTY_VALUE)
{
   // Buy signal on last closed bar
}
if(sell_signal[0] != EMPTY_VALUE)
{
   // Sell signal on last closed bar
}
MQL4 Buffer Index Map
| Buffer | Content | Values |
|---|---|---|
| 0 | Trail line (green/long segments) | Price level or EMPTY_VALUE |
| 1 | Trail line (red/short segments) | Price level or EMPTY_VALUE |
| 2 | Trail line (blue/neutral segments) | Price level or EMPTY_VALUE |
| 3 | Buy signal | Price level or EMPTY_VALUE |
| 4 | Sell signal | Price level or EMPTY_VALUE |
| 5 | Full trail stop value (continuous) | Price level |
| 6 | Position state | +1 (long), -1 (short), 0 (neutral) |
| 7 | Source price used | Close or HA Close |
MQL4 Example:
double buy = iCustom(_Symbol, 0, "UTBotAlerts", 1.0, 10, false, 3, 1); // Buffer 3, bar 1 double sell = iCustom(_Symbol, 0, "UTBotAlerts", 1.0, 10, false, 4, 1); // Buffer 4, bar 1 if(buy != EMPTY_VALUE) { // Buy signal on last closed bar } if(sell != EMPTY_VALUE) { // Sell signal on last closed bar }
Installation
MQL5 (MetaTrader 5)
- Copy UTBotAlerts.mq5 to your MQL5/Indicators/ folder
- Open MetaEditor (F4 from MetaTrader) and compile the file (F7)
- In MetaTrader, open the Navigator panel (Ctrl+N)
- Drag "UTBotAlerts" from Indicators onto your chart
- Configure the input parameters and click OK
MQL4 (MetaTrader 4)
- Copy UTBotAlerts.mq4 to your MQL4/Indicators/ folder
- Open MetaEditor (F4 from MetaTrader) and compile the file (F7)
- In MetaTrader, open the Navigator panel (Ctrl+N)
- Drag "UTBotAlerts" from Custom Indicators onto your chart
- Configure the input parameters and click OK
Platform Differences (MQL5 vs MQL4)
| Feature | MQL5 | MQL4 |
|---|---|---|
| Trailing stop line | Single color-changing line (DRAW_COLOR_LINE) | Three overlapping colored lines (green/red/blue) |
| Bar coloring | Supported (DRAW_COLOR_CANDLES) | Not available (platform limitation) |
| ATR calculation | Handle-based (iATR with CopyBuffer) | Direct value return (iATR per bar) |
| Input groups | Supported (organized sections) | Not available (flat list with separators) |
| Algorithm & signals | Identical | Identical |
| Alerts | Identical | Identical |
Both versions produce the same signals on the same data. Any visual differences are purely cosmetic due to platform rendering.
Comparison with TradingView Original
This conversion achieves 95%+ signal match with the TradingView original when tested on the same instrument and timeframe with the same broker data. The remaining ~5% difference is attributed to:
- Data feed differences: Even the same broker may deliver slightly different OHLC values on TradingView vs MetaTrader due to aggregation methods and timestamp handling
- ATR initialization: The first few bars may differ slightly due to how each platform seeds the initial RMA/Wilder's smoothing calculation
- Floating point precision: Minor rounding differences between Pine Script and MQL runtime environments
These differences are negligible and do not affect the overall trading behavior of the indicator.
Comparison with Supertrend
UT Bot Alerts is functionally similar to the Supertrend indicator, but with key differences:
| Aspect | UT Bot Alerts | Supertrend |
|---|---|---|
| Source price | Close (or HA Close) | Midpoint (High+Low)/2 |
| Band calculation | Price ± ATR×Multiplier | Midpoint ± ATR×Multiplier |
| Trend detection | 4-branch recursive logic | 2-branch flip logic |
| Signal type | Crossover-based arrows | Line flip / color change |
| Sensitivity | Generally more responsive | Generally smoother |
UT Bot's use of Close price makes it more responsive to actual price action, while Supertrend's use of the midpoint provides slightly more stability. Choose based on your trading style and the specific market conditions.
Credits & Original Source
- Original concept: HPotter (TradingView)
- Initial development: Yo_adriiiiaan (TradingView) — UT Bot
- Pine Script v4 with Alerts: QuantNomad / Vadim Cissa (TradingView) — UT Bot Alerts
- Strategy version: QuantNomad — UT Bot Strategy
- MQL5/MQL4 conversion: Exobeacon — exobeacon.com
The original Pine Script is open-source and published under TradingView's House Rules. This MQL conversion is an independent reimplementation of the publicly documented algorithm.
Changelog
v1.20
- Fixed trail line color alignment — color change now coincides exactly with signal arrows
- Fixed visibility toggles — disabling trail line or bar coloring no longer affects signal arrows
- Separated core algorithm into internal arrays independent of display buffers
v1.10
- Fixed buffer mapping issue when toggling visual elements off
v1.00
- Initial release
- Full algorithm conversion from Pine Script v4
- Color-coded trailing stop line
- Buy/Sell signal arrows with configurable offset
- Bar coloring (MQL5)
- Heikin Ashi source option
- Configurable alerts (Popup, Sound, Push, Email)
- Position state buffer for EA integration


One of the best indicators here! In combination with other indicators very efficient! Thank you so much!