Hull Pro MTF Indicator

Dear traders this is Our new Indicator calledHull Pro MTF Indicator — Precision Multi-Timeframe Trend Visualizer


🔹 Overview

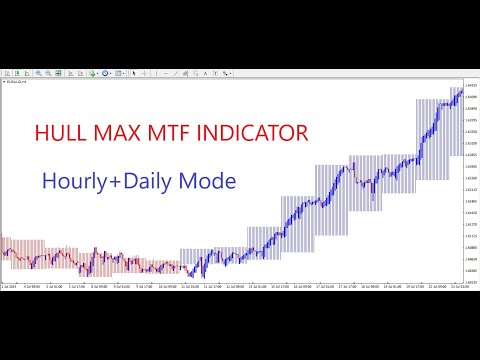
The Hull Pro MTF Indicator is a next-generation Heiken-Ashi-based multi-timeframe visual tool designed for top-down market analysis.

It blends the power of Hull Moving Average (HMA) logic and multi-level Heiken-Ashi smoothing to reveal directional bias, volatility ranges, and price symmetry across hourly, daily, weekly, monthly, and yearly structures — all in a single chart.

This indicator is ideal for traders who value precision trend confirmation, timeframe alignment, and real-time visual clarity.

🧭 Core Concept

Hull Pro MTF processes five synchronized timeframes (H1, D1, W1, MN1, and Y1) and calculates multi-layer Heiken Ashi representations for each.

Each timeframe paints its own color-coded bar overlays (red/blue) directly onto the main chart, allowing traders to see trend correlations instantly — without changing chart periods.

⚙️ Key Features

5-Tier Multi-Timeframe Display
Each chart updates dynamically across hourly, daily, weekly, monthly, and yearly data layers.

24 Buffer Framework for Precision
Internally structured with 24 indicator buffers (4 per timeframe × 6 layers) for ultra-smooth rendering and zero lag updates.

Heiken Ashi Engine Integration
All timeframe overlays are calculated using standard Heiken Ashi formulas, visually representing true smoothed momentum transitions.

Dynamic Visual Styles (4 Themes)
Choose how the indicator looks on your chart:

  • Standard: Default balanced visualization

  • Light: Minimal and chart-friendly

  • Solid: Thick, contrast-heavy display

  • Carbon: Dark mode-optimized with transparent layering

Full Multi-Mode Forecast Control
Select combinations of forecast modes such as:

  • Hourly

  • Daily

  • Weekly

  • Monthly

  • Yearly

  • Or combine them (e.g., Hourly + Daily + Weekly + Monthly + Yearly) for complete structural analysis.

Adaptive Histogram Visualization
Automatic width and color mapping per timeframe ensures clean alignment and easy pattern recognition across multiple layers.

Zero-Lag Architecture
Because Hull Pro MTF uses internal buffer synchronization instead of recursive calls, performance is fast and resource-efficient even on high-load charts.

🎯 Practical Use Cases

🔸 Top-Down Confirmation
Easily confirm if intraday structure aligns with higher timeframe bias (e.g., weekly or monthly).

🔸 Market Regime Recognition
Detect when markets transition from consolidation to trending phases by observing histogram contractions and color shifts.

🔸 Trend Continuity Forecasting
Blue = bullish strength. Red = bearish continuation. Neutral zones = trend exhaustion signals.

🔸 Swing & Position Entry Alignment
Combine with your favorite oscillators or moving averages to time entries with the macro trend.

Visual Layout Example

Timeframe Color Meaning
Hourly 🔵 Blue / 🔴 Red Intraday momentum
Daily 🔵 Blue / 🔴 Red Short-term direction
Weekly 🔵 Blue / 🔴 Red Swing bias
Monthly 🔵 Blue / 🔴 Red Trend phase
Yearly 🔵 Blue / 🔴 Red Macro structure

Each band overlays in a subtle layered pattern — giving the chart a professional market-profile-like structure with visual precision.

🧩 Settings Overview

Input Description
ForecastMode Choose active timeframe combinations (Hourly, Daily, Weekly, Monthly, Yearly, or Mix)
VisualStyle Select chart style (Standard, Light, Solid, Carbon)
Auto Width/Color Logic Automatically adjusts histogram width and colors for clarity
HeikenAshi Engine Built-in for smoother representation of OHLC data per timeframe

🧠 How It Works (Simplified)

1️⃣ The indicator reads raw OHLC data from each higher timeframe using the iBars() and iTime() series.
2️⃣ It calculates Heiken-Ashi open, close, high, and low for each bar per timeframe.
3️⃣ The results are stored in 24 independent buffers, updating live as new bars form.
4️⃣ Depending on the Visual Style, buffer widths and colors adjust dynamically for best contrast.
5️⃣ The combined effect produces a real-time top-down market trend overlay.

💡 Why Traders Choose Hull Pro MTF

⭐ All-in-one multi-timeframe clarity
⭐ Professional visual design with carbon or solid modes
⭐ In-chart trend compression insight (hourly → yearly)
⭐ Lightweight performance
⭐ Perfect companion for any trading strategy

⚠️ Risk Notice

This indicator is a technical analysis tool, not a buy/sell signal generator.
Forex, CFD, and leveraged trading involve significant risk.
Always test on a demo account before live deployment.
Past performance is not a guarantee of future results.

🏁 Installation Guide

1️⃣ Download Hull Pro MTF Indicator.ex4
2️⃣ Place the file into your MQL4/Indicators/ directory
3️⃣ Restart MetaTrader 4
4️⃣ Open any chart and attach the indicator
5️⃣ Adjust Forecast Mode and Visual Style as desired
6️⃣ Observe synchronized multi-timeframe overlays in real-time

🌟 Final Words

The Hull Pro MTF Indicator is built for clarity, confidence, and control.
It provides a full-spectrum view of market structure — from micro to macro — so you can trade with precision and certainty.

Analyze Smarter. Trade Stronger. Master the Market with Hull Pro MTF.

In case of any help needed Please Private message me and I will assist shortly.


Produits recommandés
The King of Forex Trend Cloud Indicator is a trend following indicator based on moving averages. The Indicator is meant to Capture both the beginning and the end of a trend. This indicator can be used to predict both short and long terms market trends.  The king of Forex Trend Cloud if paired together with the King of Forex Trend Indicator can give a broad picture in market analysis and forecasts. I have attached images for both the  The king of Forex Trend Cloud on its own and  The king of Fore
Heiken Ashi Smoothed Strategy is a very simple but powerful system to get forex market trend direction. This indicator is actually 2 indicators in 1 pack, Heiken Ashi and Heiken Ashi Smoothed Moving Average both included. Because HA (Heiken Ashi) and HAS (Heiken Ashi Smoothed) are calculated in the same one system event with necessary buffers and loop only, so it is the FAST, OPTIMIZED and EFFICIENT HA having the combined indicator of MetaTrader 4. You can choose to display HA and HAS in the sam
Un indicateur MACD précis est disponible. Barre de tendance du tableau de bord Smart Level 9TF Double MACD. Double MACD, c'est-à-dire rapide (MACD 1) et lent (MACD 2) Pourquoi avez-vous besoin d'un deuxième MACD ? L'utilisation d'indicateurs supplémentaires nous convaincra davantage dans le trading en direct Courbe MACD 1 rapide 9TF Courbe MACD 2 lente 9TF Angle MACD en temps réel 9TF Valeur MACD en temps réel 9TF Direction MACD en temps réel 9TF Un indicateur MACD précis est disponible. Barr
PABT Pattern Indicator - it's classical system one of the signal patterns. Indicator logic - the Hi & Lo of the bar is fully within the range of the preceding bar, look to trade them as pullback in trend. In the way if indicator found PABT pattern it's drawing two lines and arrow what showing trend way.  - First line - it's entry point and drawing at: 1. On the high of signal bar or on middle of the signal bar (depending from indicator mode) for buy; 2. On the low of signal bar or on middle of t
Indicator for determining the trend. The arrows and lines on the chart show the price reversal and the probable current trend or correction. You should always trade in the direction of the arrow. It is best to use the indicator on several time frames at once and enter the market when all time frames have the same arrow. For example, we open a sell trade if there is a red arrow on the M5, M30 and H4 timeframes. Or we open a buy deal if the indicator shows a blue arrow on all timeframes. Advanta
Binary Options Support Resistance Indicator This indicator is designed for binary options trading and effectively shows retracements from support and resistance levels. Signals appear on the current candle. A red arrow pointing downwards indicates a potential selling opportunity, while a blue arrow pointing upwards suggests buying opportunities. All that needs adjustment is the color of the signal arrows. It is recommended to use it on the M1-M5 timeframes as signals are frequent on these timef
Diver Hurst
Oleksandr Medviediev
Divergence Formation Hurst (hereinafter "Diver") is based on Hurst exponent used as a measurement of long term memory of time series. Classic (regular) and Reversal (hidden) Divergences - at your choice. Adjustable sizes and all parameters Flexible settings including VOID levels (alert function in place, arrows to show in which direction to trade) No re-paint / No re-draw (must set CalcOnOpenBar =false) "SetIndexBuffer" available for all variables (can be used in EA) Auto-detect 4- and 5-digit p
Market Vortex
Adolfina Denysenko
Market Vortex.mq4 is a powerful arrow indicator designed to accurately identify reversal points and trend continuations. Built on a smoothed oscillator and adaptive moving averages, it helps traders quickly find market entry and exit points without complex calculations. Key Features: Clear arrow signals: The indicator displays Buy/Sell arrows directly on the chart. Real-time operation: Signals are generated without delays or repainting. Adaptive calculation: The indicator uses a do
Trend TRN
Andriy Sydoruk
The Trend TRN trend indicator works using a special algorithm and a set of indicators. It finds the current trend based on many factors. Trend TRN entry points should be used as potential market reversal points. The indicator works using the cyclic-wave dependence function. Thus, all entry points will be optimal points where the movement changes. A simple and convenient indicator. The user can easily see the trends. You can use this indicator alone or in combination with other indicators acco
Description Shows Heikin-Ashi candles (often misspelled Heiken-Ashi) on the chart and can alert when candles change color. The alert is useful for both entry and exit. The number of candles of the new color before an alert is raised can be set. The alert can be controlled interactively, directly from the chart. Also includes bonus indicators of current spread and ask/bid prices in large text, color coded as price changes. Usage Heikin-Ashi candles give a much better insight to the underlying tre
PipStartex est un indicateur de scalping. Il trace des zones de surachat/survente sur le graphique, sous forme de canal. Des points jaunes apparaissent également sur le graphique lorsque le prix dépasse le canal. Lorsque le prix dépasse ce canal, il tente systématiquement de revenir en arrière. Connaissant cette tendance, chaque trader peut l'utiliser pour trader. Lorsque le prix dans la zone de survente dépasse le canal en dessous de la zone rouge, nous ouvrons une transaction d'achat. Lorsque
Trend Flasher Trend is your friend is the age old saying quote in trading arena, there are though many ways to gauge the trend and its direction, more scientific measure and logically meaningful will be an ATR break outs to identify and spot the trend and its acceleration, so we created this easy to use trend identification panel and optimized super trend based multi time frame panel entry system to aid and help the traders to make their trading decision. Unique Features of Trend Flasher 1. H
The Oscillator Trend indicators are most useful in identifying trend decay. Nobody canceled the divergence. Correct use of this signal will give you a certain head start in the market. When working in flat. The principle of operation of the oscillator is based on the measurement of fluctuations. The indicator tries to determine the maximum or minimum of the next swing - an exit from the overbought and oversold zones. Do not forget that these signals are most interesting at the borders of the fl
This indicator works on MT4 and is very easy to use. When you receive a signal from it, you wait for that candle with the signal to close and you enter your trade at the beginning of the next new candle . A red arrow means sell and a green arrow means buy. All arrows comes with Alert  like for easy identification of trade signal. Are you okay with that? 1 minute candle 1 minute expire
Scalping Points Pro is an indicator that shows possible price reversal points on the chart and does not redraw its signals. Also, the indicator sends signals to the trader via Email and Push. The accuracy of the signals of this indicator is approximately 92-94% on the M5 timeframe and more than 95% on the H1 timeframe. Thus, this indicator allows the trader to accurately open trades and predict further price movement. The indicator does not redraw its signals.  The indicator works on timeframe
Indicateur Crypto_Forex « Histogramme de Tendance Majeure » pour MT4, sans refonte. - L'indicateur Histogramme de Tendance Majeure est conçu pour détecter les tendances majeures. - L'indicateur est disponible en deux couleurs : rose pour une tendance baissière et vert pour une tendance haussière (couleurs modifiables). - Il détecte les tendances dès leur amorce, bien plus efficace que n'importe quelle moyenne mobile standard. - L'Histogramme de Tendance Majeure peut être combiné avec d'autres
The Hurricane Cave Indicator shows different trade areas based on price action. It looks in the past and works out patterns that can enforce support and resistance as targets. When price breaks out of a trade area you can target just inside the next trade area. If you can't see the target just go to a slower time frame, it means the price hasn't been there for a long time. The Hurricane Cave Indicator is designed to be an add on to The Hurricane Forex Indicator also available in the Meta Trader
FREE
Turn Every Market Reversal Into a Money-Making Opportunity With the U-turn Detector Indicator! Imagine having a tool that visually reveals the exact moment price is about to flip — before the crowd catches on. The U-turn Detector isn’t just another indicator... it's your edge in spotting clean, confident entries and exits in forex. If you've ever been frustrated by fake breakouts, late signals, or messy charts — you're about to fall in love with this tool. URGENT REMINDER: PRICE MAY DOUBLE
Towers
Yvan Musatov
Towers - Trend indicator, shows signals, can be used with optimal risk ratio. It uses reliable algorithms in its calculations. Shows favorable moments for entering the market with arrows, that is, using the indicator is quite simple. It combines several filters to display market entry arrows on the chart. Given this circumstance, a speculator can study the history of the instrument's signals and evaluate its effectiveness. As you can see, trading with such an indicator is easy. I waited for an a
Добрый День уважаемые трейдеры!  Вашему вниманию индикатор созданный и работающий на базе трендовика ADX,  для торговли на смене направления движения который учитывает коррекцию и даёт возможность на ней заработать.  Применяю этот индикатор для скальпинга. Рекомендую таймфреймы от 15 ти минутного(М15) до часового (Н1) периодов.  Красный кружок сигнал на продажу- Sell) Зелёный кружок  сигнал на покупку Buy) Чем меньше ваш таймфрейм тем меньше пунктов вы зарабатываете.   Важно выставлять стопы! !В
The Search for Reversal trend indicator can be used both for pipsing on small periods and for long-term trading. Indicator showing signals for entry. Displays both entry points and the trend itself. Shows statistically calculated times to enter the market with arrows. Using the indicator, you can optimally distribute the risk coefficient. Uses all one parameter for settings. When choosing a parameter, it is necessary to visually resemble so that the corresponding graph has an excellent project
Dévoilement de l'indicateur de tendance XY sans repeint : Votre guide ultime pour le succès sur le Forex et les options binaires Dans le monde dynamique du trading Forex et des options binaires, il est essentiel de garder une longueur d'avance. Les traders sont constamment à la recherche d'outils qui peuvent leur donner un avantage concurrentiel, et l'un de ces outils puissants qui fait des vagues dans la communauté des traders est l'indicateur "Non-Repainting XY Trend". Introduction L'indicateu
a tool for working with binary options well identifies the trend and possible market reversals can be used for forex scalping it works very well on binary options if used with oblique levels or wave analysis, it will be a good assistant in determining the entry point recommended expiration time from 1-15 depending on the selected timeframe the next update will add the ability to customize the tool.
System Trend Pro
Aleksandr Makarov
5 (2)
System Trend Pro - This is the best trend trading indicator!!! The indicator no repaint!!!  The indicator has   MTF   mode, which adds confidence to trading on the trend (   no repaint   ). How to trade? Everything is very simple, we wait for the first signal (big arrow), then wait for the second signal (small arrow) and enter the market in the direction of the arrow. (See screens 1 and 2.) Exit on the opposite signal or take 20-30 pips, close half of it, and keep the rest until the opposite
Automated Trendlines
Georgios Kalomoiropoulos
5 (16)
Les lignes de tendance sont l'outil d'analyse technique le plus essentiel dans le trading forex. Malheureusement, la plupart des commerçants ne les dessinent pas correctement. L'indicateur Automated Trendlines est un outil professionnel pour les traders sérieux qui vous aide à visualiser le mouvement de tendance des marchés. Il existe deux types de lignes de tendance, les lignes de tendance haussières et les lignes de tendance baissières. Dans la tendance haussière, la ligne de tendance du Fo
Line Magnit
Aleksey Trenin
The LineMagnit Indicator for MT4 is a highly precise tool that builds support and resistance levels which magnetically attract prices. This feature allows traders to easily determine the most probable entry and exit points in the market, as well as identify the market's directional forces, as levels are based on capital inflows into the instrument. Equipped with an intuitively understandable graphical interface, the LineMagnit Indicator enables users to quickly locate and analyze support and res
Capernaum
Andriy Sydoruk
Visually, Capernaum, on the chart, appears as small arrows indicating the direction of the trend movement and the opening of trading positions. The appearance of a blue up arrow indicates that the market is beginning to rise and it is time to buy. And the appearance of a red down arrow means that the market is falling and it is high time to sell. When a suitable moment for buying appears, the indicator generates a signal exactly at the moment of its appearance and not below or above the current
Arriator
Nadiya Mirosh
The Arriator forex indicator algorithm allows you to quickly determine the current trend in the market. The Elephant indicator accompanies long-term trends and can be used without restrictions on instruments or timeframes. This indicator not only helps predict future values, but also generates buy and sell signals. It tracks market trends, ignoring wild swings and market noise around the average price. The indicator implements a type of technical analysis based on the idea of ​​market cyclicalit
LDS Scalper
Justice Chinemelum Clement
PLEASE LEAVE US A 5-STAR REVIEW   LDS Scalper User Manual+ Extra LDS CSDIF INDICATOR + Training Videos   ABOUT LDS SCALPER INDICATOR STRATEGY Built on  15+ years of trading experience. LDS Scalper is a very powerful  trading indicator for scalping strategy, returns very high accuracy rate in forex, futures, cryptocurrencies, stocks and indices. This indicator displays arrow signals based on price action information with high accuracy. The LDS Scalper Indicator strategy when applied can turn a ne
TrendySignalMt4
Andrey Spiridonov
TrendySignalMt4l is a trend-following indicator that quickly responds to a trend change. The indicator forms the line so that it is always located above or below the chart depending on a trend. This allows using the indicator both for a trend analysis and setting stop loss and take profit. The indicator should be attached in the usual way. It works on any timeframe from M1 to MN and with any trading symbols. The indicator has no configurable inputs. Recommendations on working with the indicator
Les acheteurs de ce produit ont également acheté
Meravith
Ivan Stefanov
5 (1)
L'indicateur analyse le volume à partir de chaque point et calcule les niveaux d'épuisement du marché pour ce volume. Il se compose de trois lignes : Ligne d'épuisement du volume haussier Ligne d'épuisement du volume baissier Une ligne indiquant la tendance du marché. Cette ligne change de couleur pour refléter si le marché est haussier ou baissier. Vous pouvez analyser le marché à partir de n'importe quel point de départ que vous choisissez. Une fois qu'une ligne d'épuisement du volume est atte
L'indicateur « Dynamic Scalper System » est conçu pour la méthode de scalping, permettant de trader au sein des vagues de tendance. Testé sur les principales paires de devises et l'or, il est compatible avec d'autres instruments de trading. Fournit des signaux pour l'ouverture de positions à court terme le long de la tendance, avec un support supplémentaire pour les fluctuations de prix. Principe de l'indicateur : De grandes flèches déterminent la direction de la tendance. Un algorithme de gén
Rtc ML Ai Predictor MT4
Muhammad Faisal Sagala
Product Description Rtc ML Ai Predictor — Futuristic Intelligence for Real-Time Market Decisions Bring robotic precision to your trading.   Rtc ML Ai Predictor   fuses   Machine Learning   with   SMA-shift dynamics   to forecast short-term momentum and trend inflection points with clarity. The model evaluates multi-factor market structure, assigns a   confidence score   to each signal, and lets you act only when conditions align with your rules. Why traders choose Rtc ML Ai Predictor AI-guided e
BinaryUniversal
Andrey Spiridonov
BinaryUniversal is a signal indicator for binary options and Forex. In its work, the indicator uses a complex algorithm for generating signals. Before forming a signal, the indicator analyzes volatility, candlestick patterns, important support and resistance levels. The indicator has the ability to adjust the accuracy of the signals, which makes it possible to apply this indicator for both aggressive and conservative trading. The indicator is set in the usual way, it works on any time period and
Hit Rate Top Bottom Signal
Martin Alejandro Bamonte
Hit Rate Top Bottom Signal Hit Rate Top Bottom Signal Hit Rate Top Bottom Signal offre une approche totalement innovante. Il est idéal pour ceux qui souhaitent évaluer à l’avance comment le signal fonctionne avec un TP-SL spécifique et dans quels PAIRES/TF il est le plus performant. La stratégie Hit Rate Top Bottom Signal est un outil essentiel pour tout trader et type de trading car elle émet non seulement des signaux précis sans redessiner , indiquant clairement quand trader et dans quelle dir
This indicator is a multifunctional technical analysis tool based on the combination of an adaptive exponential moving average and volatility filters calculated through the Average True Range (ATR). It is designed to accurately identify the current price direction, highlight key trend reversal areas, and visualize potential turning zones. The algorithm is built upon the dynamic construction of a trend ribbon using two levels of volatility — outer and inner ranges. The outer boundaries serve as i
#EasyWayTradePanel indicator for #MetaTrader4 , is trade assistants for manual trading in any #currency in #FOREX , #CRYPTOCURRENCY as #Bitcoin , #Ethereum , #Lightcoin and more. Also is EasyWay to use for #COMMODITY as #Gold , #Silver , #Oil , #Gas ...... and #CFDs . When installed on the chart in your chosen time frame and trading tool, the indicator automatically draws the following custom indicators used in the EasyWayTradePanel trading strategy. 1) Zigzag_Extreme_Indicator, 2) Regression_C
This is a mini One pair version of Advanced Detector of Trend Reversal and Continuance known as TrueTrendStarM(TTSm25). It is a sensitive and Predictive indicator of Price Trends for Professional traders.  ( ATTENTION BUYERS:-Now the indicator is available for UNLIMITED TIME ONE TIME buy of just $500 ). Avail the Opportunity.    It detects high odds changes in Price Trend direction long before other indicator detects it. I have been working on it since 2019.    This is possible due to fractal
Dual Momentum
Adolfina Denysenko
Dual Momentum is a modern arrow indicator for MetaTrader 4, created specifically for the accurate detection of market reversals and strong impulse movements. The indicator is based on a combination of two powerful oscillators – Williams %R and RSI, which allows you to filter noise and generate more reliable signals. Thanks to this, Dual Momentum indicates only key entry points when the probability of a successful trade is highest. Key advantages: No redrawing – signals remain on the cha
FFx Engulfing Setup Alerter gives trade suggestions with Entry, Target 1, Target 2 and StopLoss. Below are the different options available: Entry suggestion - pips to be added over the break for the entry 3 different options to calculate the SL - by pips, by ATR multiplier or at the pattern High/Low 3 different options to calculate the 2 TPs - by pips, by ATR multiplier or at Risk/Reward Offset the dashboard - any place on the chart Remove the suggestion once the price reached the SL line Lines
FFx InsideBar Setup Alerter gives trade suggestions with Entry, Target 1, Target 2 and StopLoss. Below are the different options available: Entry suggestion - pips to be added over the break for the entry Minimum candle size - to avoid too close buy/sell entry suggestions 3 different options to calculate the SL - by pips, by ATR multiplier or at the pattern High/Low 3 different options to calculate the 2 TPs - by pips, by ATR multiplier or at Risk/Reward Offset the dashboard - any place on the c
FFx OutsideBar Setup Alerter gives trade suggestions with Entry, Target 1, Target 2 and StopLoss. Below are the different options available: Entry suggestion - pips to be added over the break for the entry. 3 different options to calculate the SL - by pips, by ATR multiplier or at the pattern High/Low. 3 different options to calculate the 2 TPs - by pips, by ATR multiplier or at Risk/Reward. Offset the dashboard - any place on the chart. Remove the suggestion once the price reached the SL line.
FFx PinBar Setup Alerter gives trade suggestions with Entry, Target 1, Target 2 and StopLoss. Below are the different options available: Entry suggestion - pips to be added over the break for the entry Minimum candle size - to avoid too small candles 3 different options to calculate the SL - by pips, by ATR multiplier or at the pattern High/Low 3 different options to calculate the 2 TPs - by pips, by ATR multiplier or at Risk/Reward Offset the dashboard - any place on the chart Remove the sugges
Automatic, live & interactive picture of all trendlines. Assign push, email and sound alerts to the lines of your choice and be informed about price rollback, breakout, rollback after breakout, number of rollbacks, line expiration by double breakout. Correct, drag or delete the lines and interactively tune the line system. https://youtu.be/EJUo9pYiHFA . Chart examples https: //www.mql5.com/en/users/efficientforex Price Interaction Events All events are effective immediately and only after one
The purpose of this new version of the MT4 standard indicator provided in your platform is to display in a sub-window multiple timeframes of the same indicator with its divergences. See the example shown in the picture below. But the display isn't like a simple MTF indicator. This is the real display of the indicator on its timeframe. Here's the options available in the FFx divergences indicator: Select the timeframes to be displayed (M1 to Monthly) Define the width (number of bars) for each tim
The purpose of this new version of the MT4 standard indicator provided in your platform is to display in a sub-window multiple timeframes of the same indicator with its divergences. See the example shown in the picture below. But the display isn't like a simple MTF indicator. This is the real display of the indicator on its timeframe. Here's the options available in the FFx divergences indicator: Select the timeframes to be displayed (M1 to Monthly). Define the width (number of bars) for each ti
The FFx Dashboard MTF alerter will show you on a single chart all the timeframes (M1 to Monthly) with their own status for the indicator. 2 Alert Options: Single timeframe: each selected timeframe alert separately when a signal occurs Multi timeframes: all selected timeframes must agree for an alert to be triggered Both options have an input to select the timeframes to be used for the alert(s). How to Understand the Status: Green/Red square: histogram above/below 0 line Green square + Red bord
The FFx Dashboard MTF alerter will show you on a single chart all the timeframes (M1 to Monthly) with their own status for the indicator. 2 Alert Options: Single timeframe: each selected timeframe alert separately when a signal occurs Multi timeframes: all selected timeframes must agree for an alert to be triggered Both options have an input to select the timeframes to be used for the alert(s). How to understand the status: Green/Red square: RSI above/below 50 line Green square + Red border: R
The FFx Dashboard MTF alerter will show you on a single chart all the timeframes (M1 to Monthly) with their own status for the indicator. 2 Alert Options: Single timeframe: each selected timeframe alert separately when a signal occurs Multi timeframes: all selected timeframes must agree for an alert to be triggered Both options have an input to select the timeframes to be used for the alert(s). How to understand the status: Green/Red square: Stoch above/below 50 line Green square + Red border:
The FFx Dashboard MTF alerter will show you on a single chart all the timeframes (M1 to Monthly) with their own status for the indicator. 2 Alert Options: Single timeframe: each selected timeframe alert separately when a signal occurs Multi timeframes: all selected timeframes must agree for an alert to be triggered Both options have an input to select the timeframes to be used for the alert(s). How to understand the status: Green/Red square: Price above/below Cloud (Kumo) Green square + Red bo
The FFx Dashboard MTF alerter will show you on a single chart all the timeframes (M1 to Monthly) with their own status for the indicator. 2 Alert Options: Single timeframe: each selected timeframe alert separately when a signal occurs Multi timeframes: all selected timeframes must agree for an alert to be triggered Both options have an input to select the timeframes to be used for the alert(s). How to understand the status: Green/Red square: MA pointing Up/Down Green square + Red border: MA po
The FFx Dashboard MTF alerter will show you on a single chart all the timeframes (M1 to Monthly) with their own status for the indicator. 2 Alert Options: Single timeframe: each selected timeframe alert separately when a signal occurs. Multi timeframes: all selected timeframes must agree for an alert to be triggered. Both options have an input to select the timeframes to be used for the alert(s). How to understand the status: Green square: Price above PSAR Red square: Price below PSAR Options
The FFx Dashboard MTF alerter will show you on a single chart all the timeframes (M1 to Monthly) with their own status for the indicator. 2 Alert Options: Single timeframe: each selected timeframe alert separately when a signal occurs Multi timeframes: all selected timeframes must agree for an alert to be triggered Both options have an input to select the timeframes to be used for the alert(s). How to understand the status: Green/Red square: CCI above/below levels (ie. 100/-100) Grey square: C
The FFx Dashboard MTF alerter will show you on a single chart all the timeframes (M1 to Monthly) with their own status for the indicator. 2 Alert Options: Single timeframe: each selected timeframe alert separately when a signal occurs Multi timeframes: all selected timeframes must agree for an alert to be triggered Both options have an input to select the timeframes to be used for the alert(s). How to understand the status: Green/Red square: ADX above level Grey square: ADX below level Red bor
The FFx Dashboard MTF alerter will show you on a single chart all the timeframes (M1 to Monthly) with their own status. 2 Alert Options: Single timeframe: each selected timeframe alert separately when a signal occurs Multi timeframes: all selected timeframes must agree for an alert to be triggered Both options have an input to select the timeframes to be used for the alert(s). How to understand the status: Green/Red square: bullish/bearish candle Options available in the FFx Dashboard Alerter
The [GRAFF] III manual trading system is based on multiple MetaTrader (MT4) indicators. Together, the entire PACK of GRAFF III indicators makes an advanced trading tool. The system consists of over 20 different custom-built indicators which have been carefully selected and tested in the long term to produce strong and efficient trading signals. The particular indicators are based on different mathematical formulas, so the entire system is calibrated to remove false signals from its own indicator
This indicator allows you to see the strength of the trend on all timeframes. It can be used for all currency pairs. The indicator can be displayed in the form of a column (from left to right): status buy / sell / strong buy / strong sell, strength of the trend in percentage, pips last candle, body candle now, remaining time, and the timeframe of M1 to MN. Information contained below (from left to right): total trend percent, sell percent, buy percent.
Plus de l'auteur
King of Forex trend indicator is a trend following indicator based on moving averages. This indicator doesn't repaint. The major function of this indicator is to show the major direction of the trend, the beginning and the end of the current trend. A bullish trend is when the indicator turns blue A bearish trend is when the indicator turns pink. This indicator is great for swing trading and day trading It works best on H1, H4, D and Weekly time-frames. It works on all pairs but it works best on
The King of Forex Trend Cloud Indicator is a trend following indicator based on moving averages. The Indicator is meant to Capture both the beginning and the end of a trend. This indicator can be used to predict both short and long terms market trends.  The king of Forex Trend Cloud if paired together with the King of Forex Trend Indicator can give a broad picture in market analysis and forecasts. I have attached images for both the  The king of Forex Trend Cloud on its own and  The king of Fore
Dear traders, here is my other tool called the "Market Makers Trend Index".   The Market Makers Trend Index is created for the purpose of helping majority of traders to analyse the market direction in an easy way. This indicator is for serious traders who are eager to add edging tools to their trading arsenal. What are you waiting for just grab your copy today and amake a difference.  WHY THIS TOOL This indicator help traders analyse the trend direction and trading signals with precision and eff
The Trend Monster is a trend following non repainting indicator based on moving averages. As traders we want to be careful not to trade against the trend. Therefore when you look at the chart as a trader you will have to ask yourself these kind of questions Is this market trending? Is this market ranging/trading sideways? Is this market bullish or bearish? What should I look for before I take a trade? Those are some critical questions that every trader should ask him/herself before taking any tr
NOTE-After the first 10 people to rent this product for 1 month then I will remove the 1 month renting option and leave the unlimited price only. Therefore don't rent it too late. Thanks for those who have rented yet. Don't miss out this offer! Few  people remaining. Special offer from 2500usd to 200usd 24 hours offer! Introduction Super bands Trend Indicator is an indicator designed to reveal the direction of the market Trend. The Indicator is based on moving averages, ichimoku, alligators, a
The Forex Scalpers Index (FSI) is a trend following Indicator based on moving averages.  The purpose of this indicator is to be used for scalping all kinds of markets without limitations. The indicator can be used for any kind of currency pair. For those Scalpers who are looking for the indicator that can make their trading activities easy we recommend using this indicator because it provides many entry and exit opportunities. This indicator can be used on all timeframes. How it works. Colored
Disclaimer: There is no guaranteed profitability! Invest wisely. The Perfect Trend Scanner is a trend following indicator which is designed to show you the direction of the current trend. The aim is to assist you not to trade against the trend. How it works. The indicator doesn't repaint. The indicator works on all time-frames. The pink histograms indicate a bearish trend while the blue histograms indicates a bullish trend /signals. You can us this indicator in the top down market analysis appro
The Mane Flow Index is designed to help youu know where the market orders are flowing to. The indicator is based on moving averages. In other words it will show you where the investors capital is flowing to. In our trading activities we want to know where the capital is going so that we capitalize on the direction of the capital invested in the market. We want to trade with the trend! Not to go against it! How it works It is non repaint. It is suitable for all kind of markets It is suitable for
Septermber OFFER 85% OFF next price for unlimited version will be 2500$. This is the only time you can get this institutional and professional indicator at this price for unlimited version. Don't dare to miss this. The tool I am about to introduce to you you can't compare it with other tools due to its strategy and accuracy level in predicting the next price directional movement. This tool is designed for serious traders who have decided to make a difference through trading. Be the next person t
The Trend Professor is a moving average based indicator designed for the purpose of helping the community of traders to analyse the price trend. The indicator will be displayed in the main chart as it is indicated on the screenshot section. How it works The indicator has lines of moving averages and colored histograms to depict the direction of the trend. There will be a fast signal line colored blue/yellow/red at some points. The red/yellow colored lines stands for bearish trend/signal while th
Maximum Directional Index (MDI) is designed for two purposes. 1. To show the direction of the trend (The blue yellow trend line) 2. To show the Overbought (Resistance) and Oversold (Support) zones for a trader to know whether the trend is about to reverse or not. It shows the maximum direction of the price trend. How it works 1. The indicator works on all time-frames but for clarity I recommend you use it on 5minutes, 15miutes, 30minutes, 1 hour and 4 hours time-frame charts. 2. The indicator c
Information about this tool Generally: The Smart Trend Indicator STI is designed for the purpose of showing you the direction of the trend.   How it works It is based on moving averages. The indicator works on all types of markets. The indicator works on all timeframes. The indicator works on all currency pairs. This indicator doesn't repaint. The light green histograms are for bullish trend. The green histograms are for fast buy signals. The light red histograms are for bearish trend. The dee
The Omega Trend Oscillator is a trend indicator based on Moving averages and Bollinger bands. I made it simple for you to have easy and soft market analysis approach. The indicator can be used for the following purpose. 1. For trend analysis 2. For determining the overbought and oversold market condition 3. For discovering market selling and buying opportunities.  Meaning of colors on the indicator FOR BULLISH MARKET (Buy) 1. Lime color is for bullish market/trend 2. Blue color is for very st
OFFER! OFFER! From 450usd to 370usd this offer may end at any time from now! Don't miss this. Hi traders, I have created this EA and called it "The Account Flipper EA". This trading EA is for both newbies and professional traders. The first goal with this EA is to protect your capital first and the second is to grow your account. Therefore no risky strategies like grid, marti-angle, hedging, or any greedy trading strategies. We use a fixed lot size in every trade, SL, TP and break even all these
Hi traders, I'm glad to bring to you the market analysis tool called "Infinity Trend Indicator". The main goal of this indicator is to help you figure-out  the beginning of a new trend and the end of the trend current trend.  NOTE:  THIS INDICATOR DOESN'T REPAINT!! How to use this Indicator 1. Based on the Infinity trend indicator only We look to buy when the yellow line is pointing or curving up after a strong bearish move We look to sell when the yellow line is pointing or curving downward aft
Note: The price is subject to increase at any time from now!  Hi Traders, I would like to introduce to you my new indicator called the Infinity Oscillator Indicator. This indicator is designed for both newbies and professional traders. Parameters The inputs that can be changed by the user are colors of the lines only so as to not disturb the original trading strategy this indicator uses. The indicator will not provide buy and sell arrow signals but will help traders in market analysis approach
IMPORTANT; Price is subject to rise at any time from now! Do not miss this offer! Dear trader I am glad to introduce my new tool called Trend Analyser Dashboard to you. The design, style, and settings of this indicator  have been made simple to make its users not take too much time in understanding the indicator itself.   The purpose is to help traders in analysing the direction of the major trend and the status of the trend whether in weak trend or its strong trend. The indicator will also prov
Reminder: After purchasing the unlimited version of this indicator send me the proof and I will add you to my private group so that you join the community and continue to learn more about this tool and grow together with other traders. You will also learn the strategy that will change your trading story! Dear Traders I am so glad to introduce my forex trading product called "Day Traders Master Board". This tool is designed for serious traders of any trading strategy.  My goal is to help trader b
NOTE: NEXT PRICE WILL BE 550$ Dear Trader I hope you have been eagerly waiting and looking for a tool to improve your trading. I am so glad to introduce my other product to you called Trend Shooter Index. The main goal of this tool is to help traders shoot the trend (target the trend) from the bottom or from the top of the trend for maximum profitability. How is the Indicator designed This tool is designed to show the following Red arrows pointing down for sell signals. Blue arrows pointing up f
Note: The PRICE IS SUBJECT TO INCREASE AT ANY TIME FROM NOW!! DON'T MISS THIS BEST OFFER. Dear traders once again I am very glad to introduce to you my another trading tool called "Trend Hunter Indicator". This indicator is designed to help traders capture the trend from the beginning or the end of it. It is one of the indicator that if used wisely may  help you improve in your trading decisions. Timeframe   The indicator is for all timeframes Pairs The Indicator is for all pairs. Market Thi
OFFER! OFFER! NEXT Price Will be 650$ and the rental option will be removed after this. Don't miss the current price offer before it is too late. Dear Traders I am so glad to introduce my Super Powers Indicator.  The purpose of this trading tool is to help serious traders who want to make trading one of their main source of income.  I know trading is not an easy task but if you have the right tools, knowledge and motivation to trade then you are ready to go in this industry. My role is to help y
NOTE: PRICE WILL RISE VERY SOON. DON'T SKIP THIS OFFER! Dear traders I am glad to introduce the " Market Swing Scanner Board" indicator to you. This indicator was made mainly to be used in combination with the Market Swing Index Indicator. You use the  "Market Swing Scanner Board"  indicator to scan for trading opportunities on the  Market Swing Index Indicator . This tool is designed for serious traders who have decided to make a difference through trading. Be the next person to witness this st
WARNING!! THIS SWORD IS TOO SHARP!    ONLY 10 COPIES LEFT FOR THE NEXT PRICE TO BE 8,000$ FOR UNLIMITED PLAN. Dear traders I am very glad once again to introduce to you my other tool called "Forex Sword Indicator". In short this tool is meant to give you an edge over the market that you have been waiting for  so long. Now, here it is. It is a very very simple tool but yet a dangerous sword. I call it a  Holy grail indicator!. I will not talk a lot about this tool. Just let the tool speak by itse
Dear Traders this is my another tool called " Swing Master Indicator ". As the name above the indicator is designed to help you in swing trading by capturing the low and highs of the price. You may us this tool with any trading strategy and style from scalping to position trading. It is made for level of traders including newbies and advanced traders even prop-firms, hedge funds and banks to help them make sold market analysis. I create tools for serious traders who want to make a difference in
Dear Trader It is my pleasure to introduce to you my tool called the " Forex Sniper Indicator" . The major aim of this tool is to help serious traders and investors in all type of Financial Markets to catch price next movement right at the moment the price direction is about to change. This tool can be used to snipe the price direction in both down trend, uptrend and ranging markets. This tool can be used as the stand alone tool though it may be combined with other tools as well. My goal is to h
WARNING: PRICE IS SUBJECT TO RISE AT ANY TIME. GET YOUR COPY TODAY TO AVOID MORE COST! Dear Traders I am so glad to introduce to you my other tool called the Forex Sniper Entries Indicator. This tool is designed to help serious traders and investors capture big moves in the currency price movements. The philosophy behind this tool is all about winning big and riding the price movement from its beginning until the maximum point. We want to capture those big moves in both down and up markets as mu
OFFER!   OFFER ! After 3 weeks the unlimited price will be 500$ and in the future you will regret why you didn't make a purchase at this lowest price. Dear Traders, the atomic power Entries Indicator is one of the indicators that if used wisely and correctly can help you to find an edge over the market.  The indicator will work for all forex pairs, all markets and all timeframes. Still it is your duty to find the most effective timeframe for you. When the sell or buy arrow appears you will get a
OFFER! OFFER!    ONLY 5 COPIES REMAINING FOR THE NEXT PRICE TO BE 360$ Dear traders I am very glad to introduce the Sweet Arrows Indicator to you. The Sweet Arrows indicator is well designed to help serious investors to trade with confidence. In short I can say that this is one of the valuable tool to add in your trading tool kit. INSTANT, FAST AND NON LAGGING SIGNAL This is an instant signal meaning that you get the signal as soon as the bar opens. The signals don't lag meaning that it doe
Urgent reminder> Only 13 copies remaining for the price to double on all renting options. Get your copy Today! Introduction Dear Traders, I am always working to come up with tools that may help you to become a better trader and investor. Due to my experience in trading and market analysis and trading software design and development, I am glad to introduce to you my other tool called " Amazing Entries Indicator ". The Indicator is designed in a way that it combines different strategy to provide
URGENT REMINDER> Only 5 remaining Copies for next unlimited price to be 360$ (THIS IS A SPECIAL OFFER TOOL) If you are looking for FAST , RELIABLE and PROFITABLE indicator to help you take easy trades then this is the tool to go with. Trading is very tricky, frustrating, confusing, embarrassing and even can make you go broke if you approach the market with gambling mindset, poor entry and exit strategies, unreliable indicators or signals, poor money management skills and lack of knowledge. Many
Filtrer:
Aucun avis
Répondre à l'avis