Supply Demand Zone Signals
- Indicateurs
- Sivakumar Subbaiya
- Version: 1.0
- Activations: 20
Advanced Supply & Demand Zone Dashboard
The Ultimate Multi-Symbol, Multi-Strategy Scanner for Price Action Traders
Description
Tired of endlessly flipping through dozens of charts, manually searching for high-probability Supply and Demand zones? Do you spend hours trying to confirm setups with multiple indicators, only to miss the entry?
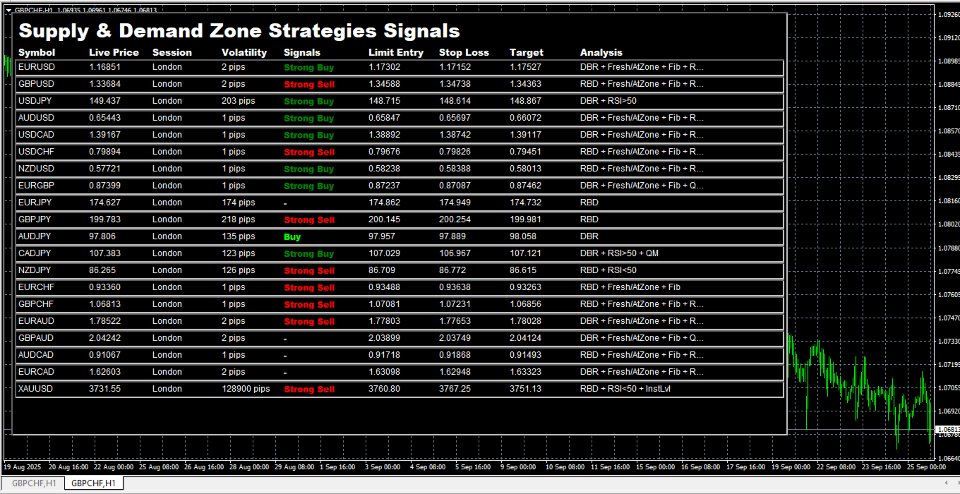
The Advanced Supply & Demand Zone Dashboard is your all-in-one solution. This powerful indicator for MetaTrader 4 scans 20 different instruments across 4 key timeframes in real-time, delivering a complete market overview directly on a single chart. It combines core Supply and Demand principles with essential confirmation tools to identify and present actionable trade signals, complete with entry, stop loss, and target levels.
Stop hunting for trades and let the setups come to you.
Key Features
- Comprehensive Multi-Symbol Dashboard: Scans 20 major Forex pairs and Gold (XAUUSD) simultaneously, so you never miss an opportunity.
- Multi-Timeframe Analysis: Get instant signals for the M15, H1, H4, and D1 timeframes, plus a powerful aggregated "Overall Signal" to gauge the dominant market sentiment.
- Core Strategy Engine: Automatically identifies classic and effective Supply and Demand patterns, including Rally-Base-Drop (RBD) and Drop-Base-Rally (DBR).
- Built-in Confluence Filters: Signals are automatically cross-verified for higher probability using:
- RSI: Confirms overbought or oversold conditions at key zones.
- Trendlines: Validates that the setup aligns with the current market structure.
- S/R Zones: Checks if the setup is occurring at a significant historical support or resistance level.
- Candlestick Patterns: Identifies key reversal patterns like Engulfing bars, Dojis, and Hammers at zones.
- Actionable Trade Signals: The dashboard doesn't just give a "Buy" or "Sell" signal—it provides calculated Limit Entry, Stop Loss, and Target levels based on the zone's structure and your custom Risk:Reward ratio.
- Real-Time Market Context: Instantly see the Current Trading Session (e.g., London, NY) and the current Volatility (in pips) for each instrument to make more informed trading decisions.
- Fully Customizable Interface: Tailor the entire dashboard to your preferences. Adjust the size, position, colors, row gaps, column gaps, and more. Make it your own!
How It Works
The indicator's intelligent algorithm continuously scans every instrument and timeframe for valid Supply and Demand zones. When a potential zone is identified, it's put through a rigorous confirmation process using the built-in filters (RSI, Trend, S/R, etc.). Each confirmation adds to the setup's "score." The final score is then translated into a clear, color-coded signal—from a standard Buy/Sell to a high-conviction Strong Buy/Strong Sell.
Customizable Parameters
Every aspect of the strategy is fully adjustable in the indicator's input settings. You can modify:
- All layout and color settings.
- RSI Period and Levels.
- S/R Zone lookback period and proximity.
- Stop Loss buffer and Risk:Reward Ratio.
- And much more!
Take your Supply and Demand trading to the next level. Simplify your analysis, save valuable time, and gain a powerful edge with the Advanced Supply & Demand Zone Dashboard.
