Trend And Corrections MT5

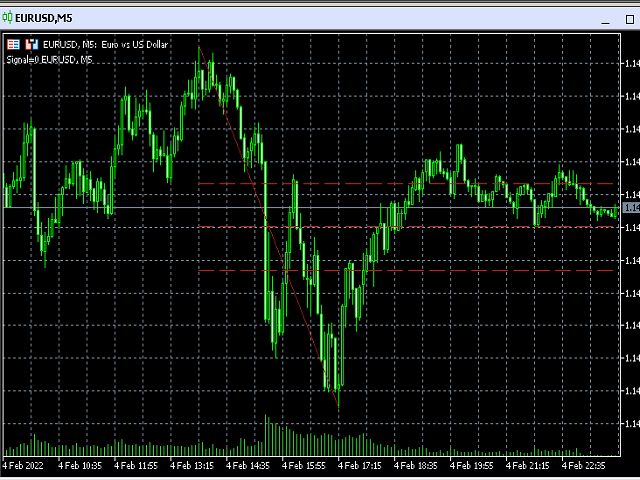
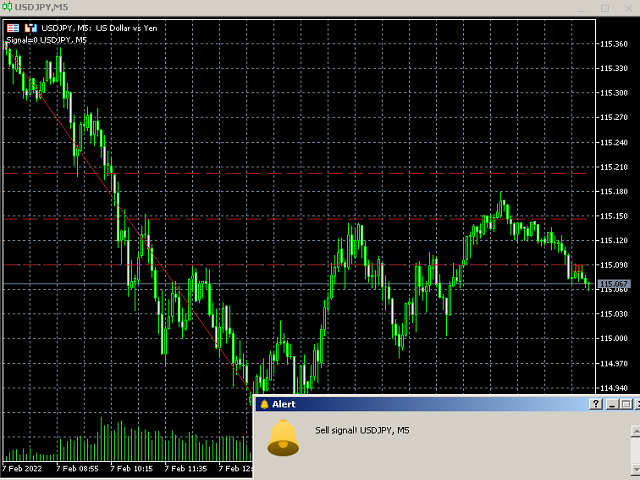
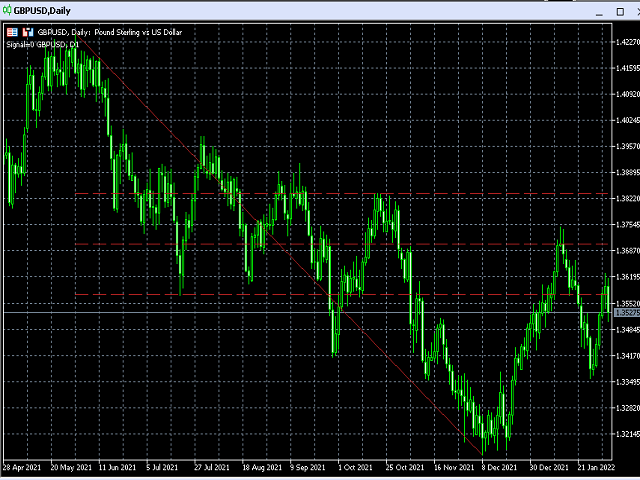
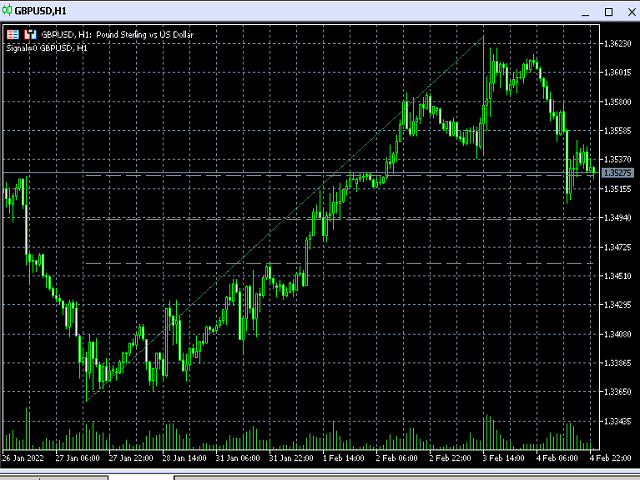
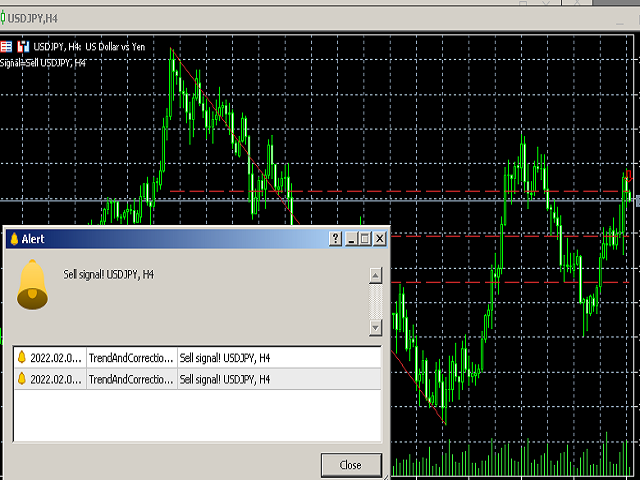
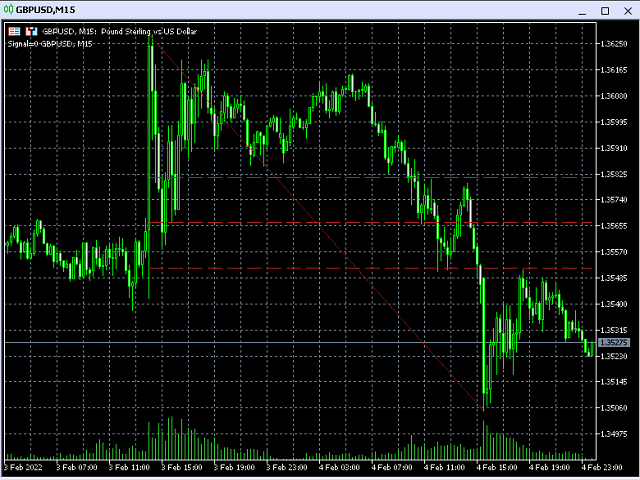
L'indicateur aide à entrer dans un commerce en suivant la tendance, en même temps, après une certaine correction. Il trouve de forts mouvements de tendance d'une paire de devises sur un nombre donné de barres, et trouve également des niveaux de correction à cette tendance. Si la tendance est suffisamment forte et que la correction devient égale à celle spécifiée dans les paramètres, l'indicateur le signale. Vous pouvez définir différentes valeurs de correction, les valeurs de 38, 50 et 62 (niveaux de Fibonacci) sont mieux adaptées. De plus, vous pouvez définir la longueur de tendance minimale, le nombre d'historiques de barres à rechercher, la couleur des lignes et d'autres paramètres.

Paramètres

  • History - le nombre de barres pour déterminer la tendance et la correction;
  • MinPriceDistance - distance de tendance minimale en unités de paire de devises;
  • BarsShift - le nombre minimum requis de barres pour trouver le maximum ou le minimum lors de la détermination du début d'une tendance;
  • CorrectionPercent - pourcentage de la première correction ;
  • Correction2Percent - pourcentage de la deuxième correction (si 0 est spécifié, il ne sera pas affiché);
  • Correction3Percent - pourcentage de la troisième correction (si 0 est spécifié, il ne sera pas affiché);
  • OnlyTouchingLine - activez ou désactivez l'option, dans laquelle le signal n'apparaît que lors du toucher et du rebond de la ligne de correction;
  • EnableAlert - active ou désactive la fenêtre d'alerte;
  • EnableNotifications - activez et désactivez l'envoi de notifications au téléphone et au courrier électronique (pour cela, les paramètres de MT4 doivent également être correctement spécifiés);
  • MaxNotificationsInHour - le nombre maximum de notifications envoyées par heure de trading en fonction de l'heure du serveur;
  • UpColor - couleur des niveaux de correction dans une tendance haussière;
  • DownColor - couleur des niveaux de correction dans une tendance baissière.


Produits recommandés
Xtrade Trend Detector
Dago Elkana Samuel Dadie
Xtrade Trend Detector est un indicateur capable de trouver les meilleures opportunités pour prendre position sur n'importe quel marché boursier. En effet, il est taillé pour les scalpers mais aussi pour les Daytraders. Vous pourriez donc vous en servir pour repérer les zones à trader, il s’intègre facilement sur graphique. Je l'utilise pour detecter les tendances sur les grandes unités de temps et prendre positions sur les petites unités de temps. N’hésitez pas à me contacter si vous avez des qu
IS PRO Estructura Institucional
Medina Cortez Edison Armando
INSTITUTIONAL STRUCTURE PRO Market Structure + Swings + Fair Value Gaps with SOR Priority Institutional Structure Pro is an advanced market structure indicator based on institutional analysis. The system automatically identifies: Structural highs and lows Structure breakouts (SOR – Structure Override / priority breakout) Bullish and bearish fair value gaps (FVG) Real inefficiency zones with precise rectangles All directly on the chart, with no delay and no repainting. What Does the
Mean Reversal Heikin Ashi Indicator calculates special trade reversal points based on Heikin Ashi candlesticks patterns. This indicator can be used on all symbols, even in Forex or B3 Brazillian Markets. You can configure just the position of each arrow. Then, after include the indicator on the graphic, pay attention on each arrow that indicates a long or short trade.
Titan Zaghaba Pro
Wissam Mostafa Mohamed Jaeitr
Titan Zaghaba Pro: The Ultimate Scalping & Risk Management System [AR] مؤشر تيتان زغابة برو: النظام المتكامل للمضاربة السريعة وإدارة المخاطر الاحترافية 1. Description / الوصف [EN] Titan Zaghaba Pro is a high-precision trading workstation designed for scalpers and day traders. It combines a sophisticated RSI Momentum algorithm with a built-in Professional Risk Manager . It doesn't just give you signals; it tells you exactly how much to risk and how to manage your trade from entry to the final ta
ATlogic
Zaha Feiz
5 (3)
ATLogic  Indicateur ATLogic : Un outil polyvalent pour tous les instruments de trading ATLogic est un outil d'analyse technique complet et convivial conçu pour une large gamme d'instruments financiers, y compris tous les paires de devises, indices et crypto-monnaies. Cet indicateur polyvalent offre aux traders des informations puissantes sur divers marchés : " un message pour me contacter et apprendre à utiliser cet indicateur de manière plus efficace avec mon tuteur IA !" Principales caractéri
Orderflow Super Candles - Simple Footprint Chart Indicator Platform: MetaTrader 5 (MT5)  (The last screenshot shows the use of the DOM tool in conjunction with the product.) 1. Product Introduction Orderflow Super Candles is a professional charting tool based on underlying Tick data analysis, designed to provide traders with a deep "X-ray" view of the market. By parsing the buy and sell volume distribution within each candlestick, this indicator visualizes the hidden market microstructure. It
Session Kill zones with panel for quick changes. Asia Killzone London Killzone New York Killzone London Close Killzone In this indicator GMT+2 timings are used that are most common among many brokers. read the image attached in the screenshots to know more about sessions adjustments Session timings can be changed according to your broker timings and day light savings. Thank you :) Always open to feedback and criticism if it helps me provide you more value. - Rahul  My other indicators you may l
Niubility Trend  Niubility Trend  displays the trend direction for all time frames in real time. You'll see at a glance at which direction the trends are running, how long they last and how powerful they are. All this makes it an easy-to-use trend trading system for beginners, advanced and professional traders. Features Easy to trade Customizable colors and sizes It is non-repainting and non-backpainting It is fantastic as a trailing stop method It implements alerts of all kinds
ZIVA TrendX
Hassan Abdullah Hassan Al Balushi
ZIVA TrendX is a professional trend-oriented indicator engineered to provide a clear and structured assessment of market direction through a cloud-based analytical framework. The indicator analyzes price behavior relative to dynamically derived trend boundaries, forming a continuous cloud structure that visually represents the prevailing market bias. This structure enables traders to maintain alignment with dominant directional conditions while filtering short-term market noise. All internal ca
Bid Price Timer Indicator — Précision et suivi intelligent des prix ! Améliorez votre précision de trading avec le Bid Price Timer Indicator , un outil puissant conçu pour les traders qui apprécient le timing, la précision et la clarté à chaque mouvement du marché. Fonctionnalités principales : Affichage fixe du minuteur – Toujours visible sur le côté droit du graphique (ajustable via X_Offset). Suivi dynamique du prix – Le minuteur se déplace verticalement en suivant le prix B
Cet indicateur est un indicateur d'analyse automatique des vagues, parfait pour le trading pratique ! Cas... Remarque :   je n'ai pas l'habitude d'utiliser des noms occidentaux pour l'évaluation des vagues. En raison de l'influence de la convention de dénomination de Tang Lun (Tang Zhong Shuo Zen), j'ai nommé la vague de base comme   un stylo   et la bande d'onde secondaire comme   un segment   . en même temps, le segment a la direction de la tendance.Le   segment de tendance principal   est no
Optimized Spike Detector Pro for MT5 is a professional-grade technical indicator designed to identify and capitalize on sharp, impulsive price movements (spikes) in any financial instrument. Utilizing a sophisticated, multi-algorithmic core, it distinguishes significant volatility expansions from market noise with exceptional accuracy. The tool dynamically adapts to changing market conditions, filtering out false signals and highlighting only high-probability spike setups in real-time. Featuring
Inspired by the popular beat the market maker Multi MA. Now available for MT5 to be utilized. Multi Exponential Moving Average (Multi-EMA) Indicator for MT5 The Multi-EMA Indicator is designed to help traders visualize multiple exponential moving averages on one chart with precision and clarity. It plots five customizable EMA lines, each with distinct colors, making it easy to identify market trend direction, strength, and potential reversal zones at a glance. Key Features: Plots five indepen
# SSL ST Strategy MT5 Indicator - French Version L'indicateur SSL ST Strategy MT5 est un outil d'analyse technique conçu pour aider les traders à identifier clairement les signaux d'achat et de vente sur le graphique commercial. Il offre des indicateurs visuels tels que des lignes et des flèches, ainsi que des notifications sonores, des alertes contextuelles et des notifications push pour alerter les traders rapidement lorsqu'une opportunité commerciale se présente. ## Avantages principaux -
MultiWay EA
PAVEL UDOVICHENKO
4.89 (19)
MultiWay EA est un système de trading automatisé intelligent et efficace, basé sur une puissante stratégie de retour à la moyenne. Grâce à une large diversification sur neuf paires de devises corrélées (et même certaines typiquement “tendancielles”) — AUDNZD, NZDCAD, AUDCAD, USDCAD, EURUSD, GBPUSD, EURCAD, EURGBP et GBPCAD — il capture les mouvements de prix revenant à la moyenne après de forts impulsions directionnelles. Après l’achat, veuillez m’envoyer un message privé pour recevoir les inst
KT Psar Arrows MT5
KEENBASE SOFTWARE SOLUTIONS
5 (1)
KT Psar Arrows trace des flèches sur le graphique en utilisant l'indicateur standard Parabolic SAR. Une flèche haussière est tracée lorsque le plus haut de la bougie touche le SAR. Une flèche baissière est tracée lorsque le plus bas de la bougie touche le SAR. Les signaux sont générés en temps réel sans attendre la clôture de la bougie.  Fonctionnalités Un outil utile pour les traders souhaitant expérimenter des stratégies de trading intégrant l'indicateur Parabolic SAR.  Peut être utilisé pour
Il s'agit d'un scanner multi-symboles et multi-unités de temps pour notre indicateur ACB Breakout Arrows . Avec les paramètres par défaut, il analyse les signaux d'achat/vente sur 28 paires de devises et 9 unités de temps simultanément .  Fonctionnalités Peut analyser 252* combinaisons de symboles et d’unités de temps depuis un seul graphique. Ouvrez le graphique du signal avec un modèle prédéfini en un seul clic.  Déplacement facile du panneau n’importe où sur le graphique par glisser-déposer.
Dual-Period Williams %R Oscillator for MT5 A sophisticated trend exhaustion detector that combines two Williams %R oscillators to identify high-probability reversal opportunities through confluence analysis. ======================================================================================== Key Features Intelligent Dual-Signal System Fast and Slow Williams %R periods working in confluence Real-time trend exhaustion detection with reliable signals Optimized calculations for smooth MT5 perfor
Liquidity Map
Alex Amuyunzu Raymond
Liquidity Map  Overview The Liquidity Map indicator is an advanced visualization tool based on ICT Smart Money Concepts . It automatically identifies daily Buy Zones , Sell Zones , and Liquidity Levels , showing where price is likely to reverse or continue based on institutional order flow. It calculates key levels from the daily session — such as the previous day’s high, low, and midpoint — then derives a premium (sell bias) and discount (buy bias) structure. When price trades into these mapped
Giant M5
Artem Konkov
Cet indicateur multitâche poursuit la tradition du géant sur la plate-forme MT5. Il est basé sur des indicateurs de droits d'auteur qui recueillent des signaux de différents graphiques. Très souvent, le prix commence à se déplacer dans la direction indiquée après quelques minutes. La répétition fréquente des signaux dans une direction indique la tendance actuelle. Les signaux pour le commerçant sont les flèches sur le graphique et les alertes. Tout est configuré pour le commerce. Il suffit de
Titre : PulseGuard MT5 : Système de Tendance et Momentum PulseGuard MT5 est un outil de trading professionnel qui combine la puissance de l'analyse technique classique avec la précision des indicateurs de momentum. Cet indicateur est conçu pour identifier les points d'entrée optimaux au moment précis où le marché reprend son élan, tout en restant strictement aligné avec la tendance de fond. Avantages Clés : Zéro Repeindre (Non-Repaint) : Les signaux sont fixés à la clôture de la bougie. Doubl
CRT Pro Dashboard – Multi Timeframe Candle Range Theory Tool CRT Pro Dashboard is a professional multi-timeframe Candle Range Theory (CRT) analysis tool designed for traders who focus on range-based market behavior, liquidity interaction, and structured price expansion . The indicator continuously scans multiple timeframes to detect valid CRT formations , tracks their progression in real time, and displays their status through a clean, intuitive dashboard directly on the chart. What the indic
AdvancedCandleWrapper
Douglas Mbogo Ntongai
Draw as many custom candles as possible on a single chart with this special indicator. Your analysis skill will never be the same again for those who know the power that having a hawkeye view of all price action at once provides. Optimized for performance and allows customization on the appearance of candle bodies and wicks. This is an integral part of analysis at our desks, we hope it will never leave your charts too once you can use it to its full potential.
Sigma VWAP Bands Sigma VWAP Bands (Rolling) is a technical analysis indicator that plots upper and lower bands based on the statistical deviation of price from a rolling Volume-Weighted Average Price (VWAP). The indicator is designed to visualize price dispersion around VWAP using a user-defined lookback window and a configurable standard deviation multiplier. Parameters Lookback Period Number of bars used for VWAP and standard deviation calculations. Sigma Factor Multiplier applied to the cal
The indicator scans for TD Combo signals in multiple timeframes for the all markets filtered and shows the results on Dashboard. Key Features Dashboard can be used for all markets It can scan for signals on MN1, W1, D1, H4, H1, M30, M15 ,M5, M1 timeframes Parameters UseMarketWatch: Set true to copy all symbols available in market watch MarketWatchCount : Set the number of symbols that you want to copy from the market watch list. CustomSymbols: Enter the custom symbols that you want to be availa
SunSignal ML — AI Gold Signals with Multi-Timeframe Confluence SunSignal ML is an advanced AI-powered signal indicator purpose-built for XAUUSD gold trading. It combines a proprietary adaptive trend algorithm with six machine learning models trained on confirmed price pivots to produce high-confidence entry signals with multi-timeframe validation. The indicator runs efficiently on M1, M5 and M15 timeframes and is designed for traders who want precision entries guided by data rather than guesswor
Fibonacci Sonar
Lorentzos Roussos
Fibonacci Sonar Le sonar de Fibonacci dispose d'une bibliothèque interne de modèles d'action des prix rassemblés à partir de 28 symboles et de 7 périodes de temps. Chaque modèle est divisé en 2 côtés. Le côté avant et le côté après. Le sonar de Fibonacci utilise le côté avant pour reconnaître des modèles similaires. L'action de prix la plus récente (à tout moment) jusqu'au prix d'ouverture de la barre la plus récente est ce qui est utilisé comme côté avant pour rechercher dans la bibliothèque.
Cet indicateur de tableau de bord d'offre et de demande à plusieurs périodes et à plusieurs symboles envoie des alertes lorsque le prix a atteint une zone d'offre/demande. Il est également possible de l'utiliser pour être alerté des doubles hauts/bas réguliers au lieu des zones. Il peut être utilisé avec toutes les plages horaires de M1 à MN.       Un maximum de 9 périodes peuvent être affichées dans le tableau de bord en même temps.   Il est possible d'utiliser des filtres RSI, divergence (MACD
DTFX Algo Zones are auto-generated Fibonacci Retracements based on market structure shifts. These retracement levels are intended to be used as support and resistance levels to look for price to bounce off of to confirm direction.   USAGE Figure 1 Due to the retracement levels only being generated from identified market structure shifts, the retracements are confined to only draw from areas considered more important due to the technical Break of Structure (BOS) or Change of Character (CHo
Dark Breakout MT5
Marco Solito
3.25 (4)
Dark Breakout   is an Indicator for intraday trading. This Indicator is based on Trend Following  strategy, providing an entry signal on the breakout. The signal is provided by the arrow, which confirms the breaking of the level. We can enter in good price with this Indicator, in order to follow the main trend on the current instrument. It is advised to use low spread ECN brokers. This Indicator does Not repaint and N ot lag . Recommended timeframes are M5, M15 and H1. Recommended working pairs
Les acheteurs de ce produit ont également acheté
SuperScalp Pro
Van Minh Nguyen
5 (11)
SuperScalp Pro – Système d’indicateur de scalping avancé multi-filtres SuperScalp Pro est un système d’indicateur de scalping avancé qui combine le Supertrend classique avec plusieurs filtres de confirmation intelligents. L’indicateur fonctionne efficacement sur toutes les unités de temps de M1 à H4 et est particulièrement adapté à XAUUSD, BTCUSD et aux principales paires Forex. Il peut être utilisé comme système autonome ou intégré de manière flexible dans des stratégies de trading existantes.
Azimuth Pro
Ottaviano De Cicco
5 (6)
LAUNCH PROMO Azimuth Pro price is initially set at 299$ for the first 100 buyers. Final price will be 499$ . THE DIFFERENCE BETWEEN RETAIL AND INSTITUTIONAL ENTRIES ISN'T THE INDICATOR — IT'S THE LOCATION. Most traders enter at arbitrary price levels, chasing momentum or reacting to lagging signals. Institutions wait for price to reach structured levels where supply and demand actually shift. Azimuth Pro maps these levels automatically: swing-anchored VWAP, multi-timeframe structure lines, an
Divergence Bomber
Ihor Otkydach
4.89 (83)
Chaque acheteur de cet indicateur reçoit également gratuitement : L’outil exclusif « Bomber Utility », qui accompagne automatiquement chaque opération de trading, fixe les niveaux de Stop Loss et de Take Profit, et clôture les positions selon les règles de la stratégie Des fichiers de configuration (set files) pour adapter l’indicateur à différents actifs Des set files pour configurer le Bomber Utility selon différents modes : « Risque Minimum », « Risque Équilibré » et « Stratégie d’Attente » U
ARICoins
Temirlan Kdyrkhan
ARICoin is a powerful trading companion designed to generate high-probability entry signals with dynamic TP/SL/DP levels based on volatility. Built-in performance tracking shows win/loss stats, PP1/PP2 hits, and success rates all updated live. Key Features: Buy/Sell signals with adaptive volatility bands Real-time TP/SL/DP levels based on ATR Built-in MA Filter with optional ATR/StdDev volatility Performance stats panel (Success, Profit/Loss, PP1/PP2) Alerts via popup, sound, push, or email Cust
Entry In The Zone and SMC Multi Timeframe is a real-time market analysis tool developed based on Smart Money Concepts (SMC). It is designed to analyze market structure, price direction, reversal points, and key zones across multiple timeframes in a systematic way. The system displays Points of Interest (POI) and real-time No Repaint signals, with instant alerts when price reaches key zones or when signals occur within those zones. It functions as both an Indicator and a Signal System (2-in-1), c
Si vous achetez cet indicateur, vous recevrez mon Gestionnaire de Trading Professionnel + EA  GRATUITEMENT. Tout d'abord, il convient de souligner que ce système de trading est un indicateur non repeint, non redessiné et non retardé, ce qui le rend idéal pour le trading manuel et automatisé. Cours en ligne, manuel et téléchargement de préréglages. Le "Système de Trading Smart Trend MT5" est une solution de trading complète conçue pour les traders débutants et expérimentés. Il combine plus de 10
FX Trend MT5 NG
Daniel Stein
5 (4)
FX Trend NG : La Nouvelle Génération d’Intelligence de Tendance Multi-Marchés Vue d’ensemble FX Trend NG est un outil professionnel d’analyse de tendance multi-timeframe et de surveillance des marchés. Il vous permet de comprendre la structure complète du marché en quelques secondes. Au lieu de naviguer entre de nombreux graphiques, vous identifiez immédiatement quels instruments sont en tendance, où le momentum s’affaiblit et où plusieurs unités de temps sont alignées. Offre de Lancement – Ob
Power Candles MT5
Daniel Stein
5 (6)
Power Candles – Signaux d’entrée basés sur la force pour tous les marchés Power Candles intègre l’analyse de force éprouvée de Stein Investments directement dans le graphique des prix. Au lieu de réagir uniquement au prix, chaque bougie est colorée en fonction de la force réelle du marché, ce qui permet d’identifier instantanément les phases de momentum, l’accélération de la force et les transitions de tendance propres. Une logique unique pour tous les marchés Power Candles fonctionne automatiqu
Trend Screener Pro MT5
STE S.S.COMPANY
4.84 (102)
Indicateur de tendance, solution unique révolutionnaire pour le trading et le filtrage des tendances avec toutes les fonctionnalités de tendance importantes intégrées dans un seul outil ! Il s'agit d'un indicateur multi-période et multi-devises 100 % non repeint qui peut être utilisé sur tous les symboles/instruments : forex, matières premières, crypto-monnaies, indices et actions. Trend Screener est un indicateur de suivi de tendance efficace qui fournit des signaux de tendance fléchés avec des
AriX
Temirlan Kdyrkhan
1 (4)
AriX Indicator for MT5 A powerful trend-following and signal-evaluation tool AriX is a custom MT5 indicator that combines Moving Averages and ATR-based risk/reward logic to generate clear buy/sell signals. It visualizes dynamic SL/TP levels, evaluates past trade outcomes, and displays win/loss statistics in a clean on-chart panel. Key features include: Buy/Sell signals based on MA crossovers ATR-based SL/TP1/TP2/TP3 levels with visual lines and labels Signal outcome tracking with real-time stat
[ My Products ] , [ My Channel ]   ,  [ LIVE SIGNAL ] HFT Spike Detector HFT Spike Detector est un outil professionnel de surveillance des ticks conçu pour analyser et mesurer en temps réel les mouvements de prix à haute fréquence (pics soudains causés par le HFT). Son objectif est de vous permettre de détecter les glissements anormaux, les lacunes de liquidité et les pics de prix au niveau milliseconde causés par le broker, à l'aide de données numériques. Comme il analyse le flux de ticks e
FX Power MT5 NG
Daniel Stein
5 (31)
FX Power : Analysez la force des devises pour des décisions de trading plus intelligentes Aperçu FX Power est l'outil essentiel pour comprendre la force réelle des principales devises et de l'or, quelles que soient les conditions du marché. En identifiant les devises fortes à acheter et les faibles à vendre, FX Power simplifie vos décisions de trading et révèle des opportunités à forte probabilité. Que vous suiviez les tendances ou anticipiez les retournements à l'aide de valeurs extrêmes de D
RFI levels PRO MT5
Roman Podpora
3.67 (3)
L'indicateur montre avec précision les points de retournement et les zones de retour des prix où le       Acteurs majeurs   . Vous repérez les nouvelles tendances et prenez des décisions avec une précision maximale, en gardant le contrôle de chaque transaction. VERSION MT4     -    Révèle son potentiel maximal lorsqu'il est combiné à l'indicateur   TREND LINES PRO Ce que l'indicateur montre : Structures et niveaux d'inversion avec activation au début d'une nouvelle tendance. Affichage des nivea
Grabber System MT5
Ihor Otkydach
4.83 (23)
Je vous présente un excellent indicateur technique : Grabber, qui fonctionne comme une stratégie de trading "tout-en-un", prête à l'emploi. En un seul code sont intégrés des outils puissants d'analyse technique du marché, des signaux de trading (flèches), des fonctions d'alerte et des notifications push. Chaque acheteur de cet indicateur reçoit également gratuitement : L'utilitaire Grabber : pour la gestion automatique des ordres ouverts Un guide vidéo étape par étape : pour apprendre à installe
OmniSync Projection
Antonio-alin Teculescu
5 (1)
Chronos Fractal Engine is an innovative price projection indicator for MetaTrader 5, designed to transform your technical analysis by intelligently identifying and projecting historical price patterns. Built upon an advanced correlation algorithm and the fractal principles of the market, this powerful tool visualizes potential future price movements, giving you a unique edge in your trading decisions. What is Chronos Fractal Engine? At its core, the Chronos Fractal Engine employs a sophisticat
Atomic Analyst MT5
Issam Kassas
3.94 (31)
Tout d'abord, il convient de souligner que cet indicateur de trading n'est ni repainting, ni redrawing et ne présente aucun délai, ce qui le rend idéal à la fois pour le trading manuel et automatisé. Manuel de l'utilisateur : réglages, entrées et stratégie. L'Analyste Atomique est un indicateur d'action sur les prix PA qui utilise la force et le momentum du prix pour trouver un meilleur avantage sur le marché. Équipé de filtres avancés qui aident à éliminer les bruits et les faux signaux, et à
Trend indicator AI mt5
Ramil Minniakhmetov
5 (15)
L'indicateur Trend Ai est un excellent outil qui améliorera l'analyse du marché d'un trader en combinant l'identification des tendances avec des points d'entrée exploitables et des alertes d'inversion. Cet indicateur permet aux utilisateurs de naviguer dans les complexités du marché forex avec confiance et précision Au-delà des signaux primaires, l'indicateur Trend Ai identifie les points d'entrée secondaires qui surviennent lors des retraits ou des retracements, permettant aux traders de capit
TREND LINES PRO   Cet indicateur permet de comprendre les véritables changements de direction du marché. Il révèle les renversements de tendance et les points de retour des principaux acteurs. Tu vois   Lignes BOS   Détection des changements de tendance et des niveaux clés sur des unités de temps supérieures, sans paramètres complexes ni interférences inutiles. Les signaux restent affichés sur le graphique même après la fermeture de la bougie. Version MT4   -   Révèle son potentiel maximal lorsq
Smart Stop Indicator – Précision intelligente du stop-loss directement sur votre graphique Présentation Smart Stop Indicator est la solution idéale pour les traders qui souhaitent placer leur stop-loss de manière claire et méthodique, sans deviner ni suivre leur intuition. Cet outil combine la logique classique de price action (succession de plus hauts et de plus bas) avec une reconnaissance moderne des cassures pour identifier le prochain niveau de stop réellement logique. Que le marché soit
ARIPoint
Temirlan Kdyrkhan
ARIPoint is a powerful trading companion designed to generate high-probability entry signals with dynamic TP/SL/DP levels based on volatility. Built-in performance tracking shows win/loss stats, PP1/PP2 hits, and success rates all updated live. Key Features: Buy/Sell signals with adaptive volatility bands Real-time TP/SL/DP levels based on ATR Built-in MA Filter with optional ATR/StdDev volatility Performance stats panel (Success, Profit/Loss, PP1/PP2) Alerts via popup, sound, push, or email Cu
Tout d'abord, il convient de souligner que cet outil de trading est un indicateur non repeint, non redessiné et non retardé, ce qui le rend idéal pour le trading professionnel. Cours en ligne, manuel utilisateur et démonstration. L'indicateur Smart Price Action Concepts est un outil très puissant à la fois pour les nouveaux et les traders expérimentés. Il regroupe plus de 20 indicateurs utiles en un seul, combinant des idées de trading avancées telles que l'analyse du trader Inner Circle et le
Quantum TrendPulse
Bogdan Ion Puscasu
5 (22)
Présentation de   Quantum TrendPulse   , l'outil de trading ultime qui combine la puissance de   SuperTrend   ,   RSI   et   Stochastic   dans un seul indicateur complet pour maximiser votre potentiel de trading. Conçu pour les traders qui recherchent précision et efficacité, cet indicateur vous aide à identifier les tendances du marché, les changements de dynamique et les points d'entrée et de sortie optimaux en toute confiance. Caractéristiques principales : Intégration SuperTrend :   suivez f
FX Levels MT5
Daniel Stein
5 (13)
FX Levels : Des zones de Support et Résistance d’une Précision Exceptionnelle pour Tous les Marchés Présentation Rapide Vous recherchez un moyen fiable pour déterminer des niveaux de support et résistance dans n’importe quel marché—paires de devises, indices, actions ou matières premières ? FX Levels associe la méthode traditionnelle « Lighthouse » à une approche dynamique de pointe, offrant une précision quasi universelle. Grâce à notre expérience réelle avec des brokers et à des mises à jour
Pips Stalker mt5
Abdulkarim Karazon
5 (2)
Le Pips Stalker est un indicateur de type flèche long et court, il aide les traders de tous niveaux à prendre de meilleures décisions en négociant le marché, l’indicateur ne se repeint jamais et utilise le RSI comme logique principale du signal ; une fois une flèche donnée, elle ne repeint ni ne repeint plus et les flèches ne sont pas retardées. VERSION MT4 <---- CARACTÉRISTIQUES DE LA FLÈCHE PIPS STALKER : PANNEAU DE STATISTIQUES Un tableau de bord d’informations unique qui montre le po
FX Dynamic MT5
Daniel Stein
5 (5)
FX Dynamic : Suivez la volatilité et les tendances grâce à une analyse ATR personnalisable Vue d’ensemble FX Dynamic est un outil performant s’appuyant sur les calculs de l’Average True Range (ATR) pour fournir aux traders des informations incomparables sur la volatilité quotidienne et intrajournalière. En définissant des seuils de volatilité clairs — par exemple 80 %, 100 % et 130 % — vous pouvez rapidement repérer des opportunités de profit ou recevoir des avertissements lorsque le marché dé
Matrix Arrow Indicator MT5
Juvenille Emperor Limited
5 (18)
Matrix Arrow Indicator MT5   est une tendance unique 10 en 1 suivant un indicateur multi-période   100% non repeint   qui peut être utilisé sur tous les symboles/instruments:   forex ,   matières premières ,   crypto-monnaies ,   indices ,  actions .  Matrix Arrow Indicator MT5  déterminera la tendance actuelle à ses débuts, en rassemblant des informations et des données à partir d'un maximum de 10 indicateurs standard, qui sont: Indice de mouvement directionnel moyen (ADX) Indice de canal de m
Market Structure Order Block Dashboard MT5 est un indicateur MT5 axé sur la structure de marché et les concepts ICT / Smart Money : HH/HL/LH/LL , BOS , ChoCH , ainsi que Order Blocks , Fair Value Gaps (FVG) , Liquidité (EQH/EQL, sweeps), Sessions / Kill Zones et un Volume Profile intégré, avec un dashboard compact de confluence. Important : c’est un outil d’analyse . Il ne passe aucun ordre (ce n’est pas un EA). Bonus acheteurs Après achat, vous pouvez recevoir 2 indicateurs bonus (au choix) pa
Candle Smart Range
Gianny Alexander Lugo Sanchez
5 (1)
Candle Smart Range (CSR) pour MetaTrader 5 Candle Smart Range est un indicateur technique conçu pour l'identification automatique des plages de prix sur plusieurs unités de temps. Cet outil analyse la structure du marché en se basant sur les formations de bougies et l'interaction du prix avec les plus hauts et plus bas précédents. Caractéristiques principales : Détection de Plages : Identifie les zones de consolidation avant les mouvements impulsifs. Identification des Fausses Cassures : Marque
Crystal Heikin Ashi Signals
Muhammad Jawad Shabir
5 (1)
Crystal Heikin Ashi Signals - Professional Trend & Signal Detection Indicator Advanced Heikin Ashi Visualization with Intelligent Signal System for Manual & Automated Trading Final Price: $149 ---------> Price goes up $10 after every 10 sales . Limited slots available — act fast . Overview Crystal Heikin Ashi Signals is a professional-grade MetaTrader 5 indicator that combines pure Heikin Ashi candle visualization with an advanced momentum-shift detection system. Designed for both manual traders
Btmm state engine pro
Garry James Goodchild
5 (2)
Get the user guide here  https://g-labs.software/guides/BTMM_State_Engine_Welcome_Pack.html BTMM State Engine Pro — the   all-in-one Banks   & Institutions Market Maker indicator for Meta Trader 5. Built for   BTMM traders who follow the Asian   session breakout methodology with Kill Zone timing , level stacking, peak formation detection , and multi-pair scanning — all   from a single chart. Combines   a full BTMM State Engine   with a built-in multi-pair Scanner dashboard, eliminating the need
Plus de l'auteur
Double Tops And Bottoms MT5
Alexander Nikolaev
4.29 (7)
Cet indicateur trouve et affiche les modèles d'analyse technique Double Bottom et Double Top. Signale (affiche un message à l'écran) si la forme a été formée récemment. Souvent, après l'apparition de ces modèles, la tendance s'inverse ou une correction se produit. Afin de ne pas les rechercher vous-même, ou de ne pas rater leur apparition, il suffit d'ajouter un indicateur au graphique. L'indicateur peut être utilisé sur différentes périodes et paires de devises, il existe des paramètres pour u
FREE
Channels Pro MT5
Alexander Nikolaev
5 (1)
This indicator determines the channels along which prices move on the trading history. There are many trading strategies that rely on channel trading on a channel breakout. This indicator can draw price channels by reading information from several timeframes at once (from the current, from the second and third). You can customize the color and thickness of the lines for each timeframe. Also, you can set a different distance between highs and lows to draw channels or lines. There is also a simple
Easy Channels MT5
Alexander Nikolaev
5 (1)
This indicator draws price channels. Easy to use. It has various settings, for example, you can configure it to show channels only for buy or sell, you can display trend lines instead of channels. There are many trading strategies that are based on trading in channels, you can trade on the rebound from the borders of the channels, or the breakdown of the channel.   Parameters History - the maximum number of bars for building channels; Distance - the minimum distance from one maximum (or minimum
ADX Channel Indicator
Alexander Nikolaev
4.8 (5)
This indicator forms a channel based on the readings of the ADX (Average Directional Movement Index) indicator, displays and informs the trader of a price reversal at the boundaries of this channel, and can also report when the price touches the channel boundaries. It also draws additional dotted lines, which depend on the readings of the + DI and -DI of the ADX indicator. It also has an option for filtering signals depending on the readings of the stochastic. The channel drawn by this indicato
FREE
Trend Stream Scalper MT5
Alexander Nikolaev
5 (2)
This EA trades with the trend using several methods to identify and enter a trade. For example, it uses trendlines, Gator and Stochastic indicators to analyze the market. In addition to trading, it can also display trend lines that it trades based on. It has filters for ADX and MA indicators, as well as a sufficient number of settings to be able to optimize on various currency pairs and timeframes. The EA sets stop loss and take profit for each trade, does not have risky trading methods. It is
Doji Finder Indicator MT5
Alexander Nikolaev
4 (2)
The indicator analyzes the chart and identifies Doji candlesticks. Shows their appearance and signals the appearance of such a candle (if allowed in the parameters). Also, this indicator shows the strength of the reversal in the form of bars of different colors (the more green, the more likely the rise, the more red - the fall in price). The direction of the signal depends on the direction of the previous candles, as the Doji signals a reversal or correction. In the indicator settings, you can
FREE
ADX Channel
Alexander Nikolaev
4.67 (3)
ADX Channel is an indicator that plots the channel depending on the values of the ADX (Average Directional Movement Index) indicator. The resulting channel is a little similar to the Envelopes, but its lines depend on the market volatility. The sell trade is usually executed fast when the price touches and bounces from the upper line of the channel, buy - from the lower. It is recommended to trade when there is no significant news. The recommended timeframes: M5 - H1. The indicator is not design
FREE
Easy Bollinger Bands
Alexander Nikolaev
4.67 (3)
This Expert Advisor trades based on the Bollinger Bands indicator. It performs trades after a price rebound from the borderlines of the indicator. It is simple to use, contains only a few settings, which are easy to understand. This is the simplified version of the Master Bollinger Bands Expert Advisor. For better trading results, it is recommended to use the full version of the EA: https://www.mql5.com/en/market/product/21788 The free version does not provide the ability to use multiple indicat
FREE
Easy Channels
Alexander Nikolaev
4.5 (2)
The indicator draws price channels. It can be customized so that only buy or sell channels are displayed. Also, trend lines can be displayed instead of channels. This indicator is easy to use, but nevertheless, there are many trading strategies based on channel trading. Advisor based on this indicator:  https://www.mql5.com/en/market/product/37952 Parameters History - maximum number of bars to build channels; Distance - minimum distance from one High (or Low) to another when constructing a chann
FREE
Easy Parabolic Sar
Alexander Nikolaev
4.4 (5)
The Expert Advisor places orders based on the points of the Parabolic Sar indicator. If your trading strategy utilizes this indicator, the EA will save you from the necessity to move your pending orders after every candlestick (e.g. 5 minutes or 1 hour) and will do it automatically. You can set the EA to open only BuyStop or only SellStop or both. Buy default both Buy and Sell are enabled. The EA does not use any indicators other than Parapolic Sar. Therefore you are to decide the time to run th
FREE
Free indicator to quickly detect trendline breakouts and high or low of a price range. It displays lines based on the highs and lows of prices, and also finds and displays inclined trend lines. As soon as the price goes beyond the line and the candlestick closes, the indicator signals this with an arrow (you can also enable an alert). This indicator is easy to use and also free. The number of candles for defining trend lines as well as the high and low of the trading range is configurable. It w
FREE
Break Lines
Alexander Nikolaev
4.67 (3)
The indicator draws lines the the price highs and lows. Break through the high or low usually indicates trend change (or continuation). Once the price moves through a line, and the candlestick closes, the indicator draws an appropriate arrow (also, you can enable alerts). A deal should be conducted in the breakthrough direction immediately or after a slight rollback. It is best to trade following the trend on a larger timeframe. This indicator is easy to use, but nevertheless, there are many tra
FREE
Trend and correction indicator
Alexander Nikolaev
4.17 (6)
The indicator finds strong trend movements of a currency pair over the specified number of bars. It also finds correction to this trend. When the trend is strong enough, and the correction becomes equal to the values specified in the parameters, the indicator generates a signal. You can set different correction values, while the best suiting are 38, 50 and 62 (Fibonacci levels). In addition, you can configure the minimum length of trend, the number of history bars for search and other parameters
FREE
Moving averages are very often used for analyzing currency pairs and trading. This Expert Advisor can analyze many moving averages at once and trade based on this. When the required number of moving averages signal a purchase, the adviser makes a purchase, if the indicators signal a sale, the advisor sells. Also, there is filtering spurious signals at low volatility based on the ADX indicator. In the settings of the adviser, you can set the required number of sliding ones, their period (the init
Easy Candles
Alexander Nikolaev
3 (1)
This is a simple and free Expert Advisor that trades candlesticks. It compares several nearest bars and their volumes, and opens a trade based on that data. Unlike the professional version , it analyzes only 1 timeframe. The recommended timeframes for this EA are H1, H4, D1, it works with any currency pairs. The parameters always need to be optimized before trading, as well as after some period of trading. Input Parameters Lots - lot size (if Lots=0, then the lot will be calculated based on the
FREE
Bollinger with WPR demo
Alexander Nikolaev
4.33 (3)
This Expert Advisor is the free version of "Bollinger with WPR scalper", which is based on the Bollinger bands and Williams' Percent Range indicators. Limitations of the free version: lot is fixed to 0.01, only the EURUSD currency pair is supported, trading time cannot be selected, trailing stop is not available. Nevertheless, it can make quite a lot of deals, so you do not have to wait for positions to be opened (with the appropriate settings and timeframes below H1). The EA can be used on time
FREE
This indicator is able to determine the price levels at which there was the most volume for the specified period of history. In the future, the price often bounces off such levels, and this can be successfully applied in trading. They are displayed as lines, some parameters for determining the levels can be adjusted. This indicator is simple, therefore, it does not report signals, and only builds levels on EUR/USD. Parameters HistoryBars - the number of bars to determine the near volume levels;
FREE
Volume Levels USDJPY
Alexander Nikolaev
3.5 (2)
Volume Levels is a very important indicator for exchange trading. Most of the trades were performed on those levels. This indicator displays the price level that had the most trade volumes over a certain period of time. Often, the price bounces from those levels in the future, and it can be successfully used in trading. This is a demo version that works only on the USD/JPY currency pair. To work on all currency pairs, install the full version: https://www.mql5.com/en/market/product/15888 Parame
FREE
Three Fractals demo
Alexander Nikolaev
This Expert Advisor identifies trend reversals based on fractals and some other indicators. It is a free lite version of Three fractals Brief description of the trading strategy: when the fractals were formed after a prolonged fall, and the last fractal did not update the minimum of the previous bar's lower fractal, then a trend reversal is determined (at the same time, there must be a fractal in the middle, which is higher than the others). Similarly, opposite for growth. In case other indicato
FREE
Colored Candles Demo
Alexander Nikolaev
5 (1)
The demo version of the Colored Candles indicator - calculates the parameters of each candle, as well as its volume. After that, it paints the candles depending on their strength and direction. Bullish candles are colored green and bearish candles - red. The greater the power of the bulls or the bears, the brighter the color. You can change the colors if you want. The indicator helps to analyze the price movement, as well as market entry points. The more accurate signals are formed on the higher
FREE
Trailing stop for advisors
Alexander Nikolaev
4.5 (2)
The utility manages other EAs' orders as well as the ones opened manually. It is capable of trailing the price (trailing stop function), set a stop loss and take profit if they have not been set before. When configuring the utility for an EA having no trailing stop function, place it to the new window with the same currency pair specifying the same Magic value (as for the EA orders the stop loss is to be applied to). You can set any timeframe. It does not affect the utility operation. Set Magic
FREE
Volume Candles
Alexander Nikolaev
Volumes are one of the most important factors of trading, as it is the high volumes that move the market in either direction. But there are very few standard indicators for volumes in MetaTrader 4. The Volume Candles analyses the volumes of the trades and displays candles depending on these volumes. The candle appears once the required number of volumes has passed during trading (the VolumeCandle parameter). If the candles close frequently and are thin, then the volumes on the market are current
Volume Levels
Alexander Nikolaev
5 (3)
Volume Levels is a very important indicator for exchange trading. Most of the trades were performed on those levels. This indicator displays the price level that had the most trade volumes over a certain period of time. Often, the price bounces from those levels in the future, and it can be successfully used in trading. It works on any currency pair. Parameters HistoryBars - the number of bars to determine the near volume levels; Range - the maximum distance above and below the current price to
EMA 8 and 18 Trading System
Alexander Nikolaev
2 (1)
This EA implements the EMA 8/18 strategy, which is used by many traders. Brief description of the strategy: The Buy is determined when the EMA 8 indicator crosses the EMA 18 from below, with the price moving more than 50 points from the crossing. The buy position is opened when the price touches the EMA for the first time, after that, as the price rises, the trade is maintained by a trailing stop with a step of 30-35 points. The opposite is for opening a sell position. The parameters of the fast
ProCandles
Alexander Nikolaev
Some experienced trades can tell where the price will go even without indicators, as the direction of the price can be found using the ordinary candlesticks. The EA compares several nearest bars and their volumes, and opens a trade based on that data. Also, it is able to analyze the candles on two timeframes at the same time to make the entry more accurate and less risky. In addition, the EA can automatically determine the take profit and stop loss size depending on the size of the previous cand
Colored candles
Alexander Nikolaev
Some candles have a strong tendency to continue the movement or to revert it. With the help of the Colored candles indicator such movements are clearly visible. This indicator calculates the parameters of each candle, as well as its volume, and after that it paints the candles depending on its strength and direction. Bullish candles are colored green and bearish candles - red. The greater the power of the bulls or the bears, the brighter the color. You can change the colors if you want. The indi
It is good to know the presence of a trend on multiple timeframes at once. And even better - on multiple currency pairs at once. This indicator allows to quickly determine the presence of a trend or a flat on 8 timeframes and from 1 to 15 currency pairs at once. Multi Alligator Signals analyzes the signals of the Alligator indicator by Bill Williams on every timeframe (from M1 to W1) and multiple currency pairs (up to 15) simultaneously. If there is a buy signal, a green upward arrow is drawn, i
Parabolic And CCI
Alexander Nikolaev
The EA detects strong movements using the Parabolic indicator and opens a trade. The Commodity Channel Index (CCI) is used as an auxiliary indicator. The CCI levels may depend on the ADX indicator values, which allows for better trading with different volatility. Also, the trades are opened depending on the RSI indicator values on a certain timeframe. Recommended timeframes: M5, M15, M30. Make sure to optimize the parameters of the EA for your account before trading. Input Parameters Lots - lot
Breakout Trend Lines
Alexander Nikolaev
5 (2)
The indicator draws lines based on the price Highs and Lows, as well as slant trend lines. Break through the trend line, High or Low usually indicates trend change (or continuation). Once the price moves through a line, and the candlestick closes, the indicator draws an appropriate arrow (also, you can enable alerts). This indicator is easy to use, but nevertheless, there are many trading strategies, which are based on a breakthrough of the trend lines. The number of candlesticks used to determi
Channels Pro
Alexander Nikolaev
5 (3)
The indicator determines and plots price channels or lines, reading information from multiple timeframes (from current, second and third) simultaneously. Color and width of lines for each timeframe can be customized. It is also possible to set different distance between the Highs and Lows for plotting channels or lines. Parameters History - maximum number of bars to plot channels or lines; Distance - minimum distance from one High (or Low) to another when plotting lines; Shift - shift for sever
Filtrer:
Aucun avis
Répondre à l'avis