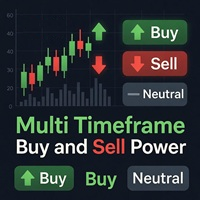
Multi Timeframe Buy and Sell Power MT4

5

Multi Timeframe Buy and Sell Power MT4

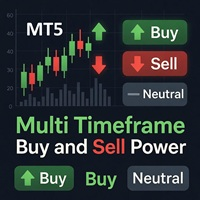
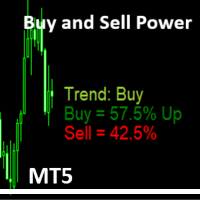
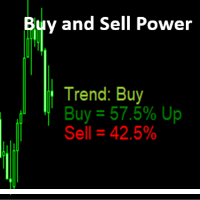
The Multi Timeframe Buy and Sell Power indicator for MetaTrader 4 is a versatile tool designed to provide traders with a clear visual representation of market pressure across nine standard timeframes, from M1 to MN1. By aggregating buy and sell strength percentages derived from recent price action and tick volume, it helps identify potential trends, reversals, and neutral conditions in real-time. The indicator displays this information in a compact dashboard format on the chart, with color-coded signals for quick interpretation—such as "Strong Buy" in lime green for  dominantupward pressure or "Reversal Incoming" in gold when extremes are reached. Unique to this tool is its focus on volume-weighted calculations, making it particularly useful for forex, stocks, and commodities trading where understanding multi-timeframe alignment can enhance decision-making. For example, if lower timeframes show "Buy" signals while higher ones indicate "Trend Max UP," it might suggest a strong continuation opportunity, all presented without cluttering the chart.

Support and questions via MQL5 product comments.

For questions, updates, and to connect with other traders, join my official MQL5 group ForexEAandMore


How It Works

At its core, the indicator calculates buy pressure by analyzing the last 14 bars (configurable via the VolumePeriod input) on each selected timeframe. For every bar, it evaluates the body size relative to the full range (high-low), multiplies by the tick volume for weighting, and assigns a directional score: positive for bullish closes and negative for bearish. The resulting buy percentage is the normalized bullish total out of 100%, with sell percentage as the complement—appending "Up" or "Dn" for values over 51% to highlight direction. Signals are threshold-based: above 62% buy triggers "Strong Buy," while 70% or more flags a potential reversal. The "Main Trend" column averages these across all visible timeframes, offering a holistic view. This method avoids traditional oscillators like RSI or MACD, instead relying on pure price-volume dynamics for robustness, though it's best used in conjunction with other tools for confirmation. In practice, attach it to a chart like EURUSD H1, enable desired timeframes, and watch for signal changes, which can trigger optional alerts with a 3-minute cooldown to prevent overload.

Features and Setup

Key features include customizable refresh rates (tick or 1-second), auto-positioning of labels for any chart size, and alert options via sound, push notifications, or email for main trend shifts. Users can tweak fonts, colors (e.g., green for buy, red for sell), and offsets for a personalized display, with debug mode for troubleshooting. Attach to your MT4 chart—adjust inputs like showing only H1-D1 for swing trading or enabling all for scalping. No additional libraries are required, and it's compatible with automated strategies via iCustom calls. For visuals, refer to attached screenshots showing the dashboard on a live EURUSD chart, or demo videos demonstrating alert triggers during volatile sessions.


Customizable Dashboard Positioning

  • Auto Positioning mode keeps the panel centered on the chart
  • Manual placement available via:
  • Horizontal Offset
  • Vertical Offset
  • Column Spacing
  • Row Spacing
  • Flexible Display Settings
  • Adjustable Volume Period for the power calculation
  • Font size, font family, and individual colors for every signal type
  • Independently show/hide any timeframe

Alert System 

  • Notification options: 
  • On-screen alerts Push notifications
  • Email alerts
  • Alerts trigger when the Main Trend value changes
  • Built-in cooldown timer prevents repeated alerting

Debug mode available for testing

  •  Performance & Compatibility
  • Updates every new tick or at a user-defined interval
  • Optimized to minimize CPU load
  • Compatible with all MT4 assets and chart types

Disclaimer

This indicator is provided for informational purposes only and does not constitute financial advice. Past performance calculated via historical data does not guarantee future results, and trading involves risk of loss. Always test in a demo account, combine with proper risk management, and consult a professional advisor. The developer assumes no liability for any trading decisions based on this tool. Translations available in English, Russian, Spanish, and other languages via MQL5 tools for global accessibility.

Avis 2
Gerd
49
Gerd 2026.10.25 08:00 

Sehr hilfreicher Indikator.

Hector Manuel
456
Hector Manuel 2025.12.15 19:45 

No es claro como calcula los valores. ¿Podrías dar un ejemplo?

Marco, gracias por la explicación.

Produits recommandés
Smoothed Heiken Ashi with AC/AO Zones – Professional Trading Clarity Transform your Heiken Ashi analysis with intelligent smoothing that eliminates noise while preserving actionable signals. What Makes This Different? This isn't just another Heiken Ashi indicator. We've engineered a sophisticated smoothing engine that works with the Accelerator (AC) and Awesome Oscillator (AO) zone logic to give you cleaner entries and exits without sacrificing responsiveness. Four Smoothing Methods at Your Comm
For those who like trend the Force will be a very useful indicator. This is because it is based on the famouse ADX, which measure the strenght of a trend, but without its 3 confusing lines. Force has its very simple interpretation: if the histogram is above zero level the trend is up, otherwise it is down. You can use it to find divergences too, which is very profitable. If you have any doubt or suggestion, please, contact me. Enjoy! MT5 version:  https://www.mql5.com/en/market/product/41928 T
FREE
Shadow Flare MT4
Kestutis Balciunas
L’indicateur Shadow Flare est un outil de tendance et de liquidité non re‑dessinant pour MetaTrader 4. Il calcule une ligne de base configurable à partir d’une moyenne mobile (HMA, EMA, SMA ou RMA), l’entoure d’une enveloppe basée sur l’Average True Range et produit un état de tendance « collant » qui ne bascule que lorsque le prix de clôture franchit la bande supérieure ou inférieure. Le même moteur de tendance alimente un module automatique de zones d’offre/demande qui détecte les sommets et c
FREE
Trend Zig Zag: A Trend Reversal Indicator The Trend Zig Zag is an advanced indicator designed to precisely identify key market reversals and filter out market "noise." By building upon the classic Zig Zag indicator, it gives traders a clearer view of the trend structure, helping them find optimal entry and exit points. Key Advantages: Focus on the Trend : This indicator uses data from a higher timeframe, which lets you ignore minor price fluctuations and focus on significant movements. This i
Hull Trend Flip
Luke Anthony Caras
5 (1)
Hull Trend Flip   identifies the moment the Hull Moving Average changes direction — giving you a clean, visual signal exactly when momentum shifts. The HMA is one of the fastest trend-following moving averages available, minimising lag while remaining smooth. Hull Trend Flip builds on this by splitting the line into two colours —   lime when rising, red when falling   — and firing an   arrow on every confirmed flip , so you never miss a trend change at a glance. Features Hull Moving Average wit
FREE
The   Heikin Ashi indicator   is our version of the Heikin Ashi chart. Unlike competitor products, this indicator offers extensive options for calculating Heikin Ashi candles. In addition, it can be displayed as a classic or smoothed version. The indicator can calculate Heikin Ashi with moving average by four methods: SMA  - Simple Moving Average SMMA  - Smoothed Moving Average EMA  - Exponential Moving Average LWMA  - Linear Weighted Moving Average Main features The indicator shows Heikin As
FREE
Ultimate ADX Multi-timeframe Indicator This indicator provides real-time ADX values for multiple timeframes in one unobtrusive label panel. It i s especially useful for gauging trend strength across timeframes without constantly switching charts. Choose which periods to display, anchor the panel to any chart corner, and color-code ADX strength levels to your taste. Key Features & Personalization Multi-Timeframe ADX - Toggle visibility for 9 built-in periods (M1, M5, M15, M30, H1, H4, D1, W1, MN1
FREE
The indicator allows you to trade binary options. The recommended time frame is М1 and the expiration time is 1 minute. The indicator suitable for auto and manual trading. A possible signal is specified as a arrows above/under a candle. You should wait until the candle closes! Arrows are not re-painted Trade sessions: TOKYO section (Half end) and LONDON section (First half) Currency pairs: EUR/USD Working time frame: M1 Expiration time: 1 minute. The indicator also shows good results when using
FREE
Indicator to be placed in the same folder as Dash to activate the alert filter with Heiken Aish. After downloading the indicator, copy it to the same folder so Dash can read the indicator. It is not necessary to insert it into the chart, this is only for Dash to search for signals and inform the direction of buying and selling of the Indicator. Check if the indicator's path is correct within Dash.
FREE
Quantum Falcon Signal Free is a smart visual trading indicator for MetaTrader 4 designed for Forex and Gold traders. The indicator combines: • Trend analysis • RSI momentum confirmation • MACD momentum filtering • ATR volatility filtering • Higher timeframe confirmation • Smart exit signal detection Main Features: • Smart Buy and Sell signals • Exit Buy / Exit Sell alerts • Real-time dashboard on chart • Professional candle arrows • Multi-timeframe trend confirmation • ATR market volatility filt
FREE
PPR and Engulfing
Yury Emeliyanov
5 (3)
PPR et Engulfing est un indicateur technique unique conçu pour identifier les modèles "PPR" et "Engulfing" sur les graphiques de devises de la plateforme de trading MetaTrader 4 (MT4). Ces modèles peuvent indiquer des retournements ou des continuations de tendance potentiels, fournissant aux traders des signaux précieux pour entrer et sortir du marché. Caractéristiques principales : Détection automatique des modèles : L'indicateur identifie et marque automatiquement les modèles PPR et Engulfing
FREE
HMA Trend
Pavel Zamoshnikov
4.56 (72)
A trend indicator based on the Hull Moving Average (HMA) with two periods. The Hull Moving Average is an improved variant of the moving average, which shows the moment of trend reversal quite accurately. It is often used as a signal filter. Combination of two types of Hull Moving Averages makes a better use of these advantages: HMA with a slow period identifies the trend, while HMA with a fast period determines the short-term movements and signals in the trend direction. Features The movement d
FREE
.....................................hi....................... ................for showing high s and low s and support and resistanses .....................we have a lot of ways............................... it can be helpful for finding trends , higher highs , higher lows , lower highs , lower lows .......................today i write on of thems.......................... ........................you can enter the number of last support and resistanses .........................and it will dra
FREE
The indicator allows you to trade binary options. The recommended time frame is М1 and the expiration time is 1 minute. The indicator suitable for auto and manual trading. A possible signal is specified as a arrows above/under a candle. You should wait until the candle closes! Arrows are not re-painted Trade sessions: LONDON and NEWYORK section Currency pairs: GRB/USD Working time frame: M1 Expiration time: 1 minute. The indicator also shows good results when using the martingale strategy - "Mar
FREE
Wise Men Indicator demo
Bohdan Kasyanenko
3 (2)
The indicator displays signals according to the strategy of Bill Williams on the chart. Demo version of the indicator has the same features as the paid, except that it can work only on a demo account . Signal "First Wise Man" is formed when there is a divergent bar with angulation.  Bullish divergent bar - with lower minimum and closing price in the upper half. Bearish divergent bar - higher maximum and the closing price at the bottom half. Angulation is formed when all three lines of Alligator
FREE
Pin Bars
Yury Emeliyanov
4.83 (6)
Objectif principal: "Pin Bars" est conçu pour détecter automatiquement les barres pin sur les graphiques des marchés financiers. Une barre d'épingle est une bougie avec un corps caractéristique et une longue queue, qui peut signaler un renversement ou une correction de tendance. Comment ça marche: L'indicateur analyse chaque bougie sur le graphique, déterminant la taille du corps, de la queue et du nez de la bougie. Lorsqu'une barre d'épingle correspondant à des paramètres prédéfinis est détec
FREE
Добрый День, всем привет, здравствуйте. Я. трейдер, 20 лет опыта, Вадим Сергеевич Лепехо. Создал этот индикатор на базе уже готового стрелочного индикатора (arrrows_template). Решил с вами поделиться  с наработками. Данный индикатор рисует стрелки по стратегии: "Тринитти". Индикатор выдает сигнал на вход когда rsi ниже 50; AO ниже 0; и Price ниже MA9-ход делаем вниз.  Индикатор выдает сигнал на вход когда rsi выше 50; AO выше 0; и Price выше MA9-ход делаем вверх. Предлагаю на демо-счете протести
FREE
Power Trend Free
Yurij Kozhevnikov
5 (2)
Power Trend Free - the indicator shows the trend strength in the selected period. Input Parameters The indicator has three input parameters: Period - a positive number greater than one, it shows the number of candlesticks used for calculations. If you enter one or zero, there will be no error, but the indicator will not be drawn. Applied Price - the standard "Apply to:" set meaning data used for the indicator calculation: Close - Close prices; Open - Open prices; High - High prices; Low - Low p
FREE
The Hong Kong Stock Exchange Session's Hours This indicator facilitates observing the currency pair's quotations during subsequent parts of the stock exchange session live. Before the session starts, a rectangle is drawn on the chart but not filled in with color. It means the extent of the session duration. Before the first bar enters the rectangle of the session, a sound signal or pop-up window will notify us that the session will just start. When the price graph crosses the edge of the sessi
FREE
Heiken Ashi Smoothed A two-stage smoothed Heiken Ashi indicator that filters out market noise for clearer trend reading. What it does Heiken Ashi Smoothed applies a two-stage moving average process on top of the classic Heiken Ashi formula. First, the raw price data is smoothed with a moving average; the Heiken Ashi candles are then built from that smoothed price. A second moving average pass smooths the resulting candles again, producing a cleaner, calmer picture of trend direction with fewer f
FREE
Three Bar Reversal
Yury Emeliyanov
3 (2)
Three Bar Reversal (MT4) — free indicator Three Bar Reversal is a simple and effective MetaTrader 4 indicator that detects the classic three-bar reversal candlestick pattern with additional filtering based on ATR and candle body sizes. Arrows are displayed on the last closed candle of the pattern, and push notifications are also sent. An automated trading robot Three Bar Reversal EA has been developed based on this indicator. The indicator works on all currency pairs and timeframes but pe
FREE
Powered by SVX Strategies Quant Team This indicator is part of our internal toolkit for institutional volatility analysis. We are releasing it for free to support the retail trading community. Looking for Automated Results? Manual execution is prone to human error. If you prefer consistent results managed by our team, you can copy our official algorithms directly on MQL5: Copy "Friday Pulse" (Conservative/Stable) Copy "SVX AI Systems" (High Growth) ABOUT ADAPTIVE RSI BANDS Unlike traditional R
FREE
PZ Three Drives
PZ TRADING SLU
5 (2)
This indicator finds Three Drives patterns. The Three Drives pattern is a 6-point reversal pattern characterised by a series of higher highs or lower lows that complete at a 127% or 161.8% Fibonacci extension. It signals that the market is exhausted and a reversal can happen. [ Installation Guide | Update Guide | Troubleshooting | FAQ | All Products  |  Get Help ] Customizable pattern sizes Customizable colors and sizes Customizable breakout periods Customizable 1-2-3 and 0-A-B ratios It impl
FREE
Where is price in the range - premium, discount or in the OTE zone? This indicator draws it, alerts you, and checks on your own chart what price did next. ICT Premium Discount OTE Honest Stats draws the current dealing range with premium, discount, equilibrium (50%) and the optimal trade entry zone (62-79%), alerts you when price reaches the OTE zone, and measures on that chart's own history how often price then went on with the leg, next to random candles. Free, part of the Honest Stats series.
FREE
RSI Extreme Zone
Alexander Chertnik
4.4 (5)
The indicator highlights the value in "over Sold" and "over Bought" zones. in addition, arrow indicates the return of the value from the extreme zone. Indicator can be easily customized by the user including change of colors, with, levels and arrows. Combination with other market signals and analysis is necessary and provides more stable results. Alert is also available for user.
FREE
FFx Fractals
Eric Venturi-Bloxs
4.5 (2)
The purpose of this new version of the MT4 standard indicator provided in your platform is to display in a sub-window multiple timeframes of the same indicator. See the example shown in the picture below. But the display isn’t like a simple MTF indicator. This is the real display of the indicator on its timeframe. Here's the options available in the FFx indicator: Select the timeframes to be displayed (M1 to Monthly) Define the width (number of bars) for each timeframe box Alert pop up/sound/ema
FREE
This indicator is a perfect tool able to compare which brokers have the lower latency. It shows us immediately which brokers are slower or faster. When you see the dot icon on the line, it means this broker is the faster one and the red line (Broker_A) is the slower one. See the example on the screenshot. How It Works? This indicator shares the prices information to and from the "shared" common data folder. It compares all the prices. The price is based on average by (Ask + Bid) / 2. There are
FREE
The   Liquidation Estimates (Real-Time)   experimental indicator attempts to highlight real-time long and short liquidations on all timeframes. Here with liquidations, we refer to the process of forcibly closing a trader's position in the market. By analyzing liquidation data, traders can gauge market sentiment, identify potential support and resistance levels, identify potential trend reversals, and make informed decisions about entry and exit points. USAGE (Img 1)    Liquidation refers
Shadow System Candles - AI Trend Visualization Concept "Stop trading in the dark. Equip your chart with Night Vision." Shadow System Candles is the visual core of the "Shadow Operation" project. It eliminates market noise and visualizes the true direction of the trend using AI-based logic (ADX + MA integration). Note: This tool does not generate buy/sell arrows. It is designed to train your eyes to recognize "Active Trends" and "Dangerous Ranges. Key Features ・AI Logic Coloring[/b]: Automat
FREE
Toby Strategy Indicator
Ahmd Sbhy Mhmd Ahmd ʿYshh
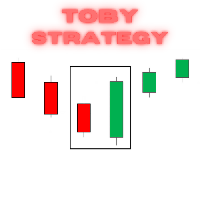
The indicator rely on The Toby strategy >> The mother candle which is bigger in range than the previous six candles. A vertical line shows the last Toby Candle with the targets shown up and down. The strategy is about the closing price out of the range of the toby candle to reach the 3 targets..The most probable to be hit is target1 so ensure reserving your profits and managing your stop lose.
FREE
Les acheteurs de ce produit ont également acheté
Trend SniperX MT4
Sarvarbek Abduvoxobov
5 (5)
Trend Sniper X est un indicateur de suivi de tendance multi-temporalité pour MetaTrader 5 qui aide les traders à identifier la direction de la tendance et les points de retournement potentiels avec clarté et précision. Pour MT5 : https://www.mql5.com/en/market/product/181101 Information sur le prix : Le prix actuel est une offre promotionnelle et peut évoluer au fur et à mesure de la sortie des prochaines mises à jour et nouvelles fonctionnalités. Canal Code2Profit Maîtrisez le marché grâce à l'
AW Prime Oscillator
AW Trading Software Limited
5 (1)
Une combinaison de deux oscillateurs. Le premier affiche les points d'entrée, le second montre la tendance actuelle. L'indicateur peut afficher les signaux d'oscillateur par des flèches dans deux modes, tous les signaux d'oscillateur rapides ou les signaux uniquement dans la direction de la tendance actuelle. Il dispose d'un panneau multi-périodes et de trois types de notifications de signal. Avantages: Convient au day trading et au scalping Filtrage des tendances Configuration simple et sensibl
Zoryk Gold mt4
Reda El Koutbane
5 (3)
ZORYK — Système avancé de signaux et de planification pour XAUUSD sur MetaTrader 4 Vous connaissez probablement cette situation. Vous analysez l’or, attendez l’entrée, puis ouvrez enfin la position. Le prix part immédiatement contre vous. Vous fermez trop tôt, déplacez le Stop Loss ou hésitez quelques secondes. Peu après, le marché atteint exactement la direction et l’objectif que vous aviez prévus, mais sans vous. Le problème n’était pas toujours la direction. Le véritable problème était l
Super Signal – Skyblade Edition Système de signaux de tendance professionnel sans repaint / sans latence, avec un taux de réussite exceptionnel | Pour MT4 / MT5 Il fonctionne mieux sur des unités de temps inférieures, comme 1 minute, 5 minutes et 15 minutes. Caractéristiques principales : Super Signal – Skyblade Edition est un système de signaux intelligent conçu spécifiquement pour le trading de tendance. Il utilise une logique de filtrage multicouche pour détecter uniquement les mouvements d
Atomic Analyst
Issam Kassas
5 (14)
Atomic Analyst — MetaTrader 4 Pour toute question sur le produit, sa configuration ou le support technique, envoyez-moi un message directement ici sur MQL5. L’indicateur transforme des calculs complexes du marché en signaux visuels simples, bougies colorées, lectures de tendance, niveaux de stop-loss et plusieurs zones de take-profit que les traders peuvent comprendre rapidement et utiliser dans des conditions réelles de marché. Principales utilisations de trading : Scalping et trading intraday
Smart Trend Trading System est un indicateur pour MetaTrader 4 qui réunit les informations de tendance, les signaux d’entrée et de sortie et les niveaux de prix sur un même graphique. Il combine plus de 10 outils de trading en un seul système, incluant la détection de tendance, les zones de retournement, Smart Cloud, la logique de trailing stop, le support et la résistance, la coloration des bougies, les alertes et l’analyse multi-timeframe. Le système est conçu pour vous aider à trader différen
Tokyo mt4 Indicator
Vasiliy Strukov
5 (9)
Le Tokyo Indicator offre une vue d'ensemble visuelle et claire de l'orientation de la tendance, des signaux de trading potentiels et des conditions du marché. Sa ligne de tendance en escalier, codée par couleur, distingue les phases haussières (en bleu) des phases baissières (en magenta). Des flèches directionnelles associées mettent en évidence les opportunités d'achat et de vente potentielles lors des changements de tendance. Un tableau de bord intégré regroupe le signal actuel, l'orientation
Liquidity Scalper System : un système de trading basé sur la liquidité au format indicateur. La plupart des indicateurs n'affichent qu'une flèche, puis le trader décide seul où placer le stop, où se trouve l'objectif et s'il peut faire confiance au signal. Liquidity Scalper System couvre tout le cycle du trade : il trouve les pools de liquidité, donne un signal lors de leur cassure, calcule immédiatement Entry, Stop Loss et trois objectifs, et affiche sur le panneau les statistiques et les résu
Actuellement 30% de réduction ! La meilleure solution pour tout débutant ou trader expert ! Ce logiciel de tableau de bord fonctionne sur 28 paires de devises. Il est basé sur 2 de nos principaux indicateurs (Advanced Currency Strength 28 et Advanced Currency Impulse). Il donne un excellent aperçu de l'ensemble du marché Forex. Il montre les valeurs de l'Advanced Currency Strength, la vitesse de mouvement des devises et les signaux pour 28 paires de devises dans tous les (9) délais. Imaginez
SR Liquidity
Oleg Rodin
5 (2)
SR Liquidity est un indicateur de trading conçu pour révéler les zones cachées où se concentre la liquidité du marché et où le prix réagit avec le plus d'intensité. Ces zones de liquidité spécifiques agissent comme de puissants niveaux de support et de résistance, vous offrant une cartographie claire des points où le marché est le plus susceptible de se retourner. Plutôt que de tracer des lignes de support et de résistance classiques, l'indicateur SR Liquidity analyse le comportement réel des pr
M1 Sniper
Oleg Rodin
4.97 (30)
M1 SNIPER est un système d'indicateurs de trading facile à utiliser. Il s'agit d'un indicateur à flèche conçu pour l'unité de temps M1. Cet indicateur peut être utilisé seul pour le scalping sur l'unité de temps M1 ou intégré à votre système de trading existant. Bien que conçu spécifiquement pour le trading sur l'unité de temps M1, ce système peut également être utilisé avec d'autres unités de temps. Initialement, j'avais conçu cette méthode pour le trading du XAUUSD et du BTCUSD. Cependant, je
Top Bottom Tracker est un indicateur basé sur des algorithmes sophistiqués qui analyse la tendance du marché et peut détecter les hauts et les bas de la tendance / Version MT5 . Le prix augmentera progressivement jusqu'à ce qu'il atteigne 500$. Prochain prix --> 99$ Caractéristiques Pas de repeinture Cet indicateur ne change pas ses valeurs lorsque de nouvelles données arrivent Paires de trading Toutes les paires de devises Période de temps Toutes les périodes de temps Paramètres de
KT Parabolic RSI MT4
KEENBASE SOFTWARE SOLUTIONS
KT Parabolic RSI overlays Parabolic SAR directly on the RSI line to highlight likely market turning points. Classic RSI overbought and oversold readings already hint at reversals, and the added PSAR filter removes much of the noise and sharpens those signals, giving you clearer trade setups. Big Square Signals: A Parabolic SAR flip on an RSI that sits in overbought or oversold territory. These mark high-probability market turns. Small Square Signals: A SAR flip inside the neutral RSI band. Treat
Advanced Supply Demand
Bernhard Schweigert
4.91 (302)
Offre spéciale : 30 % de réduction La solution idéale pour les traders débutants comme experts ! Cet indicateur est un outil de trading unique, performant et abordable grâce à l’intégration de nombreuses fonctionnalités exclusives et d’une nouvelle formule. Cette mise à jour vous permet d’afficher des zones sur deux unités de temps. Vous pourrez ainsi visualiser non seulement une unité de temps supérieure, mais aussi l’unité de temps du graphique, ainsi que l’unité de temps supérieure : des z
This is a professional chart indicator designed for traders focused on stability and clear price action. It helps filter market noise and provides clear visual entry and exit zones for your trading decisions. Core Features: Strictly Non-Repainting: The system is built with strict non-repaint logic. What you see on the chart is the true historical performance. Confirmed Signals: Signals are triggered and confirmed only after the candle closes . Once a trading arrow appears on a closed candle, it
Le système PRO Renko est un système de trading très précis spécialement conçu pour le trading de graphiques RENKO. Il s'agit d'un système universel qui peut être appliqué à divers instruments de négociation. Le système neutralise efficacement ce qu'on appelle le bruit du marché en vous donnant accès à des signaux d'inversion précis. L'indicateur est très facile à utiliser et n'a qu'un seul paramètre responsable de la génération du signal. Vous pouvez facilement adapter l'outil à n'importe que
Currency Strength Wizard est un indicateur très puissant qui vous offre une solution tout-en-un pour un trading réussi. L'indicateur calcule la puissance de telle ou telle paire de devises en utilisant les données de toutes les devises sur plusieurs périodes. Ces données sont représentées sous la forme d'un indice de devise facile à utiliser et de lignes électriques de devise que vous pouvez utiliser pour voir la puissance de telle ou telle devise. Tout ce dont vous avez besoin est d'attacher l'
Cycles Predictor Indicator This indicator uses past market cycles to predict future price movements. The indicator scans through past data and considers  combinations  of cycles. When cycles  coincide  at the same future date/time then it is considered a valid future prediction. The predictions are drawn as vertical lines on the right side of the chart in the future. A prediction will often result in type of candle (ex. bull or bear) and/or a reversal point (ex. bottom or top) forming at this ex
CRT Candle Range Theory HTF MT4 - Ultimate CRT Indicator : Concepts ICT avancés et système de trading Malaysian SnR Maîtrisez les traces des Market Makers avec l'indicateur Candle Range Theory le plus avancé. Libérez la véritable puissance des Smart Money Concepts (SMC) et tradez avec la même précision que les institutions grâce à l'Ultimate CRT Indicator. Conçu exclusivement pour les traders sérieux, cet indicateur automatiza la théorie CRT, un pilier central des concepts ICT (Inner Circle Trad
CRT Multi-Timeframe Market Structure & Liquidity Sweep Indicator Non-Repainting | Multi-Asset | MT5 Version Available MT5 Version:   https://www.mql5.com/en/market/product/162075 Full User Guide — explains what each feature does and why:   https://www.mql5.com/en/blogs/post/767525 Quick Start User Guide  — explains how to configure and in what order:  https://www.mql5.com/en/blogs/post/767540 Indicator Overview CRT Ghost Candle HTF Fractal is a complete institutional-grade market structure too
Day Trader Master est un système de trading complet pour les day traders. Le système se compose de deux indicateurs. Un indicateur est un signal fléché pour acheter et vendre. C'est l'indicateur de flèche que vous obtenez. Je vous fournirai le deuxième indicateur gratuitement. Le deuxième indicateur est un indicateur de tendance spécialement conçu pour être utilisé conjointement avec ces flèches. LES INDICATEURS NE RÉPÉTENT PAS ET NE TARDENT PAS! L'utilisation de ce système est très simple. Il v
Pips Generator
Oleg Rodin
4.6 (10)
Apollo Pips Generator est l'indicateur qui fournit des signaux dans le sens de la tendance. L'indicateur fournit plusieurs points d'entrée afin que vous puissiez toujours trouver une opportunité de trading pour en tirer profit. Faites attention aux captures d'écran. Les captures d'écran montrent l'outil Pips Generator en combinaison avec mon autre outil qui est représenté par le canal avec des signaux en étoile qui indiquent les hauts et les bas. Cette combinaison vous offre plusieurs façons d'a
ACTUELLEMENT 40% DE RÉDUCTION La meilleure solution pour tout débutant ou trader expert ! Cet indicateur est un outil de trading unique, de haute qualité et abordable car nous avons incorporé un certain nombre de caractéristiques exclusives et une nouvelle formule. Avec seulement UN graphique, vous pouvez lire la force de la devise pour 28 paires Forex ! Imaginez comment votre trading va s'améliorer parce que vous êtes capable de repérer le point de déclenchement exact d'une nouvelle tendance
Introducing Volume Orderflow Profile , a versatile tool designed to help traders visualize and understand the dynamics of buying and selling pressure within a specified lookback period. Perfect for those looking to gain deeper insights into volume-based market behavior! MT5 Version -  https://www.mql5.com/en/market/product/122657 The indicator gathers data on high and low prices, along with buy and sell volumes, over a user-defined period. It calculates the maximum and minimum prices during this
Une flèche vous dit d'acheter. Obsidian Scalper Pro vous dit où acheter, où se place le stop, où sont les trois objectifs, quelle taille la position doit avoir pour votre risque, et ce que vaut le setup sur 100. Chaque signal arrive comme un plan de trade terminé et tracé sur le graphique, et une fenêtre de statistiques intégrée montre le résultat honnête des cent derniers, taux de réussite avec intervalle de confiance compris. Chaque décision est prise sur une bougie clôturée, donc l'historique
Signal GoldRush Trend Arrow L'indicateur GoldRush Trend Arrow Signal fournit une analyse précise et en temps réel des tendances, spécialement conçue pour les scalpers à haute vitesse et à court terme sur la paire XAU/USD. Conçu spécialement pour les intervalles de temps d'une minute, cet outil affiche des flèches directionnelles indiquant clairement les points d'entrée, ce qui permet aux scalpers de naviguer en toute confiance dans des conditions de marché volatiles. L'indicateur se compose
UR TrendExhaustion
Krzysztof Jan Debski
UR TrendÉpuisement   UR TrendExhaustion est la meilleure solution pour les traders qui ne veulent pas gérer les valeurs des paramètres ni d'autres configurations - c'est à la fois facile et visuellement compréhensible pour tout le monde. Avantages d'utiliser UR TrendExhaustion : Aucun paramètre Vous avez 3 lignes qui décrivent le mieux ce qui se passe sur le graphique : la ligne d'épuisement de la tendance, la ligne de l'argent de la baleine et la ligne de l'argent au détail. L'interface pré
Alright. This indicator works on MT4 and is very easy to use. When you receive a signal from it, you wait for that candle with the signal to close and you enter your trade at the beginning of the next new candle. A red arrow means sell and a green arrow means buy. All arrows comes with a long dotted like for easy identification of trade signal. Are you okay with that?   100% non repaint Work All Major currency  Pair,  1 minute time frame 1 minute expire
This indicator works on MT4 and is very easy to use. When you receive a signal from it, you wait for that candle with the signal to close and you enter your trade at the beginning of the next new candle . A red arrow means sell and a green arrow means buy. All arrows comes with Alert  like for easy identification of trade signal. Are you okay with that? 1 minute candle 1 minute expire
Neuro Poseidon MT4
Daria Rezueva
4.74 (46)
Neuro Poseidon is a new indicator by Daria Rezueva. It combines precise trading signals with adaptive TP/SL levels - creating best possible trades as a result! Message me and get  Neuro Poseidon Assistant  as a gift to automize your trading process! What makes it stand out? 1. Proven profitability on all assets and timeframes 2. Only confirmed BUY and SELL signals present on the chart 3. Adaptive TP & SL levels generated by the software for each trade 4. Easy to understand - suitable for all
Plus de l'auteur
Stoch RSI Alerts MT5
Marco Engstermann
5 (3)
Stochastic RSI with Candle Patterns This indicator is based on the Stochastic oscillator applied to the Relative Strength Index (RSI). It is designed to help traders visually identify the main long-term trend while generating entry signals in overbought and oversold zones. Support and questions via MQL5 product comments. Added in Version 1.3 Candle Patterns. A B C , Engulfing, Hammer, ShootingStar, Doji' A B C Pattern Multi Timeframe Alert, Alert on Candle Patterns. Version 1.4:  New input: The
FREE
ForeCastX AI
Marco Engstermann
ForeCastX AI est un indicateur graphique pour MetaTrader 5. Il affiche une coloration de tendance selon les swings, des flèches d’achat et de vente, des zones d’offre et de demande, un panneau de force acheteur/vendeur sur plusieurs unités de temps, et un tracé optionnel. Ce tracé est un schéma visuel basé sur la structure récente et le panneau. Ce n’est pas une prévision de prix ni un signal de trading à lui seul. Sur le graphique Bougies colorées selon la tendance de swing en cours Flèches lor
Multi Timeframe Buy and Sell Power The "Multi Timeframe Buy and Sell Power" indicator for MetaTrader 5 is a versatile tool designed to provide traders with a clear visual representation of market pressure across nine standard timeframes, from M1 to MN1. By aggregating buy and sell strength percentages derived from recent price action and tick volume, it helps identify potential trends, reversals, and neutral market conditions in real-time. The indicator displays this information in a compact da
FREE
Buy and Sell ATR
Marco Engstermann
4 (3)
Buy and Sell ATR Indicator updated version 1.2 (2026) ATR-based trend indicator with visual signals, dynamic support/resistance, and TP/SL levels. This indicator identifies market trends using an ATR channel and displays clear Buy and Sell signals.  It draws a dynamic trend line that changes color (green for uptrend, red for downtrend), shows arrows for entries, and plots the latest Take Profit and Stop Loss levels directly on the chart. Detailed Description in the comments post 2. Set files in
FREE
UT Bot with Alerts
Marco Engstermann
4 (1)
UT Bot with Alerts The UT Bot Alerts Indicator for MetaTrader 5 is a versatile trading tool that generates buy and sell signals based on ATR-based trailing stop logic. It displays signals with arrows, draws an entry price line, and includes a candle countdown timer. The indicator offers customizable alerts (pop-up, email, push notifications) and a text label showing signal details. Users can adjust ATR sensitivity, label positions, and timer settings, making it suitable for various markets and
FREE
Buy and Sell Power
Marco Engstermann
4.6 (5)
Simple Indicator that shows the Buy and Sell volume in percent. The Buy and Sell Power indicator for MetaTrader 5 calculates and displays estimated buy/sell volume percentages over a user-defined period (default: 14 bars) using tick volume data. It overlays text labels on the chart showing Buy % (with "Up" if >51%), Sell % (with "Dn" if >51%), and a trend signal based on thresholds: Neutral (<55%), Trend: Buy/Sell (55%+), Trend: Strong Buy/Sell (62%+), Trend Max UP/Down (65%+), or Trend change s
FREE
Multi-Symbol Trend Indicator for MT5 The "Multi-Symbol Trend Indicator" for MT5is a customizable dashboard tool that monitors trends across multiple symbols (e.g., XAUUSD, EURUSD) using MACD, ADX, and RSI for direction, strength, and confirmation. It classifies trends as bullish, bearish, or sideways, draws colored trend lines on the chart, displays daily high/low with Fibonacci retracements, detects points of interest (POIs) via swing highs/lows, and sends alerts/notifications for changes or
FREE
MACD Custom Indicator CM
Marco Engstermann
4 (1)
CM MACD Custom Indicator - Multiple Time Frame (V2.1) This advanced MT5 indicator, adapted from ChrisMoody’s TradingView script, delivers a powerful Multi-Timeframe MACD with customizable visuals and alerts. Plotting MACD lines, signal line, and a color-coded histogram, it highlights trend direction and momentum with distinct colors for growing/falling histograms above/below zero. Cross signals are marked with arrows, and users can enable alerts, email, or mobile notifications for buy/sell oppo
FREE
Vector Candles Indicator
Marco Engstermann
5 (2)
Vector Candles Indicator Vector Candles Indicator is a powerful MT5 tool designed for traders seeking advanced volume analysis and trend insights. It colors candles based on tick or real volume to highlight climax (exhaustion) and super climax (extreme spike) patterns, signaling potential reversals or continuations. Integrated features include 9 customizable EMAs (5-800 periods), Point of Control (POC) from volume profiles, daily pivot levels with midpoints, current day open/high/low lines, arro
FREE
IFibonacci MT5
Marco Engstermann
Fibonacci MT5 Converted from MT4, Optimized MT5 Version. original MT4 code by Awran5. Non-Repainting Fibonacci Tool for MT5. Fibonacci indicator with a stable non-repainting swing detection engine. Support and questions via MQL5 product comments. For questions, updates, and to connect with other traders, join my official   MQL5 group ForexEAandMore Main Functions Custom Swing Detection Uses proprietary Reverse-Scan plus Peak-Climbing algorithm to find reliable swing highs and lows without repai
FREE
Apex Point
Marco Engstermann
Apex Point is a trend-following indicator for MetaTrader 5, transforming complex market data into signals for traders. It displays blue dots for uptrends, red dots for downtrends, and yellow crosses at potential reversals, helping users identify momentum shifts quickly. Key features include a confirmation system requiring multiple bars (default: 3) to validate changes, reducing false signals; dynamic ATR-based offsets for adaptive trailing, with instant ratcheting in the trend direction and smo
FREE
Buy and Sell Power MT4
Marco Engstermann
5 (2)
Simple Indicator that shows the   Buy and Sell   volume in percent. Support and questions via MQL5 product comments. For questions, updates, and to connect with other traders, join my official   MQL5 group ForexEAandMore Settings : Font size for percentage labels Horizontal offset from right edge (pixels) Vertical offset for Signal label from bottom (pixels) Vertical offset for Buy label from bottom (pixels) Vertical offset for Sell label from bottom (pixels) Color for Buy label Color for Sell
FREE
Dual Symbol Bars trace un second symbole en bougies dans sa propre sous-fenêtre, sur la même unité de temps et le même axe temporel que le graphique. Affiche n'importe quel second symbole en bougies dans une fenêtre séparée, alignées sur l'heure du graphique. Utile pour l'or à côté de l'indice du dollar, ou toute autre paire proposée par le courtier. Dual Symbol Bars ajoute un second graphique en bougies sous le graphique principal. Les deux fenêtres utilisent la même unité de temps et la même h
FREE
Dead Candle Theory – DCT – Signal Scanner Scanner multi-timeframes pour les signaux Dead Candle Theory (DCT), les order blocks, le SuperTrend et les filtres de confluence. Qu’est-ce que la Dead Candle Theory (DCT) ? La DCT marque une dead candle comme la bougie la plus extrême d’un swing — le plus bas bas (origine d’achat) ou le plus haut haut (origine de vente). Cette bougie n’est considérée comme « morte » que lorsqu’un corps d’une bougie ultérieure casse son niveau extérieur. En mode Close,
Apex MTF Panel A clean, standalone multi-timeframe RSI/MACD dashboard that instantly shows buy, sell, or neutral confluence signals across your chosen timeframes in a compact horizontal layout. TF names sit directly above signals with matching colors for instant readability. Fully customizable signal colors, live font-size adjustment, corner positioning, and smart “loading” state ensure performance on any chart. Support and questions via MQL5 product comments. For questions, updates, and to conn
FREE
Trade Hunter Indicator
Marco Engstermann
4 (4)
Trade Hunter MT5 - Buy and Sell Indicator This powerful indicator identifies potential buy and sell signals by analyzing price movements over a customizable period. Blue arrows mark buy opportunities below key lows, while red arrows highlight sell signals above critical highs. With adjustable parameters like bar range, percentage offset, and alert settings, Trade Hunter adapts to your strategy. Optional alerts and notifications ensure you never miss a signal. Perfect for traders seeking a reli
FREE
Buffer Finder MT5 Is a custom technical Utility for MetaTrader 5, designed to inspect and analyze buffers of other indicators for EA integration, signal detection, or debugging. Support and questions via MQL5 product comments. For questions, updates, and to connect with other traders, join my official   MQL5 group ForexEAandMore Major update in Version 1.2 All update Infos in the first comment. You can check now the indicator directly without loading in the chart by filling the exact indicator
FREE
Tick History Check Panneau tableau de bord qui interroge l’historique des ticks du courtier jour par jour, affiche le nombre de ticks, les heures du premier et du dernier tick ainsi que la variation par rapport à une base sauvegardée. Il signale une possible réinitialisation des ticks par le courtier et tient un journal d’événements. L’indicateur vérifie jusqu’à 30 jours serveur (aujourd’hui inclus). Pour chaque jour ouvrable les ticks sont demandés via CopyTicksRange et comparés au plus haut n
FREE
Show Label
Marco Engstermann
4.5 (2)
Show Label Show your profit or loss next to the candle. This is a helpful tool if an EA don't have this feature build in. Support and questions via MQL5 product comments. For questions, updates, and to connect with other traders, join my official   MQL5 group ForexEAandMore Settings: Font color Background color for profits Background color for losses Font size Horizontal shift from candle (pixels) Vertical shift from candle high/low (pixels) Magic number filter (0 = all trades) Comment filter
FREE
Multi Timeframe Buy and Sell Power Pro MT5 The "Multi Timeframe Buy and Sell Power Pro" indicator for MetaTrader 5 is a versatile tool designed to provide traders with a clear visual representation of market pressure across nine standard timeframes, from M1 to MN1. By aggregating buy and sell strength percentages derived from recent price action and tick volume, it helps identify potential trends, reversals, and neutral market conditions in real-time. The indicator displays this information in a
This is the MT5 converted Version of the The MA Filling Indicator, developed by Scriptong, is an advanced technical analysis tool designed for MetaTrader 4 (MT4) that enhances the traditional Moving Average (MA) indicator by incorporating a visually intuitive filling feature. The MA Filling Indicator is a versatile tool suitable for both novice and experienced traders seeking to enhance their trend-following strategies with a clear, color-coded representation of market dynamics. Support and ques
FREE
Support Resistance Channel MT5 The Support Resistance Channel MT5 indicator plots dynamic support and resistance levels based on a configurable lookback period, displaying them as green and red lines respectively. It optionally shows goldenrod-colored arrows when price touches these levels, indicating potential trend changes (not explicit buy/sell signals) , along with customizable "RES" and "SUP" labels. With adjustable parameters like lookback period, arrow size, and label offset, it offers t
FREE
Trend Dot Indicator A fast-reacting Trend Step Regression (TSR) line with color-coded dots instantly shows the current trend. Buy and sell signals appear only when a real reversal occurs, confirmed by minimum trend length and ADX strength. Visit my MQL5 blog profile to read the full guide. Support and questions via MQL5 product comments. For questions, updates, and to connect with other traders, join my official   MQL5 group ForexEAandMore Features: Clear visual TSR line + dots (blue = up, red
Midas Gold Weaver EA MT4 est un Expert Advisor de tendance multi-timeframes pour l’or, avec des entrées par couches, un filtre d’actualités et des outils de protection du compte. Description complète Midas Gold Weaver EA est un Expert Advisor pour MetaTrader 5. Il est conçu pour les symboles or tels que XAUUSD. Le programme combine une vérification de tendance sur plusieurs unités de temps avec des entrées supplémentaires optionnelles à une distance croissante de la première position. La premi
Arrow Master est un indicateur MetaTrader 4 dans la fenêtre du graphique. Il indique la direction de la tendance par un ruban couleur à trois couches et, en option, par des flèches d’achat et de vente. Le ruban suit une logique de retournement de type HalfTrend : moyennes mobiles des plus hauts et plus bas sur la période Arrow Pulse, plus un tampon Arrow Shield en unités de prix. Lorsque la condition est remplie, la couleur change et une flèche peut être tracée. La même logique s’applique au tim
Trend Dot Indicator MT5 A fast-reacting Trend Step Regression (TSR) line with color-coded dots instantly shows the current trend. Buy and Sellsignals appear only when a real reversal occurs, confirmed by minimum trend length and ADX strength. Visit my MQL5 blog profile to read the full guide. Support and questions via MQL5 product comments. For questions, updates, and to connect with other traders, join my official   MQL5 group ForexEAandMore Features: Clear visual TSR line  Filtered reversal
Occult Oracle MT5 est un indicateur de tendance pour la fenêtre de graphique de MetaTrader 5. Il trace une ligne de tendance bicolore et, en option, des flèches d’achat et de vente lorsque la couleur de la ligne change. La ligne est calculée à partir d’une moyenne mobile simple des prix High et Low et d’une fenêtre glissante de plus haut / plus bas. La longueur de cette fenêtre s’appelle Amplitude. Elle peut être définie manuellement pour chaque période (M1 à MN1) ou choisie automatiquement par
Pro Panel MT5
Marco Engstermann
Pro Panel The Pro Panel EA is a user-friendly, draggable graphical interface for MetaTrader 5, designed to streamline trading operations. It features editable fields for lot size, take profit (TP) and stop loss (SL) in points, and trailing stop parameters (start and step). Key buttons allow quick opening of buy or sell positions, as well as closing all buys or sells, with options to filter by the EA's magic number or include manual trades (e.g., from the MT5 mobile app). Toggles enable/disable
AuraX Gold MT5
Marco Engstermann
AuraX Gold MT5 Technical indicator for MetaTrader 5 that plots SuperTrend support and resistance lines, generates buy and sell signals with ATR-based levels, applies higher timeframe, CCI, ADX and cooldown filters, displays economic news events, and includes an information dashboard. For questions, updates, and to connect with other traders, join my official   MQL5 group ForexEAandMore AuraX Gold MT5 is a technical indicator for MetaTrader 5. It plots SuperTrend-based support and resistance l
Midas Gold Weaver EA MT5 est un Expert Advisor de tendance multi-timeframes pour l’or, avec des entrées par couches, un filtre d’actualités et des outils de protection du compte. Description complète Midas Gold Weaver EA est un Expert Advisor pour MetaTrader 5. Il est conçu pour les symboles or tels que XAUUSD. Le programme combine une vérification de tendance sur plusieurs unités de temps avec des entrées supplémentaires optionnelles à une distance croissante de la première position. La premi
Filtrer:
Gerd
49
Gerd 2026.10.25 08:00 

Sehr hilfreicher Indikator.

Hector Manuel
456
Hector Manuel 2025.12.15 19:45 

No es claro como calcula los valores. ¿Podrías dar un ejemplo?

Marco, gracias por la explicación.

Marco Engstermann
21935
Réponse du développeur Marco Engstermann 2025.12.16 13:41
Simple Explanation of the Calculation
The indicator measures "buy pressure" as a percentage for each timeframe (like M1, H1, etc.) by looking at the last 14 candles (bars) by default. Basically, it analyzes whether recent candles show more upward (buy) or downward (sell) movement, weighted by volume (how much was traded) and the "strength" of each candle.
Think of each candle as a "battle" between buyers and sellers: If the candle closes higher than it opens, it's bullish (buy strength).
If it closes lower, it's bearish (sell strength).
It's ignored if neutral (opens and closes the same). The calculation adds up the bullish and bearish strength, and sees what percentage is bullish. The sell percentage is just 100% minus the buy percentage.
Basic steps for each timeframe: Look at the last 14 completed candles.
For each candle:
Calculate the "body size" (difference between close and open, absolute value).
Calculate the "total range" (high minus low). If it's very small, adjust it to a minimum to avoid exaggeration.
"Strength" = body size divided by range (a number between 0 and 1; 1 is a strong candle, 0 is indecisive).
Direction: +1 if bullish, -1 if bearish, 0 if neutral.
Pressure = volume × strength × direction (volume minimum 1 if zero). Add up the positive pressures (bullish) and negative ones (bearish, but as positive magnitudes).
Buy percentage = (bullish strength / total strength) × 100.
If there's not enough data or everything is neutral, it sets 50% (balanced). Finally, the "Main Trend" is the average of the buy percentages from all enabled timeframes.
Simple Example
Imagine we're on a EUR/USD chart, with 3 recent candles (instead of 14 to keep it simple). Assume the minimum "point" is 0.00005. Candle 1 (most recent): Opens at 1.1000, Closes at 1.1010, High 1.1015, Low 1.0995, Volume 1000.
Body: |1.1010 - 1.1000| = 0.0010.
Range: 1.1015 - 1.0995 = 0.0020 (bigger than 0.00005, ok).
Strength: 0.0010 / 0.0020 = 0.5.
Direction: +1 (closes higher).
Pressure: 1000 × 0.5 × +1 = +500 (bullish). Candle 2: Opens at 1.1010, Closes at 1.0990, High 1.1015, Low 1.0985, Volume 800.
Body: |1.0990 - 1.1010| = 0.0020.
Range: 1.1015 - 1.0985 = 0.0030.
Strength: 0.0020 / 0.0030 ≈ 0.67.
Direction: -1 (closes lower).
Pressure: 800 × 0.67 × -1 ≈ -536 (bearish). Candle 3: Opens at 1.1005, Closes at 1.1005, High 1.1010, Low 1.1000, Volume 500.
Body: 0 (neutral).
Strength: 0.
Direction: 0.
Pressure: 0 (doesn't count). Now add up: Bullish strength: 500.
Bearish strength: 536 (the absolute value of the negative pressure).
Total: 500 + 536 = 1036.
Buy percentage: (500 / 1036) × 100 ≈ 48%.
Sell percentage: 52%. In the indicator, this would show "Buy = 48.0%" and "Sell = 52.0% Dn" (adds "Up" or "Dn" if over 51%). If it's >=55%, it says "Buy" or "Sell", and higher "Strong Buy", etc. Next time you can ask me in the comment function. Regards Marco
Répondre à l'avis