Triangle Wedge
- Indicadores
- Versión: 1.2
- Activaciones: 5

Estrategia para operar la ruptura de una cuña triangular
Esta es una estrategia simple y muy efectiva
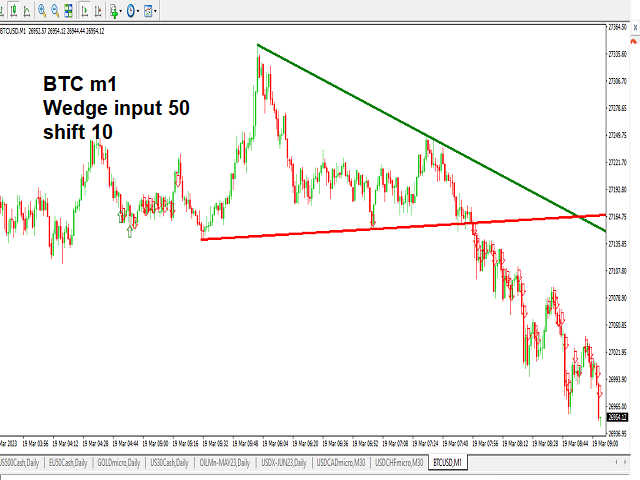
basada en detectar y mostrar la formación de cuñas triangulares
Estrategia configurada para operar la ruptura de una cuña triangular
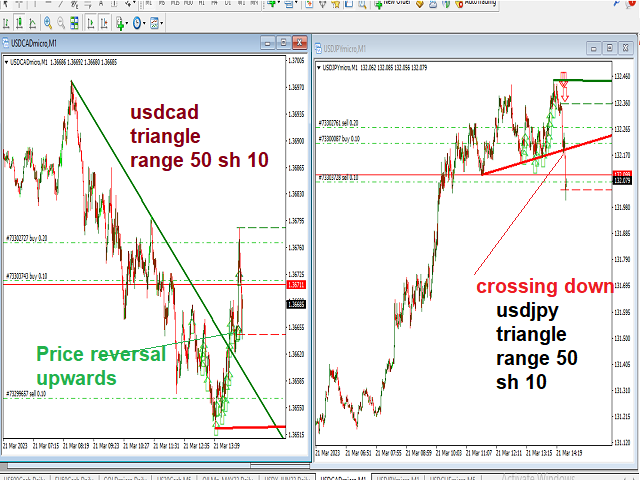
Las flechas rojas aparecen al cruzar el triángulo hacia abajo
Las flechas verdes aparecen al cruzar el triángulo hacia arriba
También puede operar con el límite inferior y superior del triángulo :(una nueva versión puede ser lanzada para permitir flechas para operar de forma lateral)
---Vender si el precio baja desde el nivel superior del triángulo - Comprar si sube desde el nivel inferior del triángulo
Se utilizan 2 parámetros de entrada
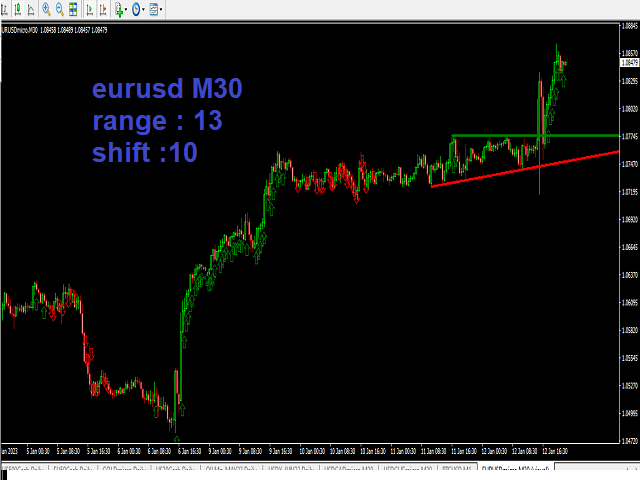
1- Rango: para determinar la amplitud del triángulo: los marcos de tiempo pequeños necesitan un rango alto de 30 o 50 o superior.
Los marcos de tiempo altos necesitan un rango bajo de 25 o inferior.
2- Desplazamiento: se establece en un valor superior a 5
indicadores funciona en cualquier timeframes