Bear Bull Wave MT4
- Indicadores
- Versión: 4.6
- Actualizado: 18 noviembre 2021
- Activaciones: 5

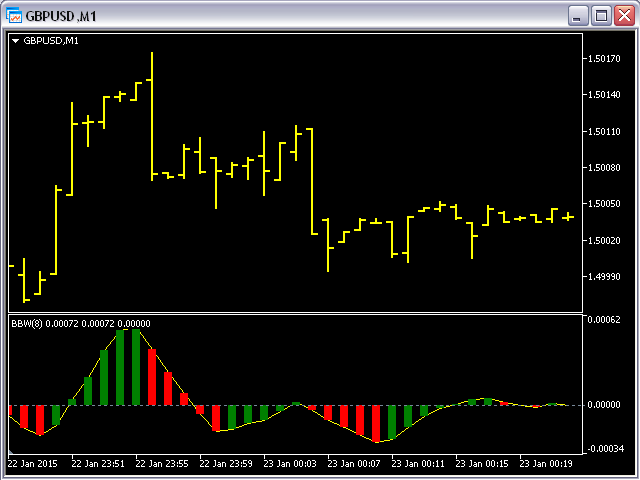
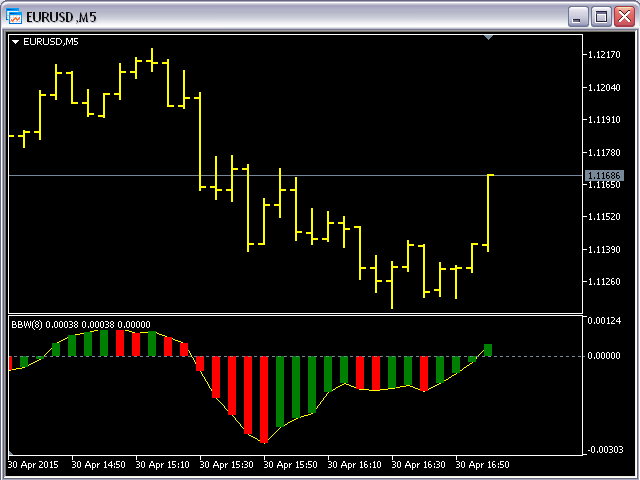
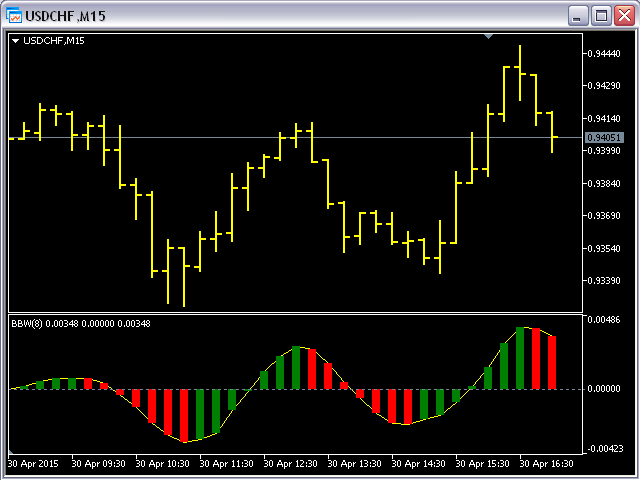
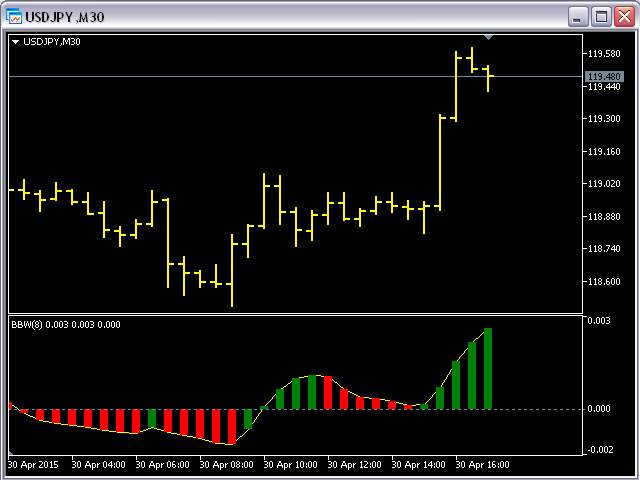
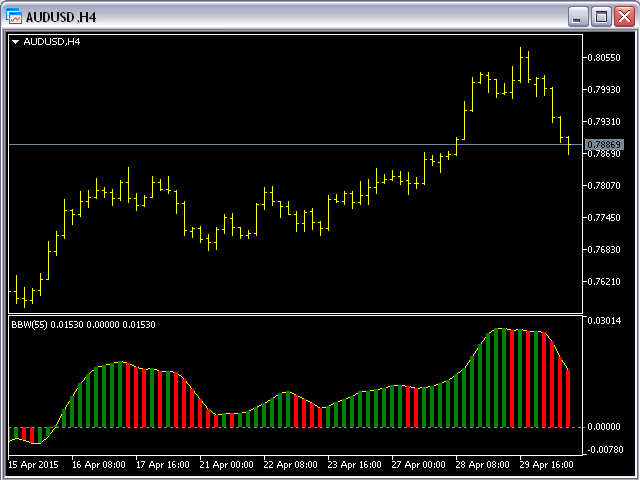
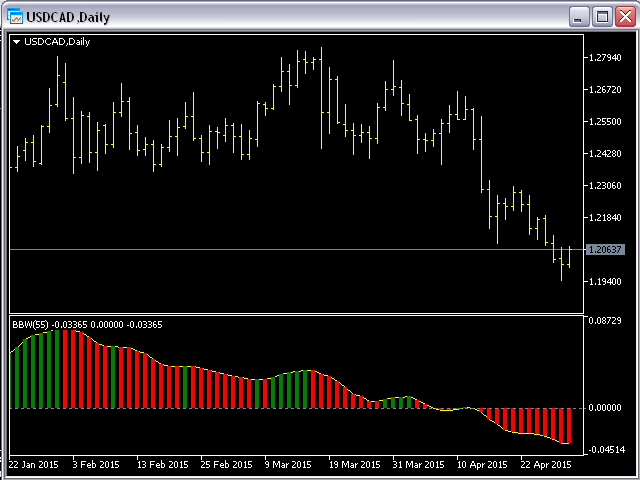
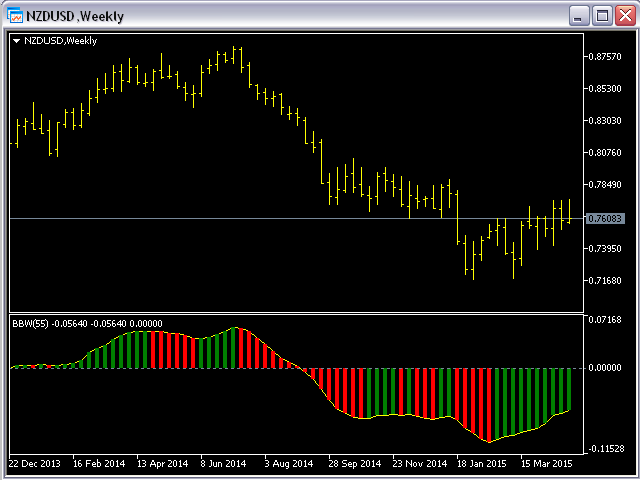
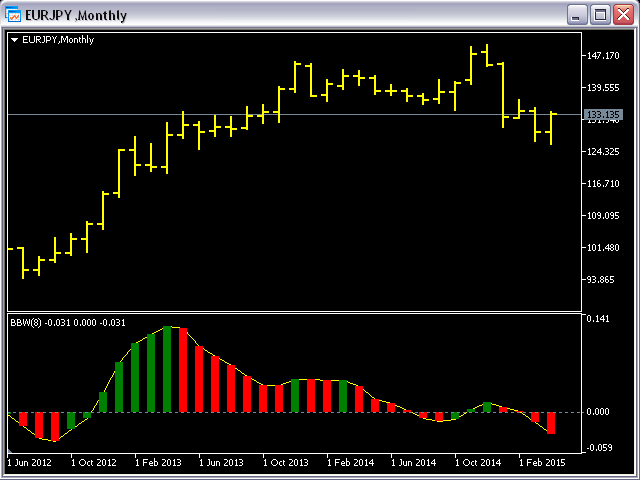
Este indicador funciona en todos los pares de divisas y marcos de tiempo (TF).
Un parámetro de entrada: nPeriod - número de barras para el cálculo del histograma.
Recomiendo optimizar el valor de nPeriod para cada TF.
Si los polos verdes del histograma cruzan la línea cero desde abajo, entonces se puede abrir una posición larga.
Si los polos rojos del histograma cruzan la línea cero desde arriba, entonces se puede abrir una posición larga.