Trigger Bands MT5
- Indicadores
- Versión: 4.7
- Actualizado: 18 noviembre 2021
- Activaciones: 5

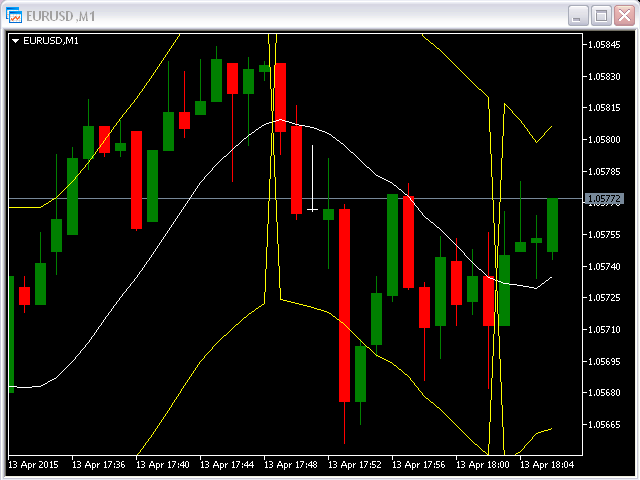
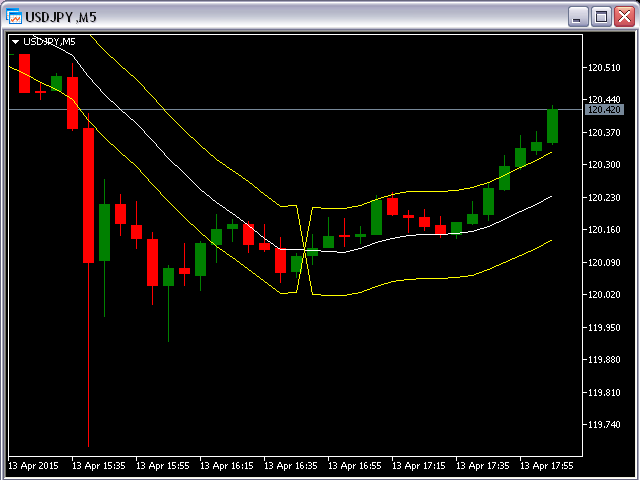
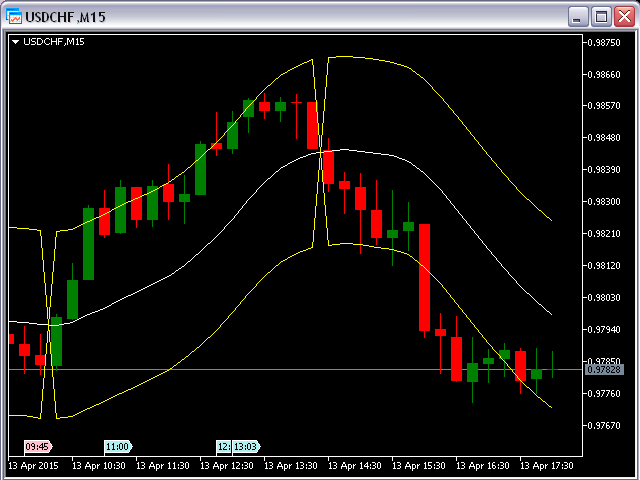
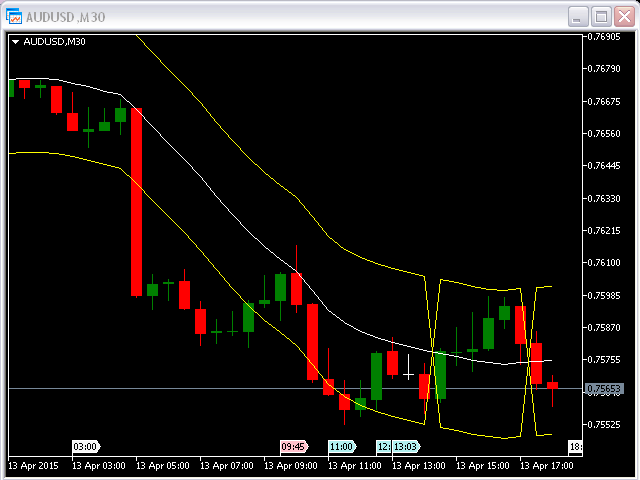
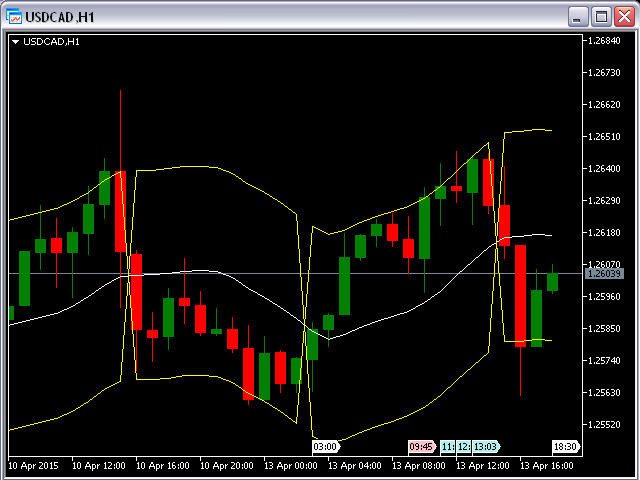
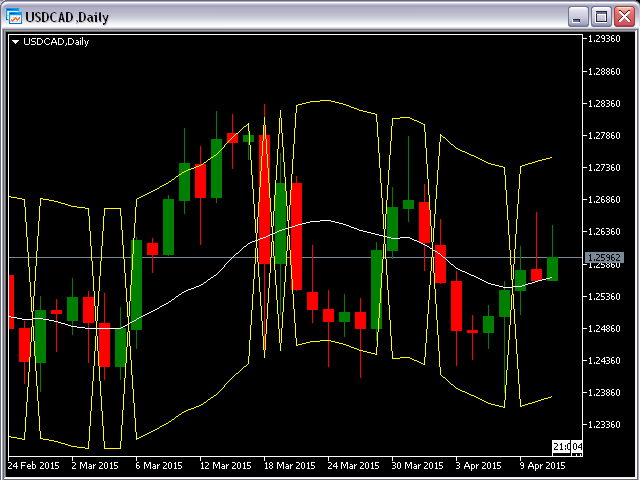
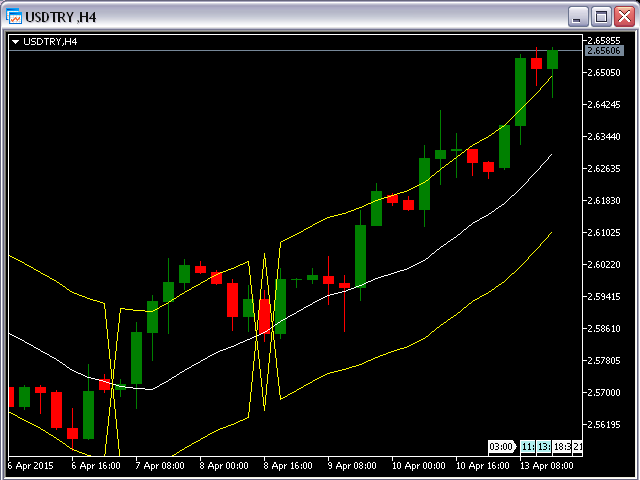
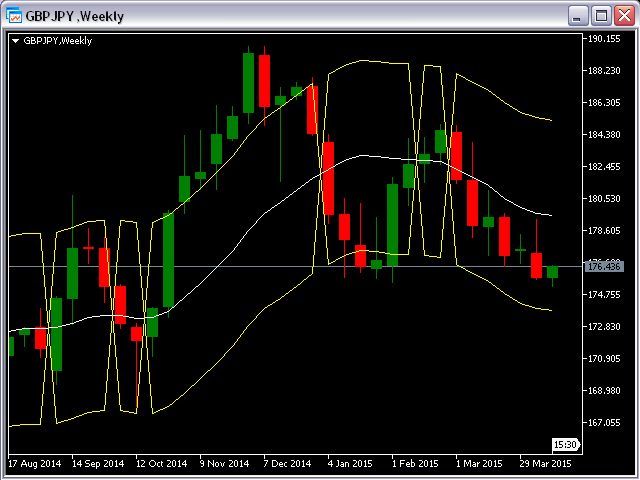
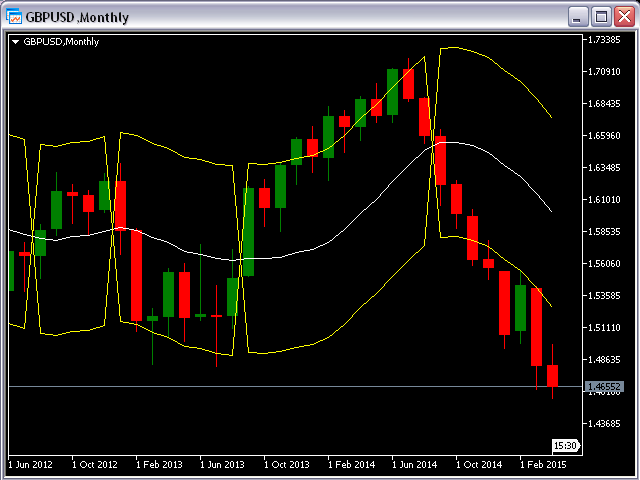
Este indicador muestra bandas (corredor flexible) para un movimiento de precios actual y el cambio de tendencia. El indicador puede utilizarse en cualquier marco temporal y par de divisas.
Los siguientes parámetros de entrada se pueden cambiar fácilmente para sus necesidades:
- nPeriod = 13; - número de barras que el indicador utilizará para el cálculo
- Deviation = 1.618; - coeficiente para la distancia de las bandas de la línea media
- MaShift = 0; - desplazamiento desde la barra actual