Color Stochastic with an analytical panel
- Indicadores
- Versión: 1.20
- Activaciones: 5

La principal ventaja de este indicador es el filtrado de las señales de compra y venta en la dirección del impulso del mercado y su clasificación por fuerza. La configuración del indicador es sencilla e intuitiva. Todo lo que necesita hacer es reaccionar sólo a las señales fuertes. Respete las reglas de gestión monetaria.
Descripción
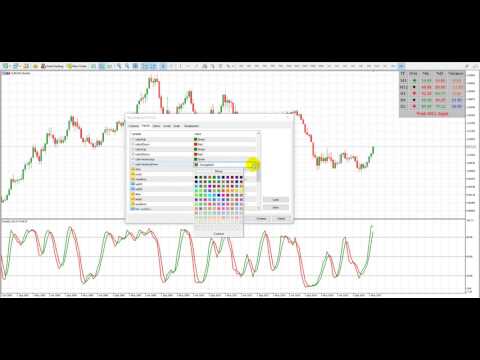
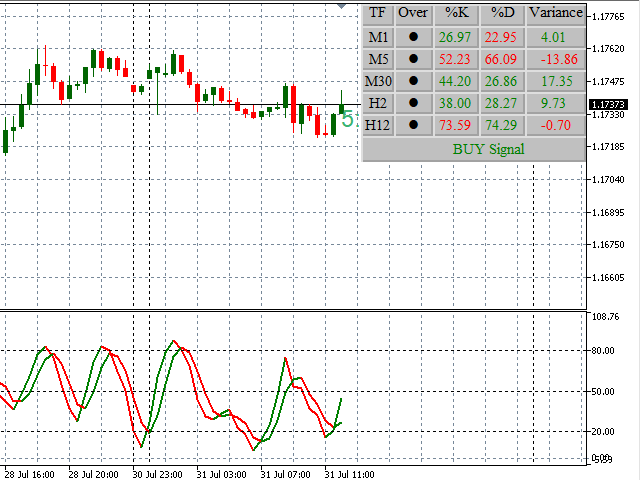
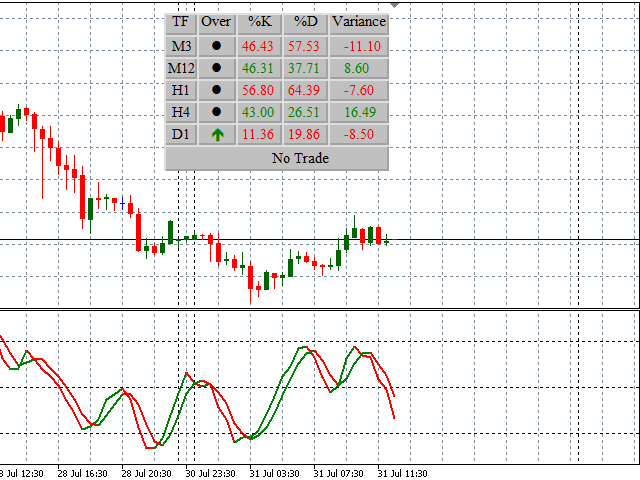
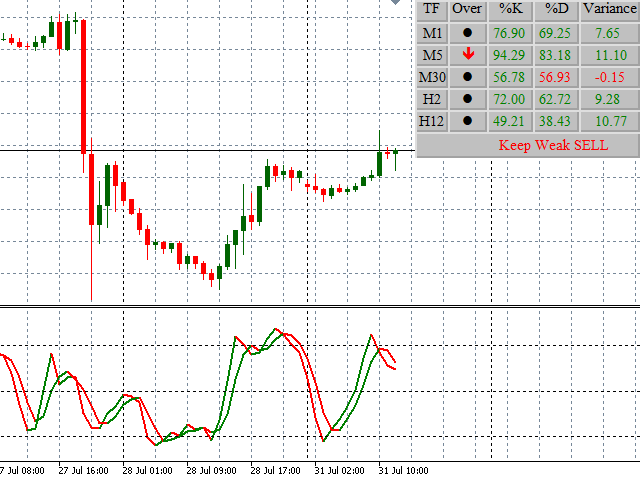
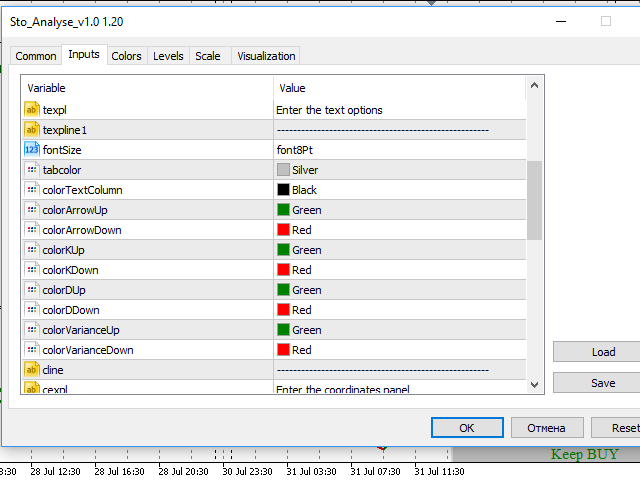
El indicador Estocástico en color con panel analítico se compone del propio indicador Estocástico y del panel informativo/analítico. El indicador proporciona opciones para configurar los parámetros y ajustar los colores. Puede personalizar el esquema de colores, el grosor y el aspecto de las líneas. El panel de información/análisis muestra los valores de las líneas %K y %D del estocástico, así como su diferencia para distintos periodos. En la parte inferior del panel se muestran las recomendaciones de negociación.
- No Operar - mantenerse fuera del mercado.
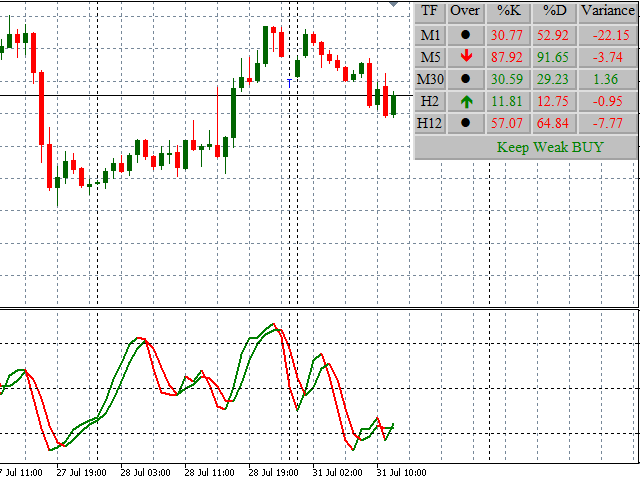
- Señal débil de COMPRA/VENTA - señal débil de compra/venta. No se recomienda operar con esta señal. Normalmente significa un movimiento correctivo.
- Señal deCOMPRA/VENTA - señal de compra/venta. Se recomienda abrir posiciones.
- Señal deCOMPRA/VENTA fuerte - señal de compra/venta fuerte. Se recomienda abrir posiciones.
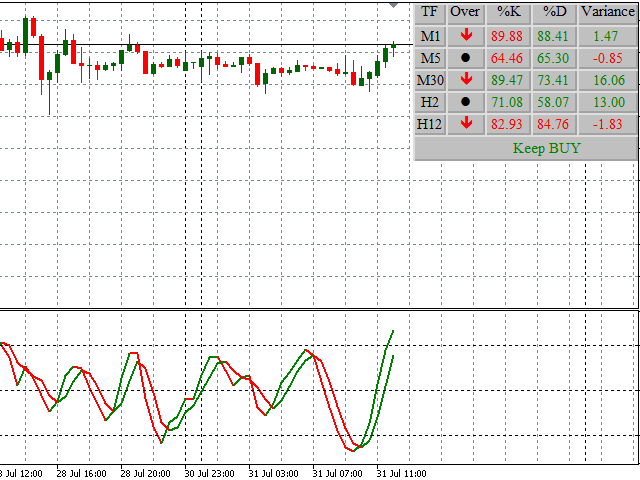
Las recomendaciones de Mantener... indican una continuación de la tendencia correspondiente. Mantenga su posición y aumente los beneficios.
El indicador permite seleccionar M30, H1, H4 o D1 como periodo de trabajo. Así, con este indicador podrá operar tanto con un día como durante varios días y semanas. Los usuarios pueden personalizar el esquema de colores del panel de información/análisis. La configuración por defecto es la siguiente
- Punto negro - los valores del indicador están en la zona neutral.
- Flecha roja hacia abajo - El estocástico está en la zona de sobrecompra. Se espera una reversión a la baja.
- Flecha verde hacia arriba - Estocástico está en la zona de sobreventa. Se espera un cambio de tendencia al alza.
Los colores rojo y verde significan una disminución y un aumento de los valores del indicador en relación con los anteriores.
Trabajar con el indicador
El estocástico en color con un indicador de panel analítico ofrece enormes oportunidades para analizar la situación del mercado y tomar decisiones comerciales. Pero incluso si no tiene esta experiencia, puede trabajar eficazmente utilizando las recomendaciones. A continuación se presentan algunos consejos que le ayudarán en el análisis de la situación del mercado.
- El cambio en el color de las líneas estocásticas indica una inversión del mercado.
- La posición del estocástico por encima/debajo del nivel 50 indica una tendencia alcista/bajista.
- Los parámetros sto_overbuy y sto_oversold permiten establecer un filtro, donde las señales de compra/venta deben ser ignoradas.
- Las señales de los periodos de trabajo (M30, H1, H4, D1) deben tomarse sólo en el contexto de las tendencias en los periodos superiores. Los periodos menores sirven como confirmación de las señales de los periodos de trabajo. Para ello, puede utilizar la divergencia, la posición del indicador en relación con los niveles 20, 50, 80, el desarrollo de la subida/bajada del Estocástico durante un determinado período.
- Cuantos más valores del mismo color estén presentes en la columna Varianza, más fuerte será la señal y más fuerte el impulso del mercado.
- Cuantos más periodos estén en las zonas de sobrecompra/sobreventa, más probable es que el movimiento anterior termine y cambie.
- Un cambio de tendencia en los periodos más pequeños indica que la tendencia en los periodos más altos cambiará pronto.
Debe tenerse en cuenta que el Estocástico Color con un indicador de panel analítico por sí solo no es suficiente para un trading exitoso. Asegúrese de utilizar indicadores de tendencia y niveles de soporte/resistencia en sus operaciones.


Great product, A perfect solution to traders who believe in price Action. It is an intelligent interplay of price movement. This is a must have trading tool. Quite resourceful for professionals and newbies