Trigger Bands MT5
- Indikatoren
- Version: 4.7
- Aktualisiert: 18 November 2021
- Aktivierungen: 5

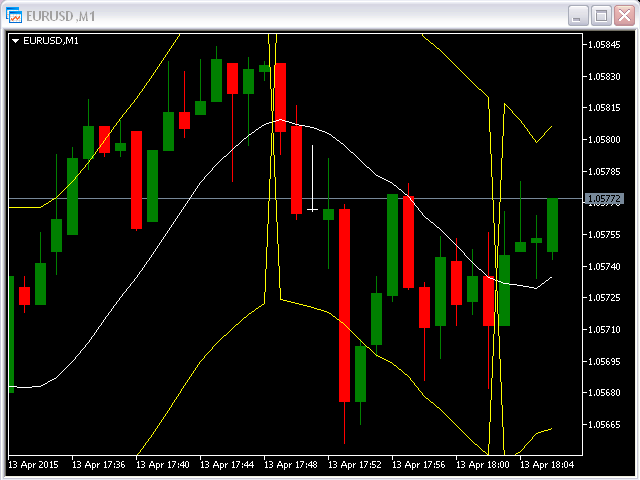
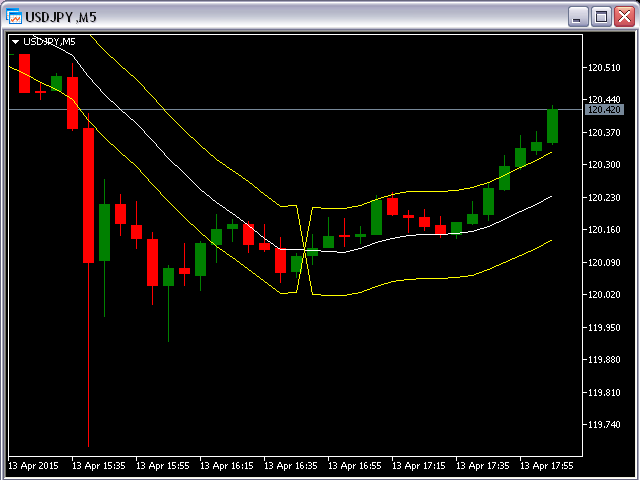
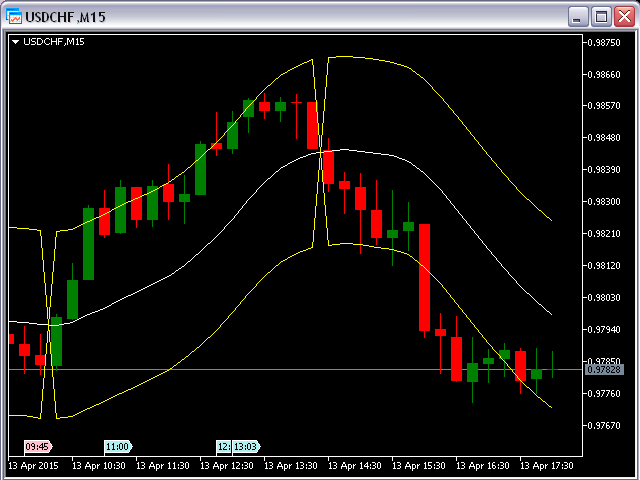
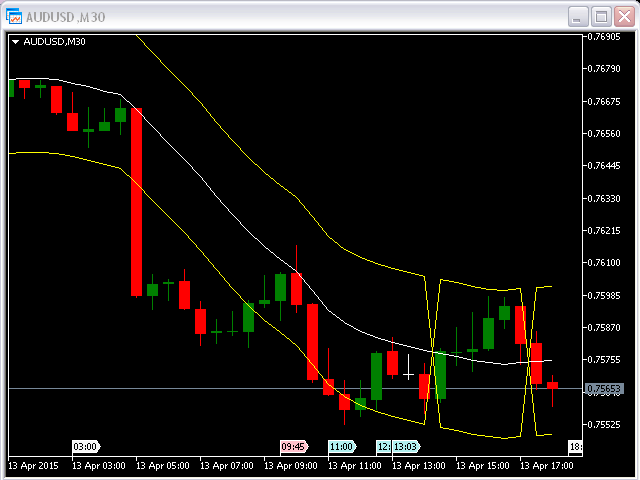
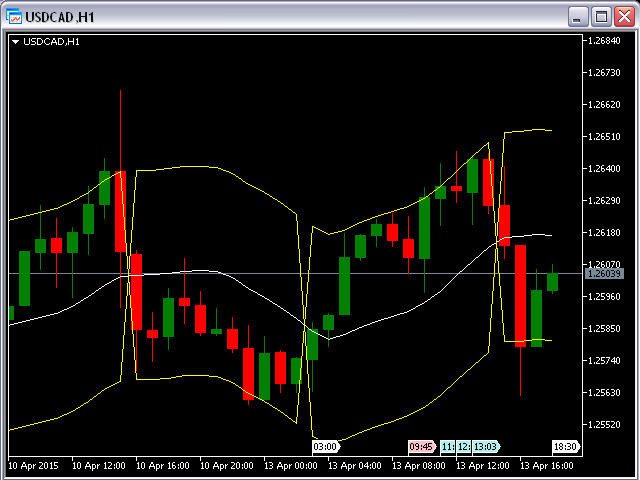
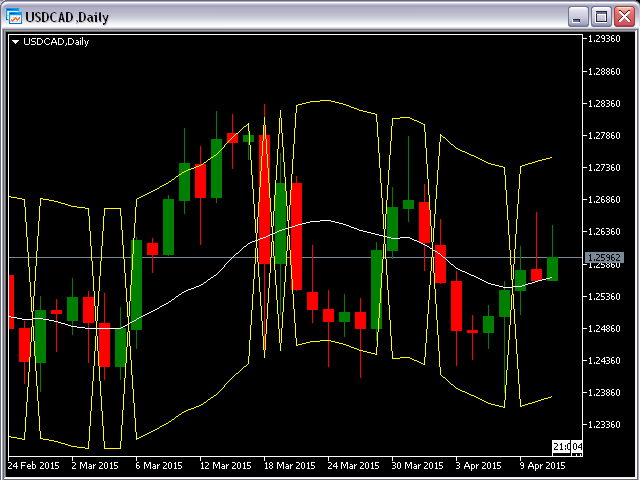
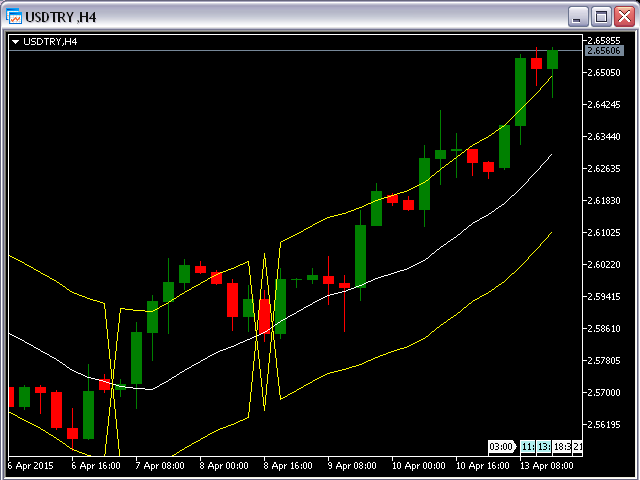
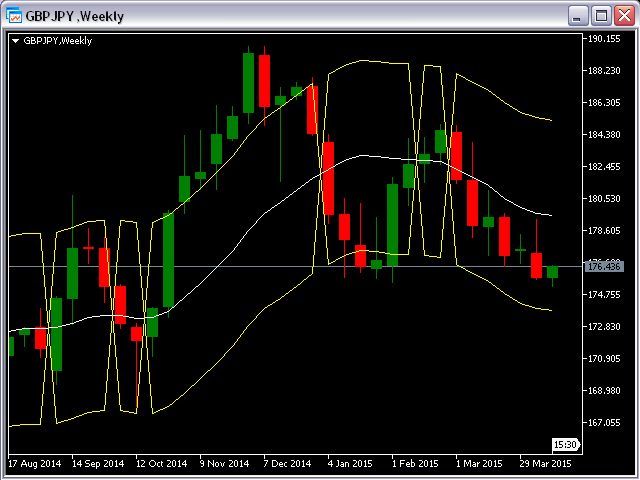
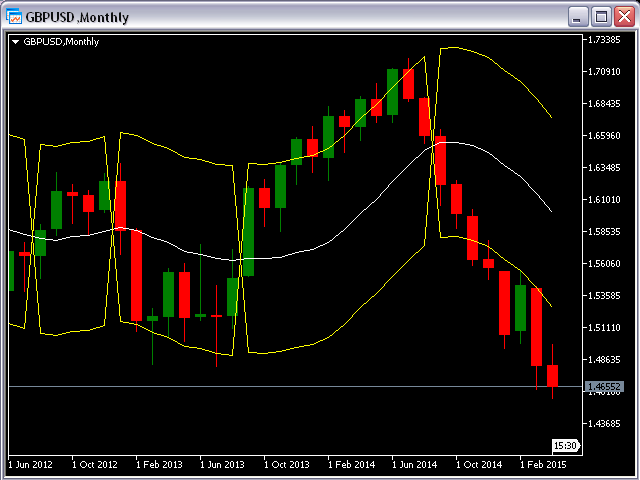
Dieser Indikator zeigt Bänder (flexibler Korridor) für eine aktuelle Kursbewegung und den Trendwechsel an. Der Indikator kann für beliebige Zeitrahmen und Währungspaare verwendet werden.
Die folgenden Eingabeparameter können leicht an Ihre Bedürfnisse angepasst werden:
- nPeriod = 13; - Anzahl der Balken, die der Indikator für die Berechnung verwendet
- Deviation = 1.618; - Koeffizient für den Abstand der Bänder von der Mittellinie
- MaShift = 0; - Verschiebung vom aktuellen Balken