Multicolor moving average
- Indicadores
- Versión: 1.3
- Activaciones: 20
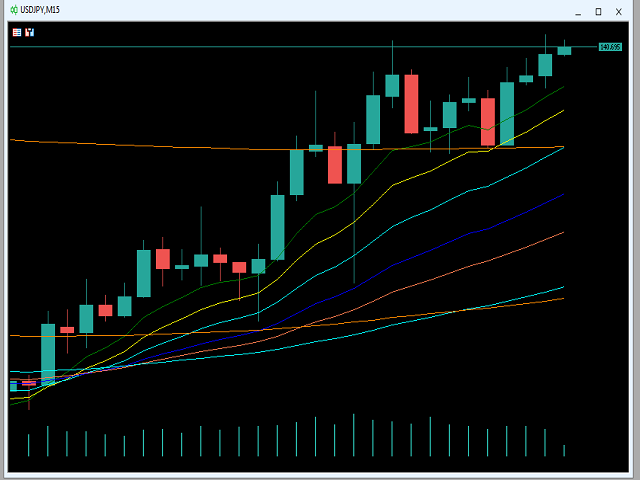
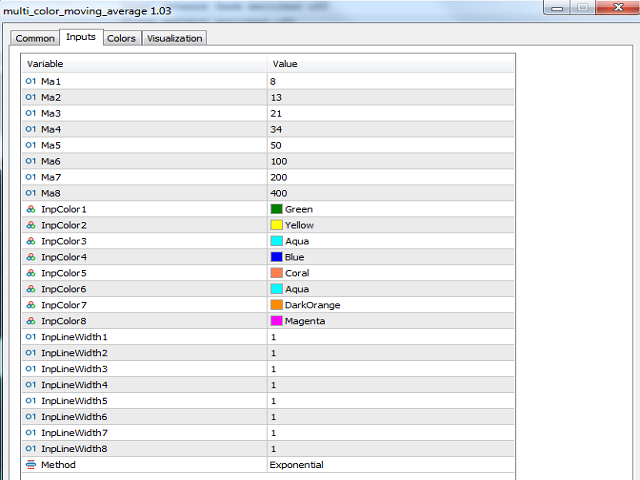
Media móvil multicolor (8x).
Definir período, color, ancho de línea.
Establecer periodo =0 para desactivar la media móvil.
Media móvil multicolor (8x).
Definir período, color, ancho de línea.
Establecer periodo =0 para desactivar la media móvil.
Usted acepta la política del sitio web y las condiciones de uso