LTT Range System
- Indicadores
-
Dmitriy Moshnin
 Торговать нужно так, чтобы не было мучительно больно за бесцельно вложенные деньги...
 - Versión: 1.0
- Activaciones: 5
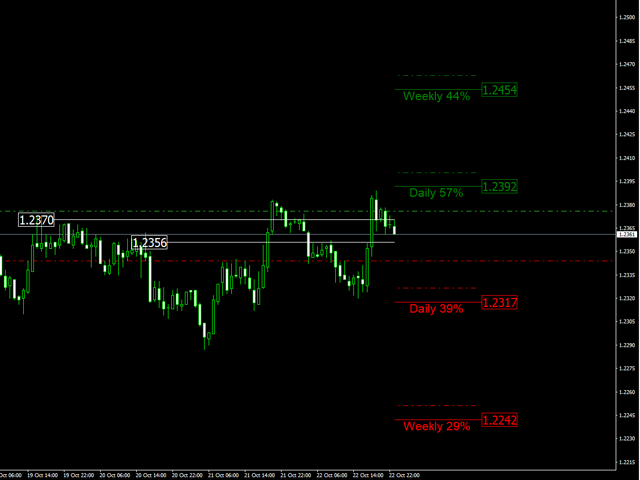
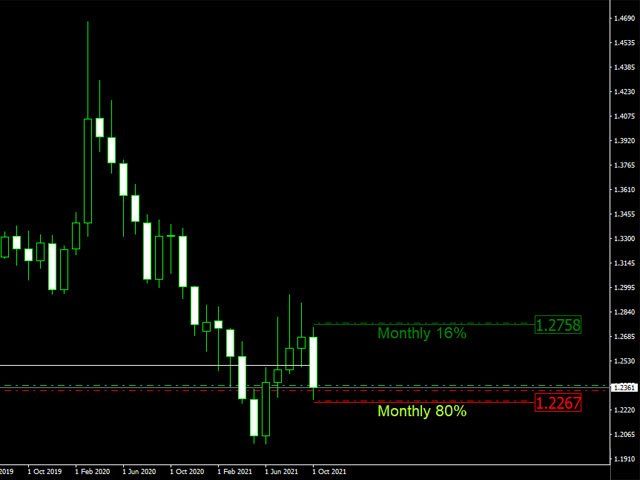
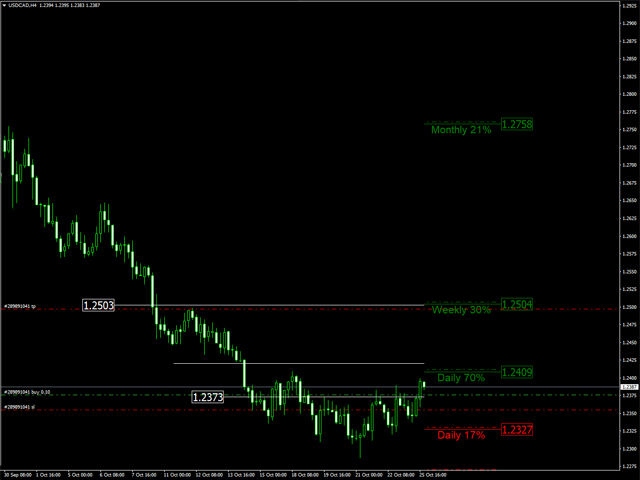
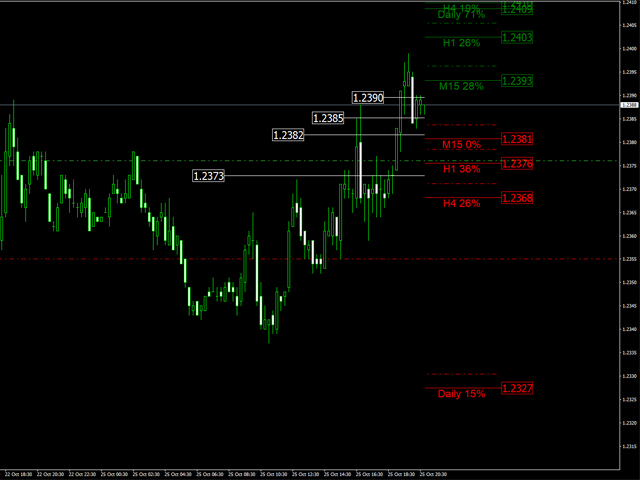
El indicador Forex LTT Range System muestra en el gráfico los rangos medios del movimiento del precio de mercado para los periodos M15, H1, H4, D1, W1, MN1. Los límites superior e inferior de los rangos se calculan a partir del precio de apertura de la barra. El pivote es el punto medio entre el precio de apertura de la barra y el límite del rango: si el precio de mercado está por encima del precio de apertura de la barra - la marca del pivote se encuentra entre el precio de apertura de la barra y la marca superior del rango, si el precio de mercado está por debajo del precio de apertura de la barra - la marca del pivote se encuentra entre el precio de apertura de la barra y la marca inferior del rango. El indicador elimina las marcas de nivel de los rangos rotos por el precio. Los rangos de trabajo de los indicadores se calculan según la estrategia del Sistema LTT.
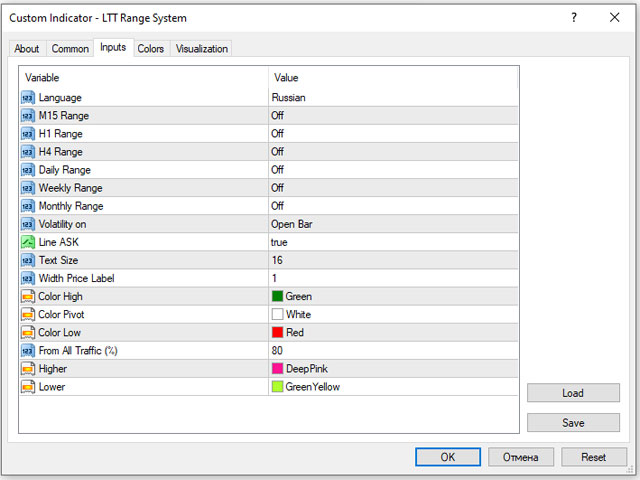
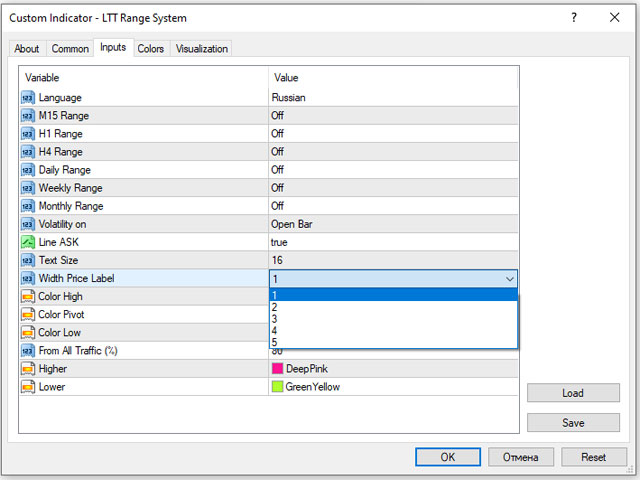
Parámetros del indicador
- Idioma- - selección del idioma: ruso o inglés;
- M15 Range - selección del rango para 15 minutos;
- H1Range - selección del rango para 1 hora;
- H4Range - seleccióndel rango para 4 horas;
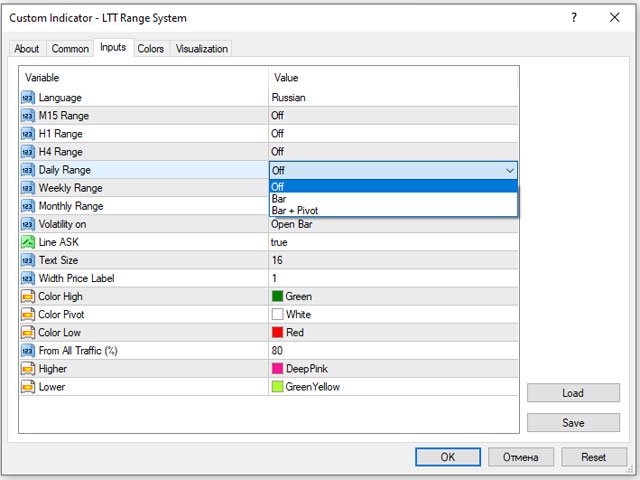
- Diario Rango - selección del rango diario;
- Semanal Range - seleccióndel rango semanal;
- Mensual Range - selección del rango diario;
- Volatilidad- cálculo del rango por barra abierta, barra cerrada o tiempo real;
- Línea ASK - mostrar u ocultar ASK;
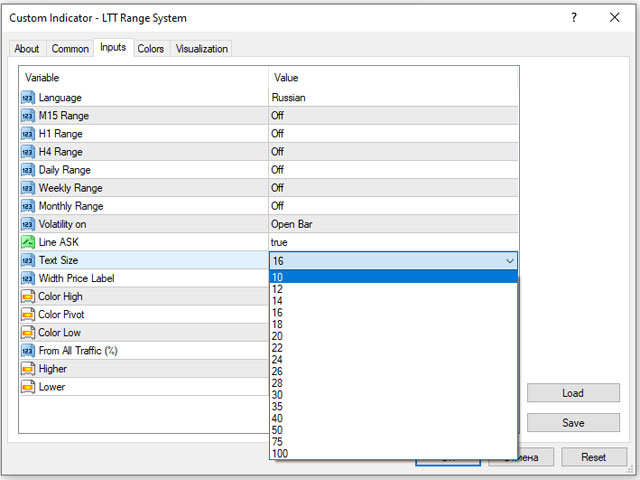
- Texto Tamaño - tamaño de la fuente;
- Ancho Precio Etiqueta - tamaño de la etiqueta de precio;
- Color Alto - el color del borde superior de la gama;
- Color Pivote - el color del centro de la gama;
- Color Bajo - el color del borde inferior de la gama;
- Desde Todo Tráfico (%) - establece el porcentaje del rango de trabajo;
- Superior Tráfico - color por encima del rango de trabajo;
- Inferior Tráfico - color por debajo del rango detrabajo.
Aplicación del indicador LTT Range System
El indicador LTT Range System es multidivisa, multiplataforma - se puede utilizar en cualquier instrumento del terminal comercial Metatrader 4 y en cualquier plataforma temporal.
Después de abrir una barra, el indicador establece los niveles del límite inferior, límite superior y pivote (pivote se puede quitar en la configuración). Los niveles de los límites superior e inferior se pueden utilizar para establecer Stop Loss y Take Profit. Si el precio se mueve en una dirección hacia el límite superior, el nivel inferior del indicador se moverá detrás de él, manteniendo el rango medio. El trabajo del indicador en la dirección opuesta es similar. Si el precio de mercado fluctúa en ambas direcciones desde el precio de apertura de la barra - el indicador tira hacia arriba de ambos niveles, limitando el rango medio por arriba y por abajo, en este caso Stop Loss y Take Profit deben moverse detrás de los niveles del indicador.
Cuando se negocia vale la pena considerar el tiempo y la distancia a los bordes del rango, si el precio ha alcanzado el borde del rango o incluso roto a través, no vale la pena negociar en la misma dirección, en el mismo rango, porque el rango está trabajado - un pullback o fluctuaciones de precios en un lugar son posibles, y también, si el precio ha pasado la mayor parte del rango, digamos 75-85% - es demasiado tarde para entrar en el acuerdo, porque sólo 25-15% del movimiento permanece. Y viceversa, si quedan un par de días en el calendario hasta el final del mes (final de la semana), y el movimiento no se ha resuelto - lo más probable es que el precio supere la distancia asignada en el par de días restantes. Al abrir posiciones para la venta, Stop Loss y Take Profit deben fijarse en la línea Ask del indicador, teniendo en cuenta el spread. Si el precio ha roto el borde del rango, el indicador elimina la marca de borde.
La práctica demuestra que los pivotes calculados por el indicador son fuertes niveles de resistencia y soporte, cuando el precio pone a prueba estos niveles en los plazos superiores deben ser monitoreados de cerca.