LTT Range System
- インディケータ
-
Dmitriy Moshnin
 Торговать нужно так, чтобы не было мучительно больно за бесцельно вложенные деньги...
 - バージョン: 1.0
- アクティベーション: 5
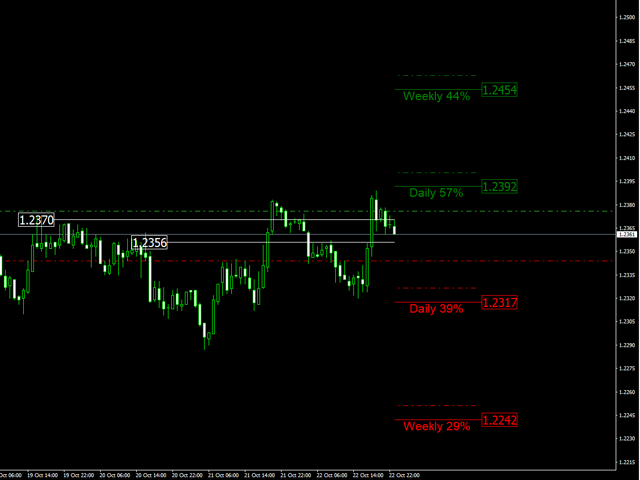
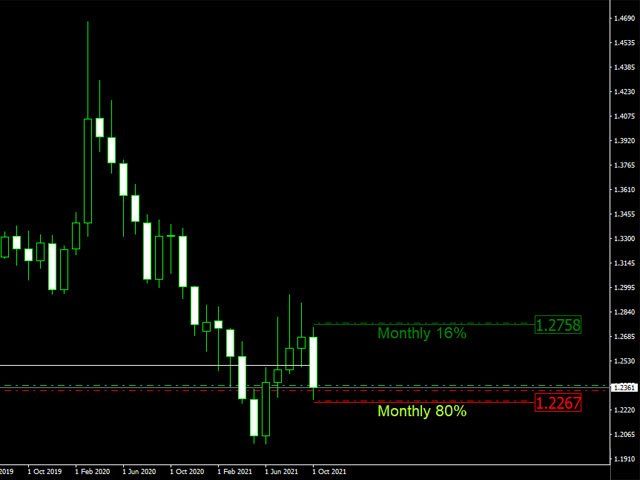
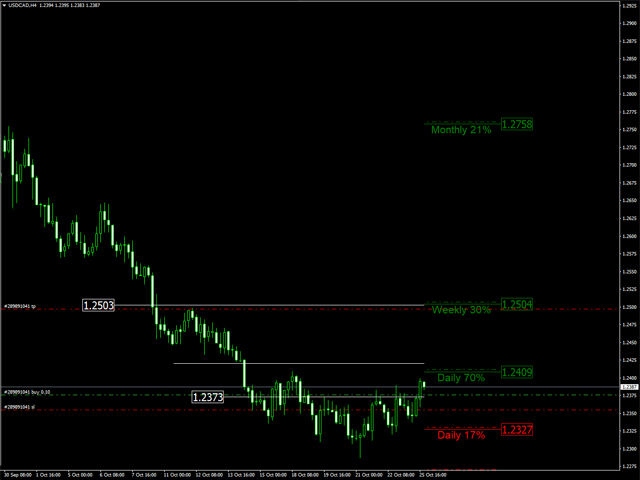
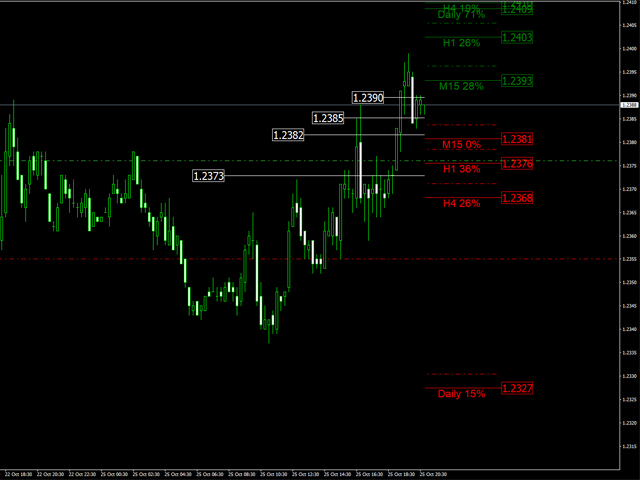
Индикатор Форекс LTT Range System показывает на графике средние диапазоны движения рыночной цены за периоды M15, H1, H4, D1, W1, MN1. Верхняя и нижняя границы диапазонов рассчитываются от цены открытия бара. Пивот – середина между ценой открытия бара и границей диапазона: если рыночная цена находится выше цены открытия бара – метка пивота располагается между ценой открытия бара и верхней меткой диапазона, если рыночная цена находится ниже цены открытия бара – метка пивота располагается между ценой открытия бара и нижней меткой диапазона. Индикатор удаляет метки уровней пробитых ценой диапазонов. Рабочие диапазоны индикаторы рассчитаны по стратегии LTT System.
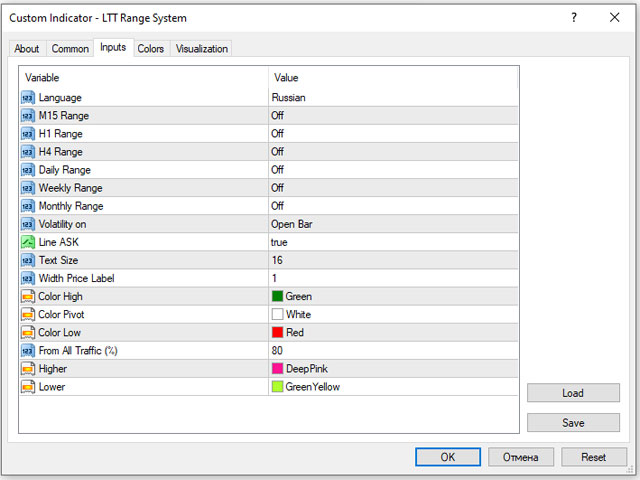
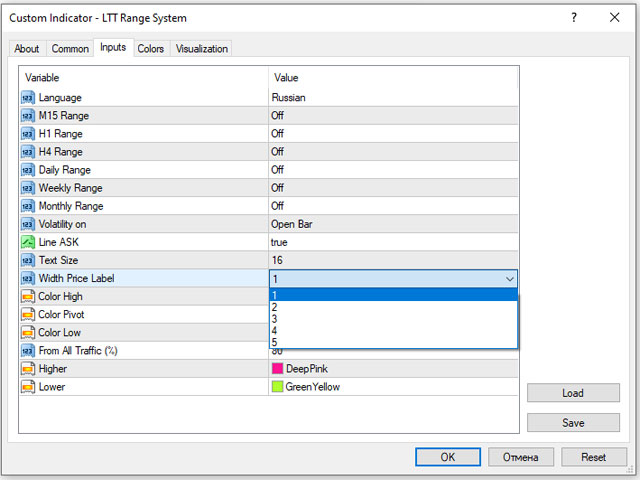
Параметры индикатора
- Language - выбор языка: русский или английский;
- M15 Range – выбор диапазона за 15 минут;
- H1 Range – выбор диапазона за 1 час;
- H4 Range – выбор диапазона за 4 часа;
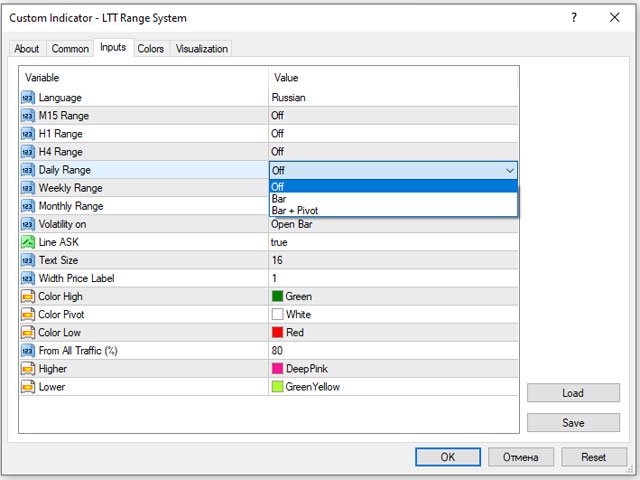
- Daily Range – выбор дневного диапазона;
- Weekly Range – выбор диапазона недели;
- Monthly Range – выбор дневного диапазона;
- Volatility – расчет диапазона по открытому бару, закрытому или реальному времени;
- Line ASK – показывать или скрыть ASK;
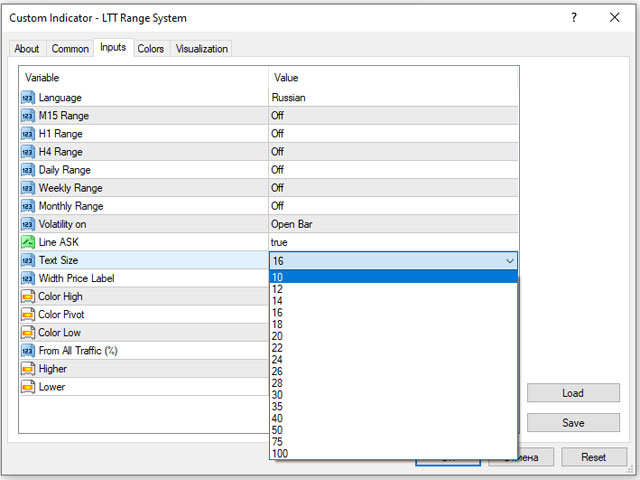
- Text Size – размер шрифта;
- Width Price Label – размер ценовой метки;
- Color High – цвет верхнего края диапазона;
- Color Pivot – цвет середины диапазона;
- Color Low – цвет нижнего края диапазона;
- From All Traffic (%) – задать процент рабочего диапазона;
- Higher Traffic – цвет выше рабочего диапазона;
- Lower Traffic – цвет ниже рабочего диапазона.
Применение индикатора LTT Range System
Индикатор LTT Range System мультивалютный, мультитаймфреймовый – может применяться на любом инструменте торгового терминала Метатрейдер 4 и на любом таймфрейме.
После открытия бара индикатор выставляет уровни нижней границы, верхней границы и пивота (пивот в настройках можно убрать). Уровни верхней и нижней границы можно использовать для уставки Стоп Лосса и Тейк Профита. Если цена движется в одном направлении к верхней границе, нижний уровень индикатора будет перемещаться за ней, выдерживая средний диапазон. Аналогична работа индикатора в обратном направлении. Если рыночная цена колеблется в обе стороны от цены открытия бара - индикатор подтягивает оба уровня, ограничивая средний диапазон сверху и снизу, в этом случае Стоп Лосс и Тейк Профит нужно перемещать за уровнями индикатора.
При торговле стоит учитывать время и расстояние до краев диапазона, если цена достигла край диапазона или даже пробила, торговать в том же направлении, в этом же диапазоне не стоит, т.к. диапазон отработан – возможен откат или колебания цены на одном месте, а также, если цена прошла большую часть диапазона, скажем 75-85% – в сделку входить уже поздно, т.к. остается всего 25-15% движения. И наоборот, если в календаре осталось пару дней до конца месяца (конца недели), а движение не отработано – то вероятнее всего цена преодолеет отведенное расстояние за оставшиеся пару дней. При открытии позиций на продажу Стоп Лосс и Тейк Профит следует устанавливать на линии Ask индикатора, учитывая спред. Если цена пробила край диапазона, индикатор крайнюю метку удаляет.
Практика показывает, что пивоты рассчитанные индикатором являются сильными уровнями сопротивления и поддержки, при тестировании ценой этих уровней на старших таймфреймах следует вести внимательное наблюдение.