RSI Converter
- Indicadores
-
Dmitriy Moshnin
 Торговать нужно так, чтобы не было мучительно больно за бесцельно вложенные деньги...
 - Versión: 1.1
- Actualizado: 20 noviembre 2021
- Activaciones: 5
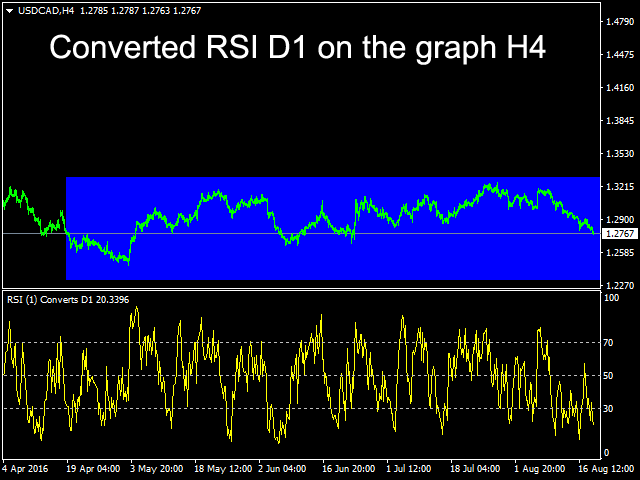
El Índice de Fuerza Relativa con funcionalidad avanzada recalcula (convierte) el periodo de promediación de acuerdo con el valor del parámetro Time Frame para intervalos de tiempo de gráficos inferiores (Multi-TimeFrame (MTF)). A diferencia del indicador estándar, el convertidor RSI incluye un sistema de alerta que notifica sobre cambios en la situación del mercado, consiste en las siguientes señales:
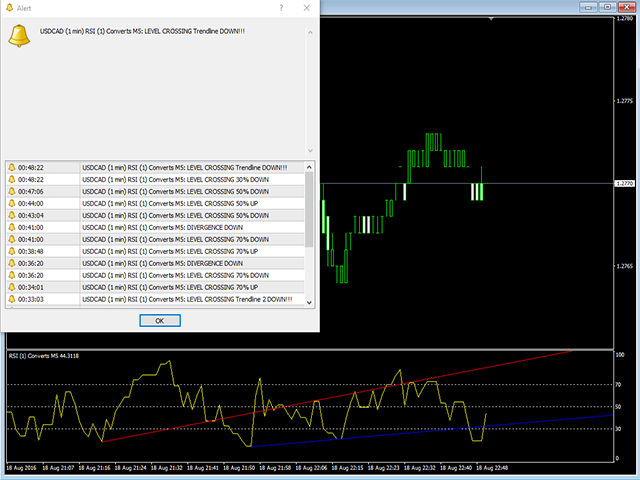
- La línea principal cruza los niveles de las zonas extremas (30%, 70%) y el nivel del 50%;
- La línea principal cruza una o dos líneas de tendencia en la ventana del indicador;
- Divergencia en la última barra
Los parámetros de los niveles medio y extremo y de las zonas de divergencia son personalizables.
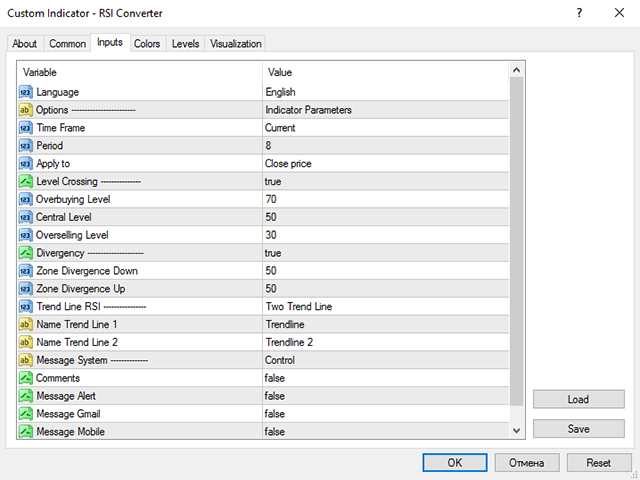
Parámetros
- Idioma - seleccione inglés o ruso;
- Opciones - seleccionar el intervalo de tiempo a convertir, Actual - período de tiempo actual (el indicador funciona en el modo normal). Selección del período de promedio del RSI para el precio aplicado: Cierre, Apertura, Máximo en un período, Mínimo en un período, Mediana, Típico, Ponderado;
- Level Сrossing - activar/desactivar la alerta cuando la línea principal del RSI cruza los niveles de sobrecompra/sobreventa y la línea media;
- Divergencia - activar/desactivar una alerta de divergencia de precios en la ventana principal y en la ventana del indicador en la última barra;
- Línea detendencia RSI - activar/desactivar una alerta cuando la línea RSI cruza una o dos líneas de tendencia en la ventana del indicador. Las líneas de tendencia deben ser aplicadas por el usuario, deben ser nombradas como "Nombre Línea de Tendencia 1" y "Nombre Línea de Tendencia 2" en la ventana de Propiedades del indicador;
- Sistema de mensajes - sistema de alertas.
Alertas
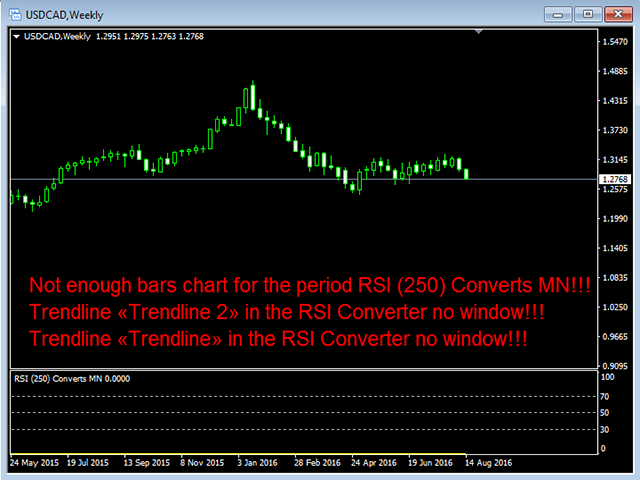
Las alertas aparecen como un comentario en la ventana principal del gráfico, como una alerta, notificaciones push para la versión móvil del terminal instalada en un teléfono móvil, o un correo electrónico. La conveniencia del indicador es que le permite recibir y seguir señales lejos de su PC (en su dispositivo móvil) para que pueda controlar la apertura y cierre de posiciones. Todas las alertas se activan al cierre de la barra correspondiente al periodo de tiempo de la ventana del gráfico. Si la opción "Línea de tendencia RSI" está activada y no hay líneas de tendencia en la ventana del indicador, se reproduce una alerta de error y se muestra una advertencia en la ventana principal del indicador. También se muestra una advertencia si el valor del periodo del RSI es incorrecto: no hay suficientes barras en el gráfico para que el periodo se convierta, utilice un periodo inferior del indicador o actualice las cotizaciones.
El sistema de alertas de RSI Converter es similar al utilizado en el indicador RSI Message.
¡Le deseamos éxito en sus operaciones!