Drawing Pack
- Indicadores
- Versión: 1.2
- Actualizado: 27 agosto 2022
- Activaciones: 10

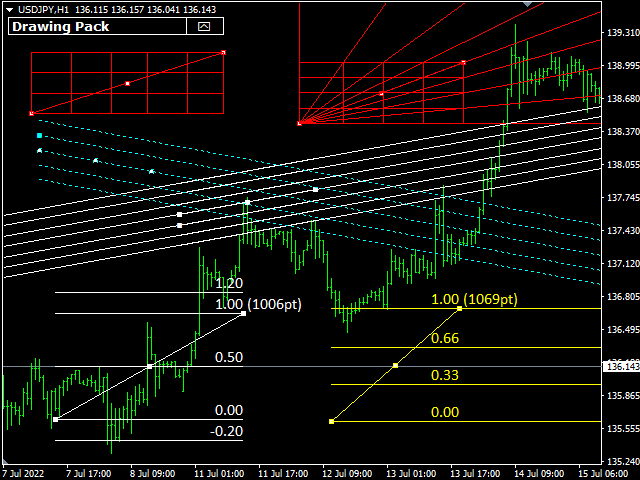
Este indicador proporciona varias herramientas de dibujo para ayudar en varios métodos de análisis gráfico.
Los dibujos mantendrán sus proporciones (de acuerdo con su línea de tendencia de mango) a través de diferentes escalas de gráficos, actualización en tiempo real, y múltiples dibujos son compatibles.
| # | Opción de dibujo | Descripción |
|---|---|---|
| 1 | Cuadrícula | rejilla en caja arrastrable, el usuario define filas x columnas, opción de rayo diagonal |
| 2 | Cuadrícula | cuadrícula parcial o a pantalla completa, dimensionada por línea de control |
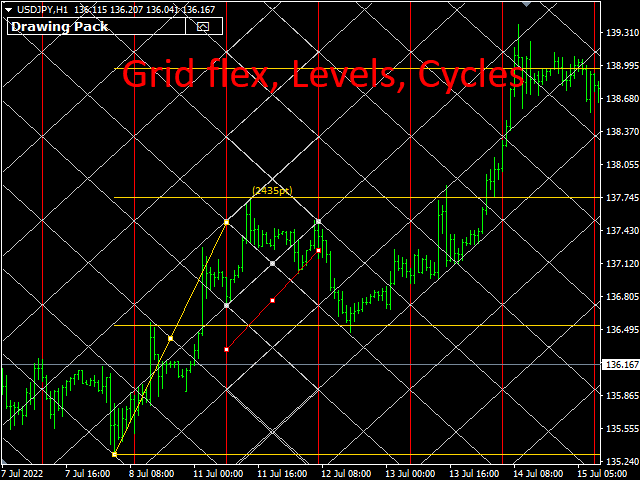
| 3 | Rejilla flexible | una cuadrícula diagonal, dimensionada e inclinada por la línea de control |
| 4 | Ciclos | similar a la línea de ciclo incorporada, pero con opción de ciclo a pantalla completa |
| 5 | Niveles | niveles horizontales, altura definida por la línea del tirador, anchura completa opcional |
| 6 | Números redondos | introducción por el usuario del número redondo (en puntos), admite varios niveles |
| 7 | Niveles de rango | la línea del asa se divide verticalmente en niveles etiquetados, niveles definidos por el usuario (como % de la altura del asa), opción de alerta |
| 8 | Canal | líneas de canal superior e inferior, número de canales ajustable, ajuste de altura por arrastre, rayo opcional a derecha e izquierda+derecha, alerta |
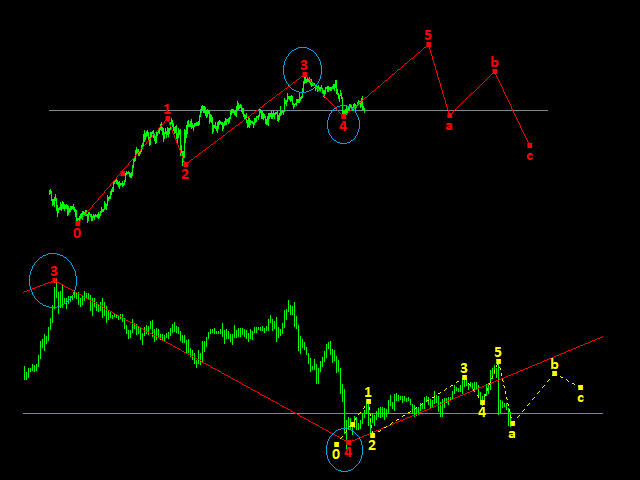
| 9 | Onda Elliott | un único objeto de dibujo con ondas etiquetadas 1-2-3-4-5-a-b-c |
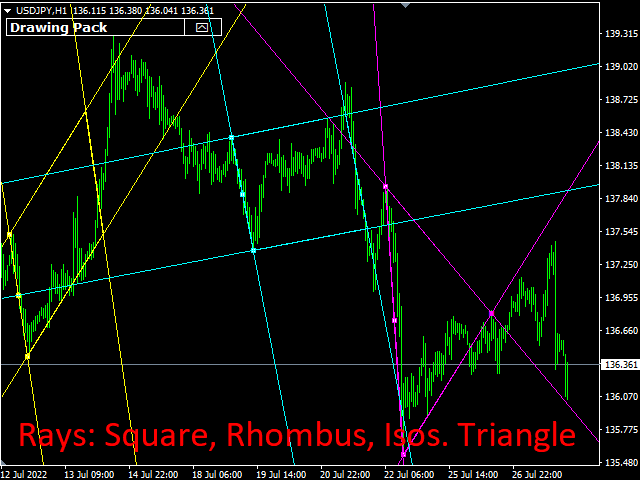
| 10 | Cuadrado | mantiene la proporción, opción de rayo |
| 11 | Rombo | mantiene la proporción, cada extremo del anclaje del asa ajusta el punto diagonalmente opuesto del rombo, opción de rayo |
| 12 | Triángulo | mantiene la proporción, cuadrilátero e isósceles, mantiene la proporción con la línea del asa y la punta para isósceles, opción de rayo |
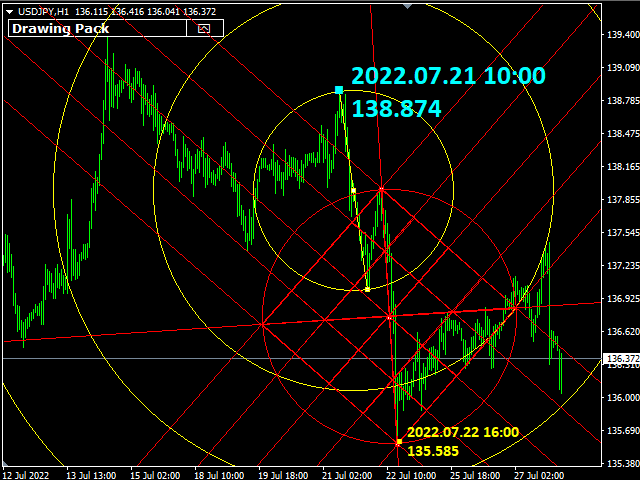
| 13 | Círculo conjunto 1 | (filas y columnas de cuadrícula definidas por el usuario) cuadrícula, cuadrícula superpuesta, cuadrícula flexible, cuadrícula giratoria, círculos concéntricos |
| 14 | Conjunto de círculos 2 | cuadrado en círculo, triángulo cuadrilátero en círculo, cuadrícula de 3 y 4 tamaños dentro del círculo, rayos opcionales |
| 15 | Etiqueta de coordenadas | puntos con coordenadas de hora y precio, alertas de hora y precio |
| 16 | Regla | un cuadro con medidas de altura(puntos), anchura(barras o duración de tiempo) |
| 17 | Pendiente | una línea con pendiente (pts/barra y tamaño de pts y barras) |
Características:
- todos los dibujos tienen estilo individual, color, estilo, anchura, tamaño de fuente (no todos los dibujos tienen todas las opciones de estilo)
- mostrar/ocultar cada tipo de dibujo individual, o todos
- borrar el último tipo de objeto dibujado, o todos
- alertas para niveles de rango, números redondos, etiquetas de coordenadas, canales
Panel:
- colores estilizables
- escalable en tamaño y fuente
- movible
- puede minimizarse
- puede mostrar sólo las opciones de dibujo seleccionadas

Excellent tool. I'm only using a few of the drawing tools, but it is very versatile and useful for so many different types of strategies. Lots of options that make line studies easier and much more efficient. The ruler makes it quick and easy to see the magnitude of moves in pips, chronological time, number of candles. This is very well implemented and great for those who prefer to do line or geometric studies on their own.