ATR MT5 Indicator by PipTick
- Indicadores
-
Michal Jurnik
 "Talent is cheaper than table salt. What separates the talented individual from the successful one is a lot of hard work." - Stephen King. Those few words reflect myself very well. I am probably not the most talented developer in the world but I truly believe in hard work, professional attitude and
 - Versión: 1.3
- Actualizado: 3 diciembre 2021
- Activaciones: 5
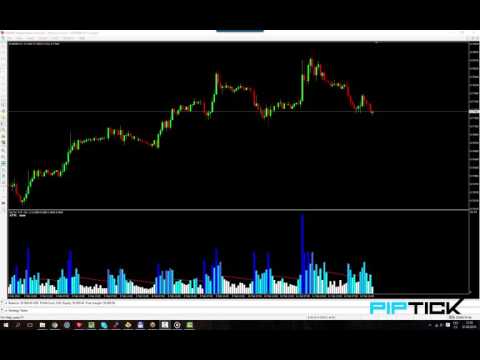
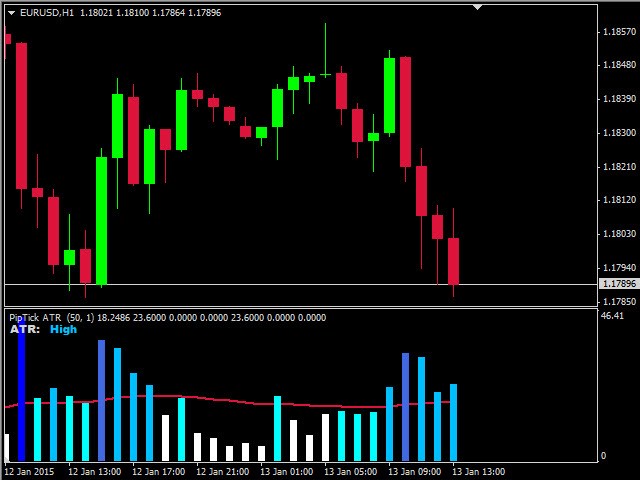
Elindicador A TR es una herramienta útil para medir el rango de las barras. Ayuda de forma rápida y sencilla a evaluar la dispersión (rango) actual del ATR, lo que resulta especialmente útil para los operadores de VSA. El indicador para clasificar el rango de las barras (velas) utiliza la media móvil y sus múltiplos. En consecuencia, la zona en la que se encuentra el volumen (en relación con la media móvil) se etiqueta como ultrabaja, baja, media, alta, muy alta o ultraalta. Nuestro indicador ATR se representa como un histograma.
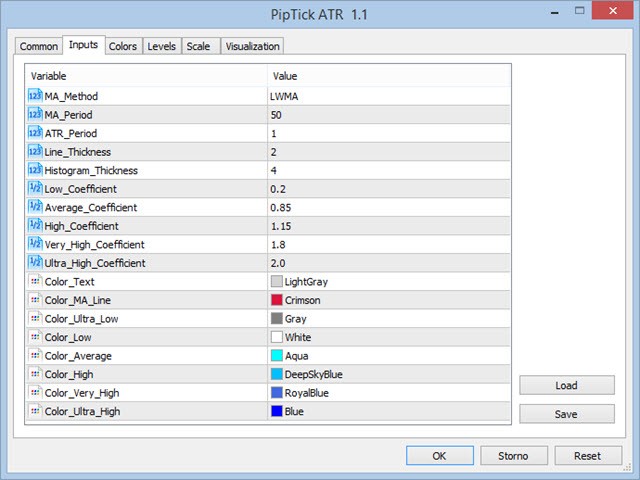
Este indicador puede calcular la media móvil por cuatro métodos:
- SMA - Media móvil simple
- SMMA - Media móvil suavizada
- EMA - Media móvil exponencial
- LWMA - Media móvil ponderada lineal
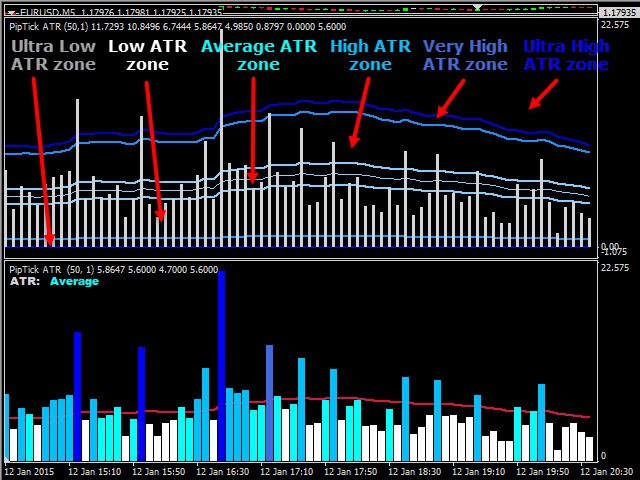
Interpretación
Por defecto, hay seis zonas que el usuario puede cambiar. Entonces, dependiendo de la zona que corresponda al ATR, la barra del histograma se colorea con el color apropiado. De esta forma, se puede reconocer fácilmente lo alto que es el ATR (spread/rango) en comparación con las barras anteriores.
- Zona ATR ultra baja - gris
- Zona de ATR bajo - blanco
- Zona ATR media - aqua
- Zona ATR Alta - azul cielo profundo
- Zona ATR muy alta - azul real
- Zona ATR ultra alta: azul
Características principales
- Clasificación sencilla de una serie de barras
- Varios métodos de cálculo opcionales
- Rangos de las zonas seleccionables por el usuario
- Funciona en todos los marcos temporales (M1, M5, M15, M30, H1, H4, D1, W1 y MN)
- Un indicador muy rápido y fiable
- Parámetros personalizables (colores, grosor de línea, periodo MA, etc.)


El usuario no ha dejado ningún comentario para su valoración