Ticks Bands
- Indicadores
- Versión: 1.14
- Actualizado: 7 diciembre 2025
- Activaciones: 5

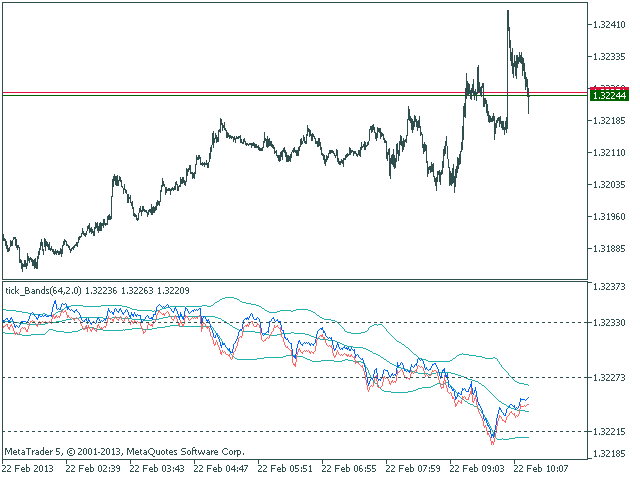
El indicador de Bandas de Bollinger dibujado usando un gráfico de ticks.
Después de lanzarlo, espere a que aparezcan suficientes ticks.
Parámetros:
- Período - período de promediación.
- Desviación - desviación de la línea principal.
- Conteo de niveles de precios - número de niveles de precios mostrados (no se muestran niveles si se establece en 0).
- Barra bajo cálculo - número de barras en el gráfico para el cálculo del indicador.
Índices del buffer: 0 - BASE_LINE, 1 - UPPER_BAND, 2 - LOWER_BAND, 3 - BID, 4 - ASK.