Color RSI With Alert
- Indicadores
- Versión: 1.0
- Activaciones: 5
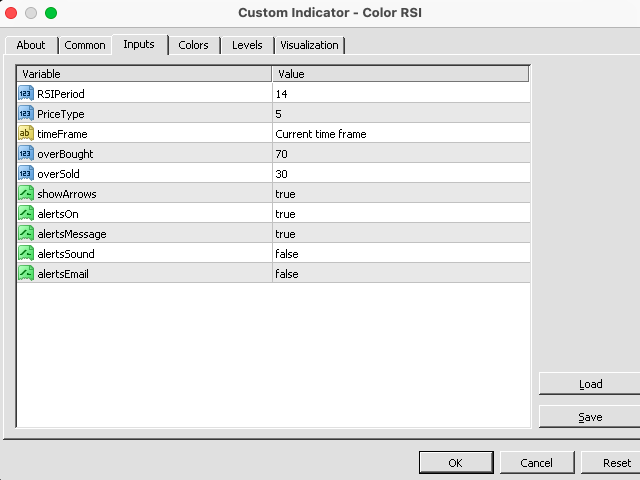
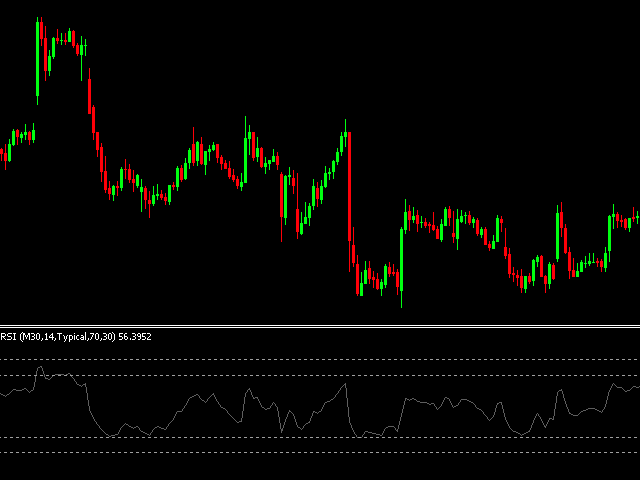
El indicador técnico Relative Strength Index (RSI) es un oscilador de seguimiento de precios que oscila entre 0 y 100. Cuando Wilder introdujo el Relative Strength Index, recomendó utilizar un RSI de 14 días. Desde entonces, los indicadores RSI de 9 y 25 días también han ganado popularidad.
Un método popular de analizar el RSI es buscar una divergencia en la que el valor está haciendo un nuevo máximo, pero el RSI no logra superar su máximo anterior. Esta divergencia es un indicio de una inversión inminente. Cuando el Índice de Fuerza Relativa gira a la baja y cae por debajo de su mínimo más reciente, se dice que ha completado una "oscilación de fallo". La oscilación de fallo se considera una confirmación de la inversión inminente.
Formas de utilizar el índice de fuerza relativa para el análisis de gráficos:
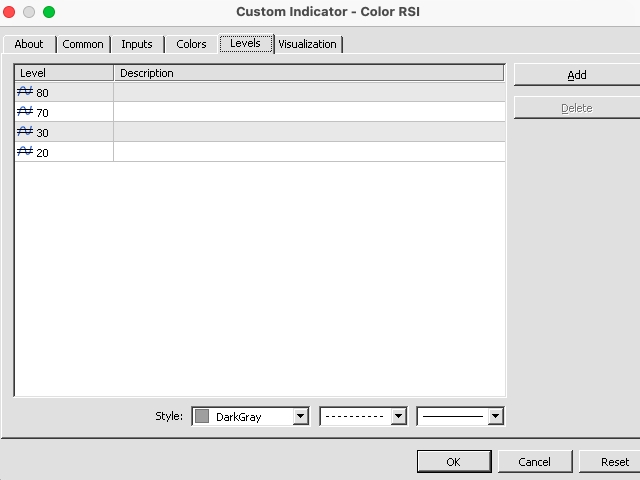
- Máximos y mínimos El Índice de Fuerza Relativa suele hacer máximos por encima de 70 y mínimos por debajo de 30. Suele formar estos máximos ymínimos. Suele formar estos máximos y mínimos antes que el gráfico de precios subyacente;
- Formaciones Gráficas El RSI a menudo forma patrones gráficos como cabezas y hombros o triángulos que pueden o no ser visibles en el gráfico de precios;
- Oscilación de fallos (penetraciones o rupturas de soportes o resistencias) Se produce cuando el Índice de Fuerza Relativa supera un máximo anterior (pico) o cae por debajo de un mínimo reciente (mínimo);
- Niveles de soporte y resistencia El Índice de Fuerza Relativa muestra, a veces con más claridad que los propios precios, los niveles de soporte y resistencia.
- Divergencias Como se ha comentado anteriormente, las divergencias se producen cuando el precio hace un nuevo máximo (o mínimo) que no se confirma con un nuevo máximo (o mínimo) en el Índice de Fuerza Relativa. Los precios suelen corregir y moverse en la dirección del RSI.