Draw Candle Levels
- Indicadores
- Versión: 1.3
- Actualizado: 7 mayo 2025
- Activaciones: 5
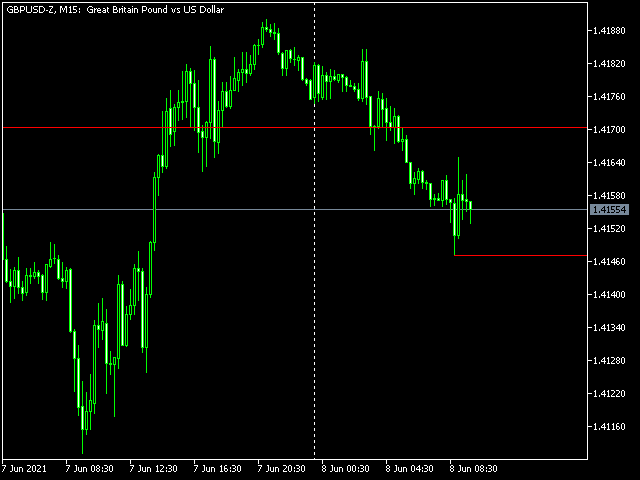
Puede dibujar fácilmente una línea de rayo horizontal para los niveles de precio de apertura, máximo, mínimo y cierre de cualquier vela con este indicador.
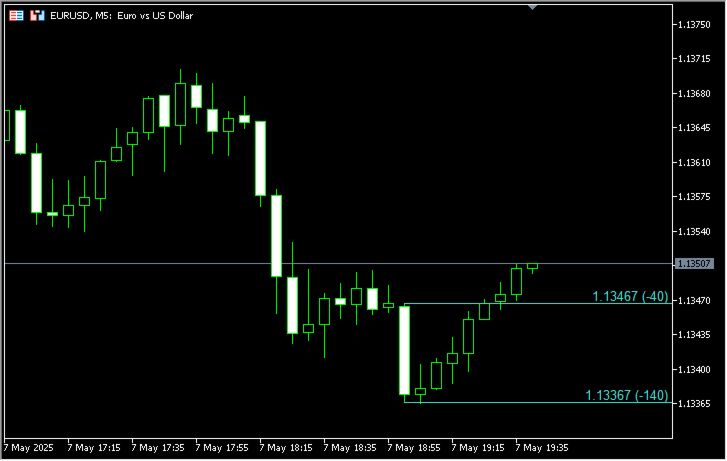
El indicador muestra opcionalmente textos por encima/debajo de las líneas de rayo, incluyendo el precio de la línea y la distancia desde el precio de Oferta en puntos.
Parámetros
Modo- Tecla + clic - primero debe presionar las teclas o, h, l o c en el teclado, luego haga clic en cualquier vela.
- Ratón+ clic - simplemente mueva su ratón y apunte a cualquier vela, luego presione las teclas o, h, l o c en el teclado.
Nota: en ambos modos, debe apuntar al centro horizontal de la vela para una selección precisa. La posición vertical del puntero es irrelevante.
Color de la línea
El color de la línea del rayo horizontal.
Ancho de línea
La anchura de la línea de rayo horizontal.
Estilo de línea
Estilo de la línea horizontal.
¿Línea seleccionable?
¿Debe una línea ser seleccionable o no?
Modo de etiquetas para líneas
Modo para las etiquetas de texto.- Desactivado: no se muestran etiquetas de texto.
- Por encima de la línea: etiquetas de texto siempre por encima de las líneas.
- Por debajo de la línea: etiquetas de texto siempre por debajo de las líneas
- Selección automática: etiquetas de texto por encima/debajo de las líneas en función del precio.
Color de la etiqueta
Color de las etiquetas de texto.
Tamaño de la etiqueta
Tamaño de las etiquetas de texto.
Tipo de letra de la etiqueta
Familia de fuentes de las etiquetas de texto.
¿Mostrar la distancia desde el precio de oferta?
Puede decidir que las etiquetas de texto incluyan o no la distancia en puntos desde el precio de oferta.
- Sí: la distancia desde el precio de Oferta también se muestra entre paréntesis detrás del precio de línea.
- No: la distancia desde el precio de Oferta se oculta.

Very useful product that helps draw shorter horizontal rays .The options allow to choose the opening or close or high or low prices to project the lines from.Its very user friendly.I requested Attila to add a feature to display the label detail which he implemented successfully.Highly recommended this product for support and resistance traders.