Dynamoc SR Trend Channel
- Indicadores
- Versión: 1.0
- Activaciones: 20

CANAL DINÁMICO DE TENDENCIA SR
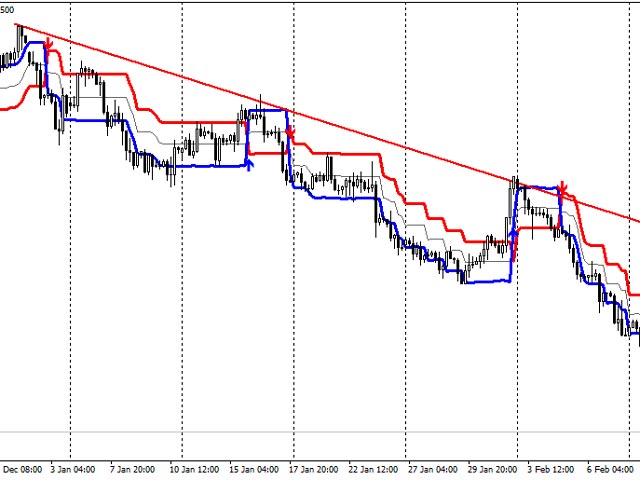
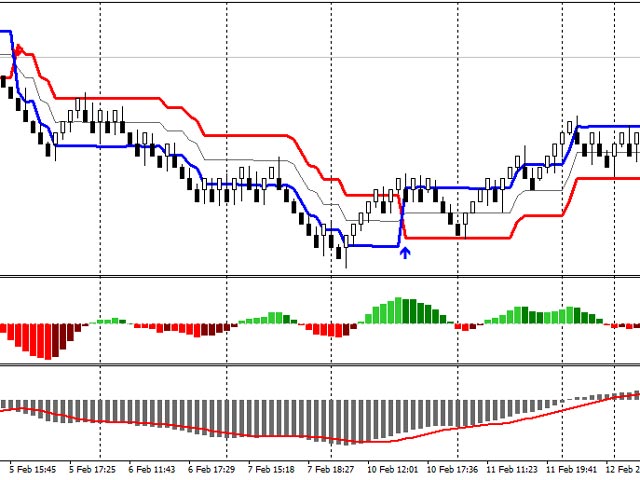
Dynamic SR Trend Channel es un indicador sencillo para la detección de tendencias, así como de niveles de resistencia/soporte en el marco temporal actual. Le muestra las áreas donde se puede esperar un posible cambio en la dirección de la tendencia y la continuación de la tendencia. Funciona con cualquier sistema de comercio (tanto la acción del precio y otros sistemas de comercio que utilizan indicadores) y también es muy bueno para el sistema de gráficos renko también.
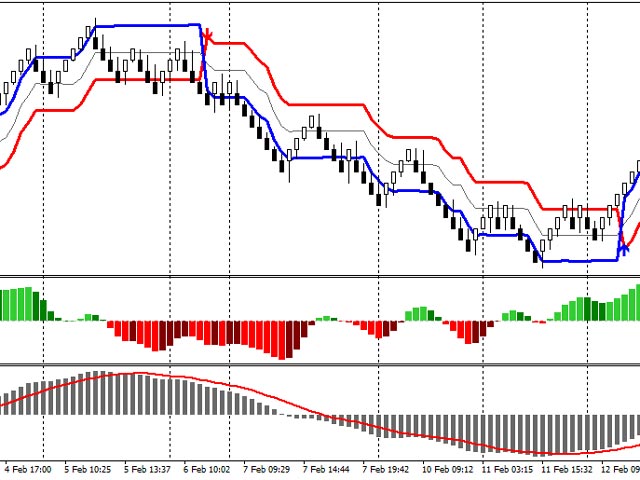
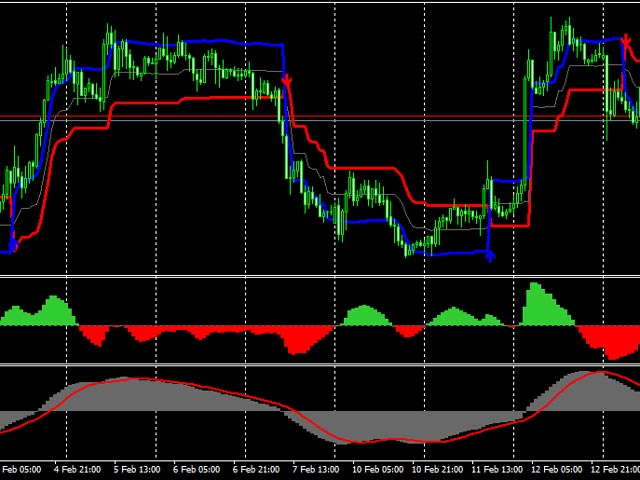
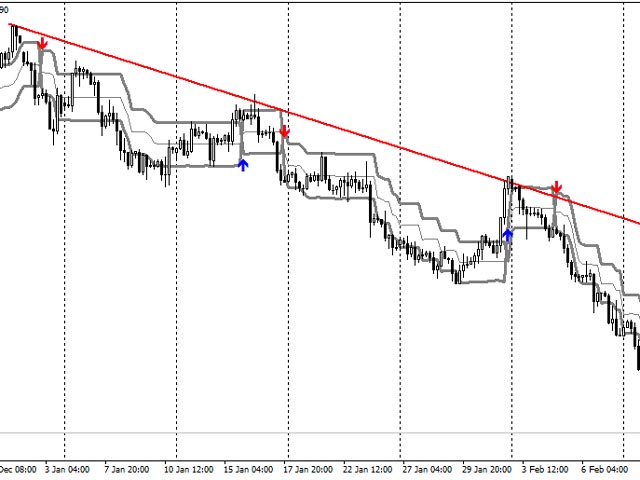
En una tendencia alcista, la línea roja (línea principal) sirve como soporte y la línea azul como resistencia, mientras que en una tendencia bajista, la línea roja (línea principal) sirve como resistencia y la línea azul como soporte.
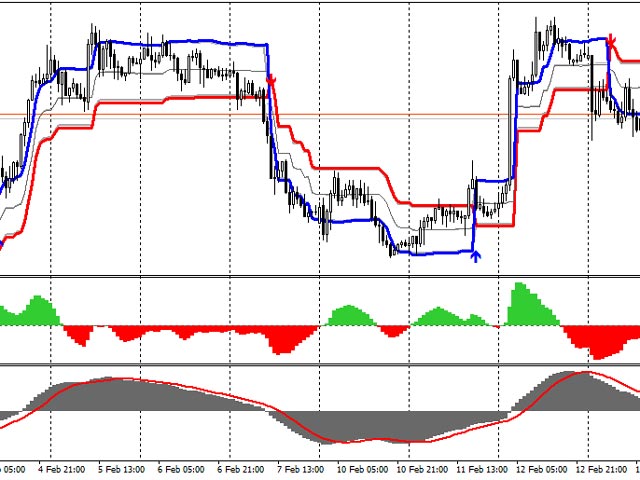
Si las velas cierran continuamente por encima o alrededor de la línea azul en la tendencia alcista, muestra que la tendencia alcista es fuerte, mientras que si las velas cierran continuamente por debajo o alrededor de la línea azul en una tendencia bajista, también muestra una fuerte tendencia bajista.
Las flechas alertan del cambio en la dirección de la tendencia y si la tendencia parece muy fuerte, compre inmediatamente o espere a un retroceso a la línea media (línea gris fina) o a la línea principal (línea roja).
El indicador funciona en todos los pares de divisas e instrumentos, así como en todos los marcos temporales.
Parámetros:
- Retroceso - para ajustar la línea principal (roja)
- Desviación - para ajustar la distancia de la línea media y externa (azul) de la línea principal
- Color único: para utilizar el mismo color para las tres líneas.
- Color de canal único - para seleccionar el mismo color para las tres líneas
- Alertas audibles - para activar/desactivar las notificaciones audibles de mt4
- Activar correo electrónico - para activar/desactivar las alertas por correo electrónico
- Notificaciones push - para activar/desactivar las notificaciones push al terminal móvil mt4
- Barras para calcular - para establecer el número de barras para dibujar el indicador. Tenga en cuenta que si el número de barras es menor que este número, el indicador no se dibujará. También tenga en cuenta que los valores muy altos ralentizan su terminal.