Draw Candle Levels

5

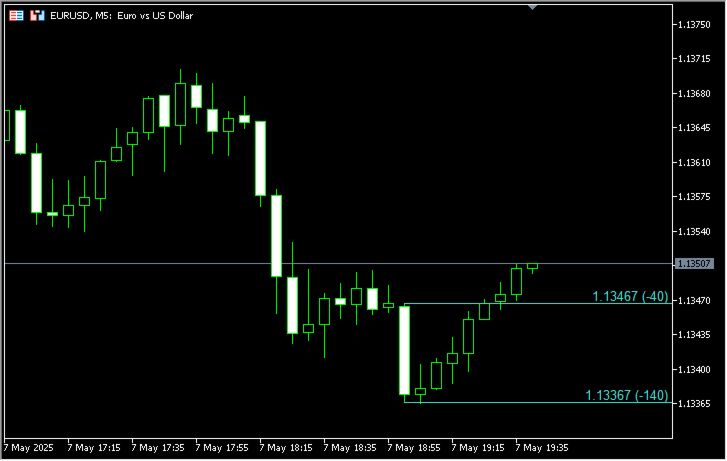
You can easily draw horizontal ray line for the open, high, low and close price levels of any candle with this indicator.

The indicators optionally shows texts above/below the ray lines, including the line price and distance from the Bid price in points.

Parameters

Mode

  • Key + click - you should press o, h, l or c keys on the keyboard first, then click on any candle.
  • Mouse hover + click - just move your mouse and point to any candle, then press o, h, l or c keys on the keyboard.

Note: in both modes, you should point the horizontal center of the candle for accurate selection. The vertical position of the pointer is irrelevant.

Line Color

The color of the horizontal ray line.

Line width

The width of the horizontal ray line.

Line style

The style of the horizontal ray line.

Line selectable?

Should a line be selectable, or not?

Label mode for lines

Mode for text labels.
  • Disabled: no text labels displayed.
  • Above line: text labels always above the lines
  • Below line: text labels always below the lines
  • Auto select: text labels above/below lines based on price

Label color

Color of the text labels.

Label size

Size of the text labels.

Label font type

Font family of the text labels.

Show distance from Bid price?

You can decide the text labels should include the distance from the Bid price in points, or not.

  • Yes: the distance from the Bid price is also shown in parentheses behind the line price.
  • No: the distance from the Bid price is hidden.

评分 3
krisnara123
2190
krisnara123 2021.11.30 14:23 
 

Very useful product that helps draw shorter horizontal rays .The options allow to choose the opening or close or high or low prices to project the lines from.Its very user friendly.I requested Attila to add a feature to display the label detail which he implemented successfully.Highly recommended this product for support and resistance traders.

推荐产品
Orderflow Super Candles - 简约足迹图指标 平台: MetaTrader 5 (MT5)  (最后一张截图是结合DOM工具配套使用的情况) 1. 产品简介 Orderflow Super Candles 是一款基于底层 Tick 数据分析的专业图表工具,旨在为交易者提供“市场X光”般的深度视角。 通过解析每一根 K 线内部的买卖成交量分布,该指标将隐蔽的市场微观结构可视化。它能帮助交易者透过价格表象,看清机构资金的真实博弈位置,精准识别支撑与阻力位的有效性,从而做出更具逻辑性的交易决策。 2. 核心功能 双重透视模式 买卖量分布 (Buy/Sell Volume): 经典足迹图模式。左侧显示主动卖单,右侧显示主动买单。直观对比每一价格档位的多空力量差异。 净买卖差模式 (Delta Profile): 显示每一价格档位的“买单减去卖单”的净值。绿色代表买方主导,红色代表卖方主导。 自适应缩放技术: 在 Delta 模式下,指标会自动计算当前视野范围内的 Delta 最大绝对值进行动态归一化,确保无论市场波动大小,色块显示都清晰可见。 关键价位自动标注 POC
Candle Close Timer Matrix
Sivakumar Paul Suyambu
Candle Close Timer Matrix – MT5 Candle Countdown Indicator Candle Close Timer Matrix is a lightweight and powerful MetaTrader 5 (MT5) candle countdown indicator that shows exactly how many minutes and seconds are left before the current candle closes on any symbol and any timeframe. Download MT5 EA Products Whether you are a scalper , intraday trader or swing trader , knowing the exact candle close time helps you: Time your entries on candle close Avoid impulsive mid-candle decisions Sync your t
FREE
Institutional Fusion Levels(机构融合水平指标) Institutional Fusion Levels 是一款专业的多时间框架支撑与阻力指标,旨在通过前一日、前一周和前一月的市场结构水平,识别高概率的机构价格反应区域。 该指标会自动在图表上绘制基于流动性的关键支撑与阻力区域,并标记出多个高时间框架水平相互融合的强共振区域。这些融合区域通常是重要的机构反应区,价格在这些位置可能出现拒绝、反转或强势延续。 Institutional Fusion Levels 帮助交易者无需手动绘制水平线即可快速识别重要市场结构水平,非常适合日内交易者、波段交易者、聪明资金交易者以及机构风格交易策略使用。 功能特点 • 自动绘制以下关键水平: 前一日最高价(PDH) 前一日最低价(PDL) 前一周最高价(PWH) 前一周最低价(PWL) 前一月最高价(PMH) 前一月最低价(PML) • 识别强机构融合区域: PML + PWL = 最强支撑区域 PMH + PWH = 最强阻力区域 • 多时间框架机构共振分析 • 可自定义显示选项: 显示/隐藏日线水平 显示/隐藏周线水平 显
这个多时间框架和多符号供需区仪表板指示器在价格达到供需区时发送警报。也可以使用它来提醒常规的双顶/双底而不是区域。它可以用于从 M1 到 MN 的所有时间范围。     仪表板中最多可同时显示 9 个时间范围。 可以使用 RSI、背离(MACD、RSI 或 Awesome)和蜡烛图过滤器(pin bar、吞没、镊子和晨星/夜星)来仅过滤掉最强的设置。结合您自己的规则和技术,该指标将允许您创建(或增强)您自己的强大系统。 在产品博客 的末尾,您将能够下载示例智能交易系统 (EA) 的源代码,该示例使用 iCustom() 函数从指标获取交易信号。尽管 EA 功能齐全,但主要目的是使用代码并将其粘贴到您自己开发的 EA 中或将您自己的额外进入/退出逻辑添加到此 EA 中。鉴于我的时间有限,我将无法提供任何编程支持。我很抱歉。 特征 这 足以放置一个指标图表上,你会出现在仪表板的任何新的信号接收警报。支持所有 Metatrader 本地警报类型。 在仪表板内持续执行排名排序。可以禁用此排序,以便更轻松地找到特定符号。然后,交易品种将按照它们在交易品种参数中输入的相同顺序显示,或者按照它们在
QuantumAlert Stoch Navigator is a free indicator available for MT4/MT5 platforms, its work is to provide "alerts" when the market is inside "overbought and oversold" regions in the form of "buy or sell" signals. This indicator comes with many customization options mentioned in the parameter section below, user can customise these parameters as needful. Join our   MQL5 group , where we share important news and updates. You are also welcome to join our private channel as well, contact me for the p
FREE
Veltrion Smart Fibonacci   is a clean automatic Fibonacci structure overlay for MetaTrader 5. It automatically detects recent swing highs and swing lows, then draws key Fibonacci retracement levels directly on the chart. The indicator is designed to help traders visualize market structure, retracement zones, and the golden zone without manually drawing Fibonacci tools. Key Features Automatic swing high and swing low detection Clean Fibonacci retracement overlay Horizontal Fibonacci levels for a
Crystal FVG Touch Detector – 智能资金概念高级指标 Crystal FVG Touch Detector 是为使用 Smart Money Concepts (SMC) 与 ICT 方法的专业交易者设计的高性能指标。 它能自动检测任何周期或品种的 Fair Value Gaps (FVG),并通过颜色区域与触碰检测清晰显示在图表上。 采用无重绘算法和高效结构,实时识别机构失衡区间。 主要特点 精准检测多空 FVG 区域。 实时跟踪价格触碰并自动更新。 多时间框架兼容并显示提醒。 自动配色适配深浅主题。 高效、稳定、无延迟。 参数全面可调。 关键词: FVG, 公允价值缺口, Smart Money Concepts, SMC, ICT, 订单块, 不平衡, 流动性, 机构交易, 供需, 不重绘, 成交量价差分析, 市场结构, 结构突破, CHoCH, BOS, 流动性清扫, 外汇指标, 黄金交易, MT5 指标, 剥头皮, 波段交易.
FREE
Candle Reversal , is designed to identify and highlight key candlestick patterns that signal potential trend reversals or continuations in the market. It focuses on two primary types of patterns: 3-Line Strike Patterns   (Bullish and Bearish) Engulfing Patterns   (Bullish and Bearish) The indicator provides visual cues (arrows and text labels) on the chart to help traders quickly identify these patterns, making it easier to make informed trading decisions.  use with MACD or awesome oscilator to
Veltrion Market Environment   is a professional market safety dashboard for MetaTrader 5. This indicator helps manual traders evaluate current market conditions before making trading decisions. It does not open trades, close trades, modify orders, or provide buy/sell signals. The dashboard analyzes key market environment factors: Spread condition ATR-based volatility condition EMA-based trend or range condition Trading session condition Market safety score Optional economic calendar status The i
Dragonfly Doji Trading System for MetaTrader 5 Dragonfly Doji Trading System is a price action indicator for MT5 designed to detect reversal candles with long lower rejection and near-equal open and close near the high. A detailed user guide is available on the author’s MQL5 Blog . Additional updates are available through the author’s   MQL5 Channel . Depending on the current support policy, buyers may receive additional access to selected companion tools developed by the author. Overview Drago
具有多时间框架支持、可自定义视觉信号和可配置警报系统的加速振荡器(AC)指标。 免费编程服务、更新及其他 TrueTL 产品请访问 MQL5 个人主页 。 非常感谢您的反馈和评价! 什么是 AC? 加速振荡器(AC)是由 Bill Williams 开发的动量指标,用于测量当前驱动力的加速或减速。该指标计算为 Awesome Oscillator(AO)与其 5 期简单移动平均线(SMA)之间的差值。 AC 显示市场动量是在加速还是减速。正值表示向上方向的加速,负值表示向下方向的加速。当 AC 穿越零线时,标志着加速方向的变化。交易者经常使用 AC 来确认趋势强度并识别潜在的进场或出场点。 功能特点: 带箭头标记和垂直线的视觉信号标记 具有可配置触发条件的三个独立信号缓冲区 信号检测选项:方向变化、水平线穿越、峰值/谷值 每个信号可配置警报功能(邮件、推送、声音、弹窗) 支持插值方法的多时间框架(MTF)功能 直方图或折线绘制模式 多种颜色模式(简单、方向型、水平线型) 支持 Expert Advisor(EA)集成的自定义指标(iCustom)缓冲区访问 输入参数: 基本设置:
FREE
DYNAMIC SR TREND CHANNEL Dynamic SR Trend Channel is a simple indicator for trend detection as well as resistance/support levels on the current timeframe. It shows you areas where to expect possible change in trend direction and trend continuation. It works with any trading system (both price action and other trading system that use indicators) and is also very good for renko charting system as well. In an uptrend, the red line (main line) serves as the support and the blue line serves as the r
“可调分形” - 是分形指标的高级版本,非常有用的交易工具! .......................................................................................... - 众所周知,标准分形 MT5 指标根本没有设置 - 这对交易者来说非常不方便。 - 可调分形解决了这个问题 - 它具有所有必要的设置: - 指标的可调周期(建议值 - 高于 7)。 - 价格高点/低点的距离可调。 - 可调分形箭头设计。 - 指标内置移动和 PC 警报。 点击这里查看高质量的交易机器人和指标! 这是仅在此 MQL5 网站上提供的原创产品。 ....................................................
Bos Choch Signal Scanner
Emma-ekong Ben Eshiet
N/B: All our product purchase comes with our free ‘’DAILY   SCALPER EA’’ -   bit.ly/4qlFLNh Whatsapp Developer for yours after successful purchase BOS / CHoCH Signals Scanner Indicator (MT5) See What Smart Money Is Doing — Before the Move Happens Most traders lose because they enter too late, trade against structure, or miss institutional confirmations. The BOS / CHoCH Signals Scanner Indicator was built to solve exactly that. This professional MT5 indicator automatically reads market struc
Caicai L&S Yield Histogram Important Notice: This indicator is an integral tool of the automated EA Caicai Long and Short Pair Trading . This indicator visually displays the percentage deviation (Yield %) of a pair's current spread relative to its own historical mean. It is an excellent tool for quickly visualizing the gross financial potential of a market distortion in Long & Short operations. Main Features: Percentage Visualization: Understand the size of the distortion in palpable percentage
PZ Mean Reversion MT5
PZ TRADING SLU
3 (2)
采用专业和量化方法进行均值回归交易的独特指标。它利用了价格以可预测和可衡量的方式转移并返回均值这一事实,这允许明确的进入和退出规则大大优于非量化交易策略。 [ Installation Guide | Update Guide | Troubleshooting | FAQ | All Products ] 清晰的交易信号 非常容易交易 可定制的颜色和尺寸 实现性能统计 优于大多数交易策略 显示合适的止损和止盈水平 它实现了电子邮件/声音/视觉警报 这个怎么运作 该指标从更高的时间范围测量完全可定制的移动平均线的标准偏差,并使用趋势跟踪方法精确地找到交易。交易是通过深入当前图表的价格行为发现的,并在价格返回到平均价格区间时关闭,根据您选择的更高时间范围计算。由于其编码方式,该指标将远离高波动性和强劲趋势市场,并且仅在可预测的情况下进行交易,在可接受的波动性与方向性比率范围内,回归均值是可行的。 指标剖析 绿线是更高时间范围内的移动平均线(也就是平均值) 虚线区域是移动平均线周围的典型价格区间 蓝线是看涨交易的突破价格 红线是看跌交易的突破价格 交易是针对均值进行的,并在典型的价格
Optimized Spike Detector Pro for MT5 is a professional-grade technical indicator designed to identify and capitalize on sharp, impulsive price movements (spikes) in any financial instrument. Utilizing a sophisticated, multi-algorithmic core, it distinguishes significant volatility expansions from market noise with exceptional accuracy. The tool dynamically adapts to changing market conditions, filtering out false signals and highlighting only high-probability spike setups in real-time. Featuring
NR4 and NR7 indicator
Mattia Impicciatore
描述: NR4 & NR7 Inside Bar Highlighter 是一款自动检测 价格压缩形态 的指标,基于 NR4 或 NR7 与 Inside Bar(内部条形)组合的策略。 NR4(4日最窄区间)表示当前蜡烛图的范围小于过去 4 根蜡烛中的最小范围;NR7 则比较过去 7 根蜡烛。当这种窄幅震荡形态与内部条形(当前蜡烛完全包含在上一根蜡烛内)结合时,通常代表 市场波动率收缩 ,并可能预示即将出现 强烈的突破行情 。这些信号广泛应用于突破交易策略中。 该指标在图表上用不同颜色直观显示信号: NR4 + Inside Bar:白色(可自定义) NR7 + Inside Bar:橙色(可自定义) 每个信号会在图表上自动标注标签。支持与可视化提醒、推送通知及其他交易逻辑集成。兼容所有品种与时间周期。 适合使用突破或波动率扩张策略的交易者,是一款轻量级、实用性强的工具。
FREE
Ultimate Double Top & Bottom (Pro Volume Matrix) Stop trading retail breakouts. Start trading Institutional Traps. The   Ultimate Double Top & Bottom   is not a standard, lagging pattern scanner. It is a highly advanced, non-repainting structural engine equipped with a proprietary   3-Leg Volume Matrix . Designed exclusively for Smart Money Concepts (SMC) and order flow traders, this indicator mathematically dissects the tick volume inside M and W patterns to reveal true institutional intent:  
ToolBox 360 is the swiss knife of all indicators. It is full packed with useful tools to help you with your trading. It can be used to find best entry and exit points and help you to decide if you should open a trade or not. It shows market trends, candlestick formations outside / inside bars and you can sett time based allerts. Main features: Time based Fibonacci lines Choose a start and end time and the indicator shows you Fibonacci lines within the selected time range including range high a
M & W Pattern Pro is an advanced scanner for M and W patters , it uses extra filters to ensure scanned patterns are profitable. The indicator can be used with all symbols and time frames. The indicator is a non repaint indicator with accurate statistics calculations. To use , simply scan the most profitable pair using the statistics dashboard accuracy , then enter trades on signal arrow and exit at the TP and SL levels. STATISTICS : Accuracy 1 : This is the percentage of the times price hits TP
Smart Structure Concepts MT5
Cristhian Alexander Gaibor Cuasquer
5 (1)
这不是又一个画区域却让你猜测的结构指标。 Smart Structure Concepts 为你阅读市场 — 在 XAUUSD(黄金)、外汇、指数、加密货币以及任何其他市场 实时标记 Smart Money Concepts (SMC / ICT) 结构。忘掉进入输入参数来配置每个区域:通过其 图表上的交互式仪表板面板 ,你只需一键即可决定显示、隐藏或调整内容 — 无需打开属性,无需重启指标。 此工具是 MetaTrader 5 不断扩展的指标和面板系列的一部分 — 所有工具都配有 11 种语言的教育性工具提示,并在每个图表中内置可视化导师。 每个工具都在你交易时教你:将鼠标悬停在任何区域、信号或水平上,解释会直接出现在图表上。没有黑匣子,没有盲目下单。你在交易中学习。 在此发现完整产品线: https://www.mql5.com/en/users/09151993a/seller 问题: 手动绘制和标记市场结构是最让交易者疲惫的事,无论是新手还是有经验者。每次切换图表或时间框架,都必须重新开始 — 标记区域、画线、手动识别 BOS 和 CHoCH — 一次误读就可能毁掉一个好的设
Scalping PullBack Signal
Quang Huy Quach
5 (1)
1. Overview The Scalping PullBack Signal indicator is a powerful technical analysis tool designed to help traders identify scalping opportunities based on potential pullback and reversal signals. This tool is particularly useful on lower timeframes (below 15 minutes) but can also be applied on higher timeframes for longer-term trades. This indicator integrates several key analytical components, providing a comprehensive view of trends and potential entry/exit points, helping you make quick and e
FREE
ATR ZoneMaster calculates probability-based ATR levels for any timeframe and displays them as clear support and resistance zones. It is designed for traders who want quick visual levels without clutter . Features: Multiple ATR probability multipliers: 100%, 125%, 150%, 175%, 200% Works on any timeframe (M1 → MN1) Non-repainting, clean labels for easy decision-making Adjustable label shift and colors for chart clarity Minimalistic and intuitive chart design Benefits: Quickly identify potential
BOS CHoCH and FVG
Saksham Solanki
4.5 (4)
Contact me for any queries or custom orders, if you want to use this in an EA. Key Features: Pattern Recognition : Identifies Fair Value Gaps (FVGs) Spots Break of Structure (BOS) points Detects Change of Character (CHoCH) patterns Versatile Application : Optimized for candlestick charts Compatible with any chart type and financial instrument Real-Time and Historical Analysis : Works seamlessly with both real-time and historical data Allows for backtesting strategies and live market analysis Vis
FREE
Rocket Trend
Andriy Sydoruk
The Rocket Trend indicator is trending. The indicator draws two-color points connected by lines along the chart. This is a trend indicator, it is an algorithmic indicator. It is easy to work and understand when a blue circle appears, you need to buy, when a red one appears, sell. The indicator is used for scalping and pipsing, and has proven itself well. Rocket Trend is available for analyzing the direction of the trend for a specific period of time. Ideal for novice traders learning the laws o
N/B: All our product purchase comes with our free ‘’DAILY   SCALPER EA’’ -   bit.ly/4qlFLNh Whatsapp Developer for yours after successful purchase UNLEASH THE SPARTAN-ARROW SPIKE DETECTOR The Ultimate Boom & Crash Trading Weapon That Never Sleeps --- ️ THIS IS NOT JUST AN INDICATOR - IT'S YOUR PERSONAL 300 SPARTAN ARMY SPECIAL BONUS (VALID TILL JUNE 2026)- OUR DAILY SCALPER EA for BTCUSD and VIX75 •·································································•
ROC acceleration-deceleration is the manual system for medium-term scalping. Indicator based on custom ROC system which defines bullish/bearish market and especially  acceleration-deceleration of tendention in the market's main direction. Buy arrow is plotted during bearish market when current trend decelerates and sell  arrow is plotted during bullish market when current trend decelerates. Main Indicator's Features Signals are not repaint,non-late or disappear(exept cases when system recalculat
KT Horizontal Lines MT5
KEENBASE SOFTWARE SOLUTIONS
在MetaTrader中,绘制多个   水平线   并跟踪各自的价格水平可能非常麻烦。该指标可自动在等间距位置绘制多个水平线,用于设置价格提醒、标记支撑和阻力位以及其他手动操作。 这个指标非常适合刚接触外汇交易的新手,帮助他们寻找买卖机会并实现快速获利。无论市场处于趋势中还是震荡状态,水平线都能帮助交易者识别潜在的进出场区域。 功能特点 可根据输入参数中的预设,瞬间绘制多个水平线。 使用鲜明的色彩主题,区分不同的水平线。 是追踪多个交易时段价格区间的必备工具。 当价格触及某条水平线时会自动发出提醒。 可设置提醒之间的间隔,避免重复提醒造成干扰。 支持完全自定义设置。 说明 该指标根据输入参数中的配置自动绘制水平线。观察价格在这些水平线附近的反应,可以帮助识别关键支撑/阻力位附近的潜在交易机会。 例如,在水平支撑位形成一根看涨Pin Bar,通常意味着价格可能会继续上涨,朝最近的阻力位移动。 若价格以一根看跌K线收盘于支撑位下方,则可能表明刚刚发生了一个下行突破。而在水平线上发生的假突破,则说明价格未能突破关键水平,可能即将反转方向。 一些价格反转形态(如Pin Bar或假突破)对于
该产品的买家也购买
Neuro Poseidon MT5
Daria Rezueva
5 (11)
Neuro Poseidon is a new indicator by Daria Rezueva. It combines precise trading signals with adaptive TP/SL levels - creating best possible trades as a result! Message me and get  Neuro Poseidon Assistant  as a gift to automize your trading process! What makes it stand out? 1. Proven profitability on all assets and timeframes 2. Only confirmed BUY and SELL signals present on the chart 3. Adaptive TP & SL levels generated by the software for each trade 4. Easy to understand - suitable for al
SuperScalp Pro
Van Minh Nguyen
4.65 (26)
SuperScalp Pro – 高级多重过滤剥头皮指标系统 SuperScalp Pro 是一款高级剥头皮交易指标,将经典 Supertrend 与多种智能确认过滤器结合,帮助识别交易机会。它可高效运行于 M1 至 H4 多个时间周期,并针对 XAUUSD、BTCUSD 及主要外汇货币对进行了优化。 该指标提供清晰的 Buy 和 Sell 信号,并基于 ATR 自动计算入场价、止损和止盈水平,帮助交易者更有效地管理风险。Fibonacci Take Profit 功能可在关键价格水平提前平仓,并在到达这些水平时发送通知,从而提升交易管理效率与稳定性。 默认配置已启用 Fibonacci Take Profit,专注于更稳定、更持续的交易体验。您只需将指标加载到图表即可立即开始使用,无需额外设置。对于高级用户,所有参数均可完全自定义,以适应不同交易策略和偏好。 完整使用文档可在产品博客查看: [User Guide] 支持通过 SuperScalp Pro Auto Trader EA 进行自动交易: [Auto Trader] SuperScalp Pro 集成了 EMA、RSI
Entry In The Zone and SMC Multi Timeframe is a real-time 2-in-1 market analysis tool that combines market structure analysis and a No Repaint BUY / SELL signal system into a single indicator, built on Smart Money Concepts (SMC) — a widely adopted framework used by professional traders to understand market structure. This indicator helps you see the market more clearly, make decisions based on structure rather than guesswork, and focus on high-probability zones where price is more likely to react
SMC Intraday Formula
Kareem Abbas
5 (12)
让我们先坦诚一点。 没有任何一个指标可以单独让你实现盈利。如果有人告诉你可以,那他是在向你兜售一个梦想。任何显示完美买卖箭头的指标都可以被做得看起来毫无瑕疵——只需要放大历史中的某一段并截取成功交易的截图。我们不会这样做。 SMC Intraday Formula 是一个工具。 它为你读取市场结构,标记出概率最高的价格区域,并用简单直白的语言准确告诉你当前智能资金的行为轨迹。你仍然需要做决定。你仍然需要执行交易。但现在,你是带着精确性执行,而不是靠希望。 我们已经在黄金(XAUUSD)以及主要外汇货币对的日内剥头皮交易中使用该指标将近三年。这是我们在 M1、M5、M15 和 M30 上的日常主力工具。它之所以有效,是因为它不试图预测未来——它展示的是当前正在形成的高概率交易机会,并解释 为什么 。 它与其他所有指标有什么不同? 大多数交易指标只做一件事。移动平均线交叉。振荡指标触及某个水平。出现一个箭头。你进场交易。你亏损。你责怪指标。重复。 SMC Intraday Formula 将多个机构级概念整合为一个统一的市场解读: - 斐波那契共振引擎 不只是普通的斐波那契水平——该指标
Divergence Bomber
Ihor Otkydach
4.9 (89)
购买该指标的每位用户将额外免费获得以下内容: 原创工具“Bomber Utility”,该工具会自动跟踪每一笔交易,设置止损和止盈点,并根据策略规则自动平仓; 适用于不同交易品种的指标设置文件(Set 文件); 三种不同风险模式下的 Bomber Utility 设置文件:“最低风险”、“平衡风险” 和 “观望策略”; 一套详细的 视频操作手册,帮助您快速完成安装、配置并开始使用本交易系统。 注意: 要获取以上所有赠品,请通过 MQL5 的私人消息系统联系卖家。 我为您介绍原创的自定义指标 “Divergence Bomber”(背离轰炸机),它是一套基于 MACD 背离交易策略 的“全功能”交易系统。 该技术指标的主要任务是识别 价格与 MACD 指标之间的背离,并发出交易信号(包括推送通知),指示未来价格可能的运动方向。平均而言,这些信号的准确率超过 98%。有关该指标如何工作的详细说明,请观看本页面上的视频演示。 该系统使用 止损订单 和 动态回撤平仓机制 来管理交易。 Divergence Bomber 指标的主要特点: 支持交易的品种: AUDCAD、AUDCHF、AUDSG
Power Candles MT5
Daniel Stein
5 (8)
Power Candles V3 - 自我优化的强度指标 Power Candles V3 把货币与品种的强度直接转化为图表上可执行的交易方案。指标不再仅根据强度给K线着色,而是在后台持续运行实时自动优化,为您正面对的品种给出最佳 Stop Loss、Take Profit 与信号阈值。一键采用,Entry、Stop Loss、Take Profit 线就以精确价格绘制在图表上,提醒消息中直接包含方向。 本工具是 Stein Investments 生态系统的一部分 - 18+ 款工具,加上 Max,您的一对一 AI 交易导师。  随时在线,深入了解每一款指标,在您需要梳理思路的那一刻就在那里。  立即认识他: https://stein.investments 每根收盘K线运行 3,000+ 次交易模拟。9 种强度状态。2 种策略并行测试。一键采用最优配置。 为什么需要这个 大多数强度指标只给您一个数值,然后留下三个问题:相信哪个阈值、用哪个 Stop Loss、走哪个交易方向。Power Candles V3 在每根收盘K线上自动回答这些问题。结果就是一个完整的交易方案 -
SmartScalping
Temirlan Kdyrkhan
SmartScalping is a powerful trading companion designed to generate high-probability entry signals with dynamic TP/SL/DP levels based on volatility. Built-in performance tracking shows win/loss stats, PP1/PP2 hits, and success rates — all updated live. Key Features: Buy/Sell signals with adaptive volatility bands Real-time TP/SL/DP levels based on ATR Built-in MA Filter with optional ATR/StdDev volatility Performance stats panel (Success, Profit/Loss, PP1/PP2) Alerts via popup, sound, push, or e
Azimuth Pro
Ottaviano De Cicco
5 (7)
Azimuth Pro V2:MT5合成分形结构分析与确认入场 概述 Azimuth Pro 是 Merkava Labs 推出的多层级波段结构指标。四层嵌套波段层级、锚定波段的VWAP、ABC形态识别、三时间框架结构过滤以及收盘确认入场——一个图表,一个从微观波段到宏观周期的完整工作流程。 这不是盲目的信号产品。它是一个以结构为先的工作流程,专为重视位置、背景和时机的交易者打造。 V2上市优惠 — Azimuth Pro V2售价USD 399(接下来的100份)。最终价格:USD 499。 1. V2的变化 合成多时间框架引擎 高时间框架分析从零开始重建,采用与Meridian Pro相同的专有合成架构。更清晰的HTF背景、稳定的实时行为、无经典MTF同步问题。合成引擎还解锁了 固定比率时间框架级联 (x2、x3、x4、x6)——不再在经纪商的固定时间框架之间任意跳转,您可以按图表时间框架的固定倍数分析结构,在每个尺度上保持相同的分形关系。 确认入场箭头 作为稳定且可恢复的执行层而设计的收盘确认箭头。当ABC设置形成且自适应确认逻辑在收盘K线上验证方向时,箭头会写入下一根K线的
TrendProMaster
Temirlan Kdyrkhan
MasterTrend Indicator for MT5 A powerful trend-following and signal-evaluation tool MasterTrend   is a custom MT5 indicator that combines Moving Averages and ATR-based risk/reward logic to generate clear buy/sell signals. It visualizes dynamic SL/TP levels, evaluates past trade outcomes, and displays win/loss statistics in a clean on-chart panel. Key features include: Buy/Sell signals based on MA crossovers ATR-based SL/TP1/TP2/TP3 levels with visual lines and labels Signal outcome tracking wit
介绍     Quantum Breakout PRO   ,突破性的 MQL5 指标,正在改变您交易突破区域的方式!由拥有超过13年交易经验的资深交易员团队开发,     量子突破 PRO     旨在通过其创新和动态的突破区域策略将您的交易之旅推向新的高度。 量子突破指标将为您提供带有 5 个利润目标区域的突破区域的信号箭头,以及基于突破框的止损建议。 它既适合新手交易者,也适合专业交易者。 量子 EA 通道:       点击这里 重要的!购买后请私信我领取安装手册。 建议: 时间范围:M15 货币对:GBPJPY、EURJPY、USDJPY、NZDUSD、XAUUSD 账户类型:ECN、Raw 或 Razor,点差极低 经纪商时间:GMT +3 经纪商:IC Markets、Pepperstone with Raw 和 Razor 的点差最低 规格: 不重漆! 最多 5 个建议利润目标区域 建议止损水平 可定制的盒子。您可以设置自己的 Box Time Start 和 Box Time End。 接触 如果您有任何疑问或需要帮助,请通过私人消息与我联系。
Atomic Analyst MT5
Issam Kassas
4.19 (32)
本产品已针对 2026 年市场进行更新,并针对最新 MT5 版本进行了优化。 价格更新通知: Atomic Analyst 目前价格为 $99 。 接下来的 30 次购买 后,价格将上涨至 $199 。 特别优惠: 购买 Atomic Analyst 后,请发送私信给我,即可免费领取 Smart Universal EA ,并将您的 Atomic Analyst 信号转换为自动交易。 Atomic Analyst 是一款不重绘、不回绘、不延迟的 Price Action 交易指标,专为手动交易、清晰信号和 EA 自动化而设计。 User manual: settings, inputs and strategy. 它分析价格行为、强度、动能、多周期方向和高级过滤器,帮助交易者减少噪音,避免弱势交易机会,并做出更有结构的交易决策。 该指标将复杂的市场计算转换为简单的视觉信号、彩色K线、趋势读数、止损水平和多个止盈区域,使交易者能够快速理解并应用于真实市场环境。 主要交易用途: 剥头皮和日内交易: 专为快速决策、清晰箭头、提醒、K线颜色和结构化进出场区域而设计。 日内交易和波段交易:
本产品已针对 2026 年市场进行更新,并针对最新 MT5 版本进行了优化。 价格更新通知: Smart Trend Trading System 目前价格为 $99 。 接下来的 30 次购买 后,价格将上涨至 $199 。 特别优惠: 购买 Smart Trend Trading System 后,请发送私信给我,即可免费领取 Smart Universal EA ,并将您的 Smart Trend 信号转换为自动交易。 Smart Trend Trading System 是一套完整的交易系统,具备不重绘、不回绘、不延迟的特点,专为希望获得更清晰信号、更准确趋势方向以及更有组织交易方式的交易者打造。 Online course , manual and download presets . 它将 10 多种交易工具 整合到一个系统中,包括趋势检测、反转区域、Smart Cloud、移动止损逻辑、支撑与阻力、K线着色、提醒以及多周期分析。 该系统旨在帮助您应对不同的市场环境: 趋势市场: 识别主要趋势,发现回调,跟随动能,并通过止损指导和移动止损选项寻找更清晰的入场机会。 震荡
SignalTech MT5
Yue Wang
5 (26)
SignalTech MT5 is an unique fully rule based trading system for EURUSD, USDCHF, USDJPY, AUDUSD, NZDUSD, EURJPY, AUDJPY, NZDJPY, CADJPY.  All the winning trades with chart setups are published on the comments page. 2026-05 3690 Pips (Until 05-26 NY Closed) 2026-04 2243 Pips 2026-03 2165 Pips 2026-02 2937 Pips 2026-01 2624 Pips 2025-12 1174 Pips It can generate signals with Buy/Sell Arrows and Pop-Up/Sound Alerts. Each signal has clear Entry and Stop Loss levels, which should be automatically flag
Gann Made Easy MT5
Oleg Rodin
5 (4)
Gann Made Easy   是一个专业且易于使用的外汇交易系统,它基于使用先生理论的最佳交易原则。 W.D.江恩。该指标提供准确的买入和卖出信号,包括止损和获利水平。您甚至可以使用推送通知在旅途中进行交易。 购买后请联系我,即可免费获得交易指导和超棒的额外指标! 您可能已经多次听说过江恩交易方法。通常 Gann 的理论不仅对于新手交易者而且对于那些已经有一定交易经验的人来说都是非常复杂的东西。这是因为江恩的交易方法在理论上并不那么容易应用。我花了几年时间来完善这些知识,并将最好的原则应用到我的外汇指标中。 该指标非常易于应用。您所需要的只是将其附加到您的图表并遵循简单的交易建议。该指标不断进行市场分析工作并寻找交易机会。当它检测到一个好的入口点时,它会为您提供一个箭头信号。该指标还显示止损和获利水平。 换句话说,当您像先生一样进行交易时,该指标会为您提供最佳江恩建议。江恩亲自告诉你此时此刻该做什么。但最好的部分是您不需要了解任何有关江恩交易原则的知识,因为该指标会为您完成整个市场分析工作。
FX Trend MT5 NG
Daniel Stein
5 (6)
FX Trend NG:新一代多市场趋势智能分析工具 概述 FX Trend NG 是一款专业的多时间周期趋势分析与市场监控工具,帮助您在几秒钟内全面了解市场结构。 无需在多个图表之间来回切换,您可以立即看到哪些品种处于趋势中、哪里动能正在减弱,以及哪些时间周期之间存在强烈共振。 限时发布优惠 – 仅需 $30(6个月) 或 $80 终身授权 即可拥有 FX Trend NG 。 已经是 Stein Investments 客户? -> 发送消息 以获取专属客户群访问权限。 需要帮助或安装指导? -> 请访问 Stein Investments 官方页面 。 1. FX Trend NG 的核心优势 三状态趋势逻辑 —— 不只是 Buy 或 Sell • 大多数指标仅显示两种状态:Buy 或 Sell。 • FX Trend NG 增加第三种状态: Fade 。 • Fade 表示趋势强度正在减弱,在完全反转之前提前发出信号。 这种结构化逻辑让您看到趋势变化过程,而不仅仅是简单方向信号。 多时间周期分析(M1 至 MN1) • 从短线交易到中长线交易全面覆盖。 • 快速识别趋势
ARIPoint
Temirlan Kdyrkhan
1 (1)
ARIPoint is a powerful trading companion designed to generate high-probability entry signals with dynamic TP/SL/DP levels based on volatility. Built-in performance tracking shows win/loss stats, PP1/PP2 hits, and success rates all updated live. Key Features: Buy/Sell signals with adaptive volatility bands Real-time TP/SL/DP levels based on ATR Built-in MA Filter with optional ATR/StdDev volatility Performance stats panel (Success, Profit/Loss, PP1/PP2) Alerts via popup, sound, push, or email Cu
Trend Catcher ind mt5
Ramil Minniakhmetov
5 (4)
趨勢捕捉指標 趨勢捕捉指標結合了作者獨有的客製化自適應趨勢分析指標,用於分析市場價格趨勢。它透過過濾掉短期噪音,並專注於潛在的動能強度、波動性擴張和價格結構行為,來識別真實的市場方向。此外,它還結合了平滑和趨勢過濾等客製化指標,例如移動平均線、相對強弱指標 (RSI) 和波動率過濾器。 您可以在這裡查看實際運行情況以及我的其他產品: https://www.mql5.com/en/users/mechanic/seller 請注意,我不會在 Telegram 上出售 EA 或任何設置,那是騙局。所有設定都可以在我的部落格上免費取得。 重要提示!購買後請立即聯繫我,以獲取使用說明和額外獎勵! 請注意,我不會在 Telegram 上出售 EA 或任何設置,那是騙局。所有設定都可以在我的部落格上免費取得。
Reversion King Indicator
Eugen-alexandru Zibileanu
5 (3)
全新王者降临 - 指标 + 订单管理提示(TP1 + TP2 + TP3)+ 可选 Telegram 信号发送器 INCLUDED(免费) (完整交易与信号系统) 我们最强的黄金 EA: Gold Slayer 该指标包含先进的交易策略、可自定义订单管理系统,以及结合 Envelope 扩展的均值回归系统,并通过 RSI 等多重智能确认过滤器进行验证,以捕捉高概率反转入场机会,提供 BUY 与 SELL 信号。 你不仅能够学习如何交易,还能学会如何高效管理多个仓位,并利用之前盈利的持仓来覆盖亏损交易。 专为 M5 周期打造并优化,在 BTCUSD 和 XAUUSD 上表现尤为出色,因为这些市场的流动性能够让信号更加干净、可靠。 该指标会自动生成清晰的多头(Long)与空头(Short)信号,同时基于 ATR 自动计算入场位、止损位和止盈位,让风险管理从一开始就融入系统之中。 多 TP 系统设有三个渐进式目标位,你可以在 TP1 锁定部分利润、在 TP2 继续持仓,并在更大的行情中将仓位持有至 TP3,而这正是平均风险回报比真正开始大放异彩的地方。 默认参数开箱即用,已经针对稳定表现进行
Crystal Heikin Ashi Signals
Muhammad Jawad Shabir
5 (2)
Crystal Heikin Ashi Signals - Professional Trend & Signal Detection Indicator Advanced Heikin Ashi Visualization with Intelligent Signal System for Manual & Automated Trading Final Price: $149 ---------> Price goes up $10 after every 10 sales . Limited slots available — act fast . Overview Crystal Heikin Ashi Signals is a professional-grade MetaTrader 5 indicator that combines pure Heikin Ashi candle visualization with an advanced momentum-shift detection system. Designed for both manual traders
Quantum TrendPulse
Bogdan Ion Puscasu
5 (25)
介绍 Quantum TrendPulse   ,这是一款终极交易工具,它将 SuperTrend   、   RSI 和 Stochastic 的强大功能整合到一个综合指标中,以最大限度地发挥您的交易潜力。该指标专为追求精准和效率的交易者而设计,可帮助您自信地识别市场趋势、动量变化以及最佳进入和退出点。 主要特点: 超级趋势整合: 轻松跟随当前的市场趋势并乘上盈利浪潮。 RSI 精度: 检测超买和超卖水平,非常适合把握市场逆转时机,可用作 SuperTrend 的过滤器 随机精度: 利用随机振荡在波动的市场中寻找隐藏的机会, 用作超级趋势的过滤器 多时间范围分析: 从 M5 到 H1 或 H4,在不同时间范围内关注市场动态。 可定制的警报: 当您的自定义交易条件得到满足时收到通知,这样您就不会错过任何交易。 无论您是新手还是经验丰富的交易员,   Quantum TrendPulse 都能为您提供所需的优势,帮助您增强策略并自信地进行交易。借助这一强大的指标,将洞察力转化为利润 — 掌控您的交易! ***购买 Quantum TrendPulse,即可免费获得 Quantum Tr
Market Structure Order Block Dashboard MT5 是一款专为希望直接在图表上解读市场结构和主要价格反应区域的交易者设计的MT5指标。它结合了BOS、ChoCH、订单块(Order Blocks)、公允价值缺口(FVG)、流动性、Kill Zones、成交量分布图以及一个紧凑的面板,便于快速分析。 本指标面向使用市场结构、ICT和Smart Money概念作为决策框架的交易者。它可以帮助以更结构化的方式识别趋势延续、可能的反转、价格失衡、流动性目标和关注区域。 面向买家的资源 购买后可通过MQL5私信申请获取完整的PDF使用指南和参数配置建议。通过MQL5私信提供直接技术支持。 1.20版本带来两项重要新增: Pending BOS / Pending ChoCH 检测 和 可拖动面板 (按住面板标题栏即可将其拖动到图表任意位置,不影响图表本身)。当K线收于前一摆动点之外时,Pending Breaks 立即显示待确认的结构突破,无需等待经典的摆动确认。 重要 本产品仅为指标。它不会自动开仓、平仓或管理仓位。它不是EA(智能交易系统)。 主要功能 市场
M30/H1/H4 波段版已上线 想抓住M5/M15无法捕捉的大行情? Gold Signal Swing Pro(M30/H1/H4)现已发售。 目标每笔$20-$80+。 https://www.mql5.com/en/market/product/177643 KURAMA GOLD SIGNAL PRO(MT5版)— 7层过滤器 XAUUSD完整交易系统 不重绘。不重画。不延迟。每个信号确认后永久固定。 买断版购买者专属福利:购买买断版许可证可免费获得 AI Zone Radar(价值$59)+ PDF使用手册。购买后请在MQL5上给我发消息。 AI Zone Radar: https://www.mql5.com/en/market/product/175834 在真实黄金交易员社区中使用,因精度和易用性获得高度评价。 你的问题 — 以及解决方案 黄金每天波动$30-$50。你知道机会就在那里。但你是否经历过: - 入场过早,价格反向运行$10后才朝你预期的方向走 - 每
PZ Swing Trading MT5
PZ TRADING SLU
5 (5)
Swing Trading 是第一个旨在检测趋势方向的波动和可能的反转波动的指标。它使用在交易文献中广泛描述的基准摆动交易方法。该指标研究多个价格和时间向量,以追踪总体趋势方向,并检测市场超卖或超买并准备好进行修正的情况。 [ 安装指南 | 更新指南 | 故障排除 | 常见问题 | 所有产品 ] 市场波动的利润不会被窃取 指示器始终显示趋势方向 彩色价格带代表机会基准 彩色虚线表示可能的反转波动 该指标分析其自身的质量和性能 它实现了一个多时间仪表板 可定制的趋势和波动周期 它实现了电子邮件/声音/推送警报 指示器为非重涂或重涂 什么是摇摆交易 摇摆交易是一种尝试在一天到一周内从证券中获得收益的交易方式,尽管某些交易最终可以保持更长的寿命。摇摆交易者使用技术分析来买入弱点和卖出力量,并有耐心等待这些机会的发生,因为在发生一波抛售浪潮之后购买证券而不是陷入抛售更有意义。 机会基准 关于历史数据的大量研究证明,适合于波动交易的市场倾向于在基线价格带上下交易,基线价格带由图表显示,使用平均真实区间计算得出。波动交易者使用基线,该策略是购买常态和卖出躁狂,或做空常态并掩盖沮丧。在没有疲
Trend Screener Pro MT5
STE S.S.COMPANY
4.85 (104)
使用趋势筛选指标释放趋势交易的力量:由模糊逻辑和多货币系统提供支持的终极趋势交易解决方案! 使用趋势筛选器(由模糊逻辑提供支持的革命性趋势指标)提升您的趋势交易。 它是一个强大的趋势跟踪指标,结合了超过 13 种高级工具和功能以及 3 种交易策略,使其成为使您的 Metatrader 成为趋势分析器的多功能选择。 限时优惠:趋势筛选指标终身仅需 65  美元。 ( 原价 250$ ) (优惠延长) 体验趋势筛选器 100% 无需重新绘制的准确性,确保您的交易决策不受过去价格变化的影响。 释放多时间框架和多货币功能的多功能性,使您能够以无与伦比的信心在外汇、商品、加密货币和指数领域进行交易。 利用 Trend Screener 的综合策略套件增强您的交易: - 趋势跟踪策略和趋势延续策略 :趋势筛选器的趋势跟踪策略提供清晰的趋势延续信号,让您有效捕捉趋势走势并管理风险。 - 反转策略和早期入场点策略 :趋势筛选器的反转策略可检测市场方向的潜在变化,使您能够预测趋势反转并利用疲弱的市场趋势。通过早期入场点,您可以在潜在的趋势变化之前定位自己 获取可观的利润。 - 倒卖策略: 趋势筛选器的倒
Trend Forecaster
Alexey Minkov
5 (7)
Trend Forecaster – Since 2023. The Trend Forecaster indicator utilizes a unique proprietary algorithm to determine entry points for a breakout trading strategy. The indicator identifies price clusters, analyzes price movement near levels, and provides a signal when the price breaks through a level. The Trend Forecaster indicator is suitable for all financial assets, including currencies (Forex), metals, stocks, indices, and cryptocurrencies. You can also adjust the indicator to work on any time
本产品已针对 2026 年市场进行更新,并针对最新 MT5 版本进行了优化。 价格更新通知: Smart Price Action Concepts 目前价格为 $200 。 接下来的 30 次购买 后,价格将上涨至 $299 。 特别优惠: 购买后,请发送私信给我,即可领取 免费赠品 + 礼物 。 首先需要强调的是,这款交易工具是不重绘、不回绘、不延迟的指标,因此非常适合专业交易使用。 Online course , and manual Smart Price Action Concepts 指标是一款非常强大的工具,适合新手和有经验的交易者使用。它将 20 多个实用指标整合到一个系统中,结合了 Inner Circle Trader Analysis 和 Smart Money Concepts Trading Strategies 等高级交易理念。该指标专注于 Smart Money Concepts,帮助交易者理解大型机构如何交易,并辅助预测其市场行为。 它特别擅长流动性分析,使交易者更容易理解机构交易逻辑。它也非常适合预测市场趋势并仔细分析价格走势。通过让交易与机构策略保
Meridian Pro
Ottaviano De Cicco
5 (2)
Meridian Pro 2.00:MT5 专业多周期趋势矩阵 Meridian Pro 2.00 是面向 MetaTrader 5 的专业自适应趋势矩阵。它结合了原始 Meridian 趋势引擎、清晰的图表 ribbon、收盘柱确认箭头、8 周期 dashboard、Fuel 动量、加权共识、合成 HTF 处理,以及直接显示在当前图表上的高周期环境线。 目标很简单:在一个有纪律的 workflow 中读取当前趋势、多周期结构、强度、动量和 EA-ready 状态,而不是在多个图表上堆叠互不关联的指标。 Meridian Pro 的不同之处 一个自适应引擎 - 同一套波动率感知 Meridian 逻辑应用于 M1 到 W1。 合成 HTF 架构 - 高周期行由低周期数据推导,减少传统零售 MTF 中常见的 repaint、同步延迟和 broker-dependent HTF 质量问题。 完整矩阵输出 - Bias、Strength、Fuel 和加权 Consensus 一起显示,而不是拆成独立工具。 图表执行层 - ribbon 和箭头专注于当前周期,选配 HTF 线在同一图表上增加高
FX Power MT5 NG
Daniel Stein
5 (32)
FX Power:分析货币强度,助您做出更明智的交易决策 概述 FX Power 是一款专业工具,帮助您全面了解主要货币和黄金在任何市场条件下的真实强度。通过识别强势货币用于买入,弱势货币用于卖出, FX Power 简化了交易决策,并帮助您发现高概率的交易机会。不论您是想跟随趋势还是通过极端的 Delta 值预测反转,这款工具都能完美适应您的交易风格。别再盲目交易——用 FX Power 让您的交易更加智慧。 1. 为什么 FX Power 对交易者极具价值 实时货币和黄金强度分析 • FX Power 实时计算并显示主要货币和黄金的相对强度,助您全面了解市场动态。 • 监控领先或落后资产,轻松识别值得交易的货币对。 全面的多时间框架视图 • 跟踪短期、中期和长期时间框架的货币和黄金强度,以便将您的交易策略与市场趋势保持一致。 • 无论是快进快出的短线交易还是更长期的投资策略, FX Power 都能为您提供所需的信息。 Delta 动态分析用于趋势和反转 • 极端 Delta 值常常预示反转机会,而平缓的 Delta 变化则确认趋势延续。 • 使用 Delta 分析,轻
Btmm state engine pro
Garry James Goodchild
5 (5)
BTMM State Engine Pro is a MetaTrader 5 indicator for traders who use the Beat The Market Maker approach: Asian session context, kill zone timing, level progression, peak formation detection, and a multi-pair scanner from a single chart. It combines cycle state logic with a built-in scanner dashboard so you do not need the same tool on many charts at once. What it does Draws the Asian session range; session times can follow broker server offset or be set in inputs. Tracks level progression (L
PZ Trend Trading MT5
PZ TRADING SLU
3.8 (5)
许多盈利交易者不仅知道如何识别市场趋势,而且也能把握趋势建立后的交易机会。 Pz 趋势交易 指标设计用来在趋势行情中尽可能的赚取利润。 已建立的趋势提供了一揽子交易机会,但大多数趋势交易指标完全忽视了它们,让交易者在趋势行情时完全不知道该如何做!一般趋势指标只通知有关的趋势变化,但根本不足以得到卓越的回报. Pz 趋势交易 指标比一般趋势指标显示多达 20 倍的交易 , 因为它注重所谓的市场时机。它不仅显示当前的市场趋势,也有回调,内柱线的突破和调整。它令您在趋势回调之后介入,安全的柱线内突破金字塔加仓,以及发现潜在的反转,和已知的调整。 趋势改变 一个趋势改变在市场方向变化时发生。趋势变化在图表上用带数字的彩色圆圈显示。蓝色 (1) 信号为上涨开始, 而红色 (1) 信号为下跌开始。趋势变化并非评估当前价格动作的结果, 它意味着交易设置是不定时地。如果您正确使用本指标, 在趋势变化时, 您将将已经入场 (参看下面的调整)。 回调 但凡趋势在运动中,行情上下抖动,盈利者收割利润,且其它参与者入场。趋势回调代表好的买入机会,通常是由主力获利离场导致。如果行情在回调后回归上行, 指标将
作者的更多信息
Daily Open Line
Attila Radulovic
3.88 (8)
The indicator draws the daily open line. Parameters GMT shift (minutes) The time zone could be shifted. The value is given in minutes. Draw closest regular bar's open price This parameter could fine-tune the open price line when using GMT shift. Yes - Draw the open line based on the current chart period's closest regular bar No - Draw the open line based on the M1 chart's closest bar.  Let's assume that your shift is 10 minutes, and you are using H1 chart and the first candle in every day is 0
FREE
CloseLines
Attila Radulovic
The indicator draws lines (with line objects) to the close prices of the last closed bars, on selected timeframes. Parameters Close line 1 close price timeframe - timeframe of the 1st close price Close line 1 color - color of the 1st close price Close line 1 width - width of the 1st close price Close line 1 style - style of the 1st close price Close line 1 max count - the maximum number of lines plotted for the 1st close price, considering the selected timeframe in Close line 1 timeframe paramet
筛选:
seatrips
23
seatrips 2023.10.14 12:44 
 

用户没有留下任何评级信息

zia afzal
246
zia afzal 2023.04.27 22:42 
 

用户没有留下任何评级信息

Attila Radulovic
4458
来自开发人员的回复 Attila Radulovic 2023.04.29 17:32
Hello Zia, thanks for the review and the bug report. I fixed that, please upgrade your version. ;) Thank you for the suggestions, maybe in the future I'll implement them.
krisnara123
2190
krisnara123 2021.11.30 14:23 
 

Very useful product that helps draw shorter horizontal rays .The options allow to choose the opening or close or high or low prices to project the lines from.Its very user friendly.I requested Attila to add a feature to display the label detail which he implemented successfully.Highly recommended this product for support and resistance traders.

回复评论