• Información general
  • Comentarios
  • Discusión (2)
  • Novedades

TheStrat Levels

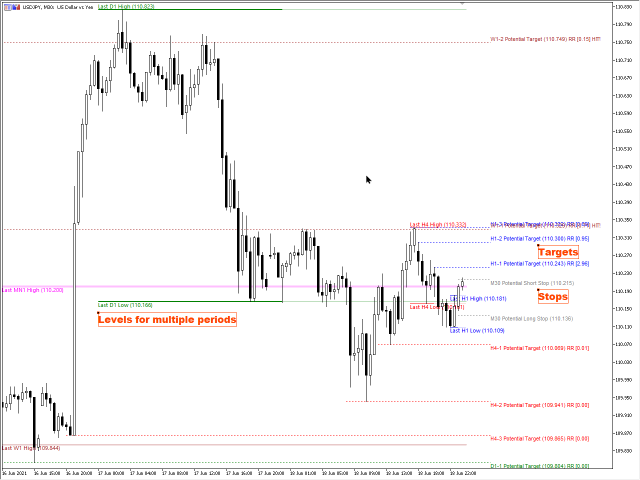
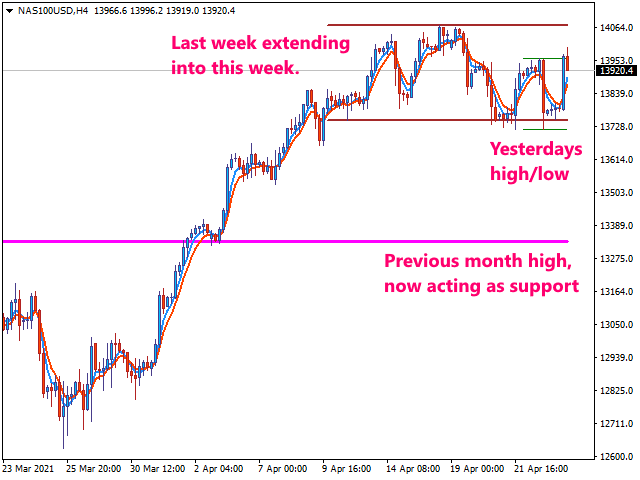
This indicator draws the prior Highs and Lows for multiple timeframes, and can display potential Take Profit and Stop Loss levels.

In Rob Smith's #The Strat terms, these are potential entry points, or alternatively potential targets for open positions. I like to use them in both ways. On a lower timeframe, say 5 minutes to get a good entry on a daily or weekly level, and then as a potential target. Very small stops required giving an excellent risk/reward ratio.

Please watch the DEMO video for more details as the pictures do not do the indicator justice.


Settings

There are a number of settings, repeated for each timeframe.

ShowLevels

When true, the levels are drawn for this timeframe. The lines are drawn from the last period start to the current time. Once a new period is started, the lines will be redrawn to the new levels.

LineColour

You can set the line colour to any value from the standard colour selection.

LineStyle

The line style can vary from the simple solid line, dots, dashes or dots and dashes.

LineWidth

If the line style is solid, the line width can be any value from the selection available, 1 to 5.


UseSplitExtension

When set to True, the lines drawn are split into the historic part drawn using the line styles, width and colours above, and the projected part using a modified style based on the following settings.

SplitLineStyle

If you wish you can set the line style so it is clearly visibly different to the historic part of the line. If you set it to STYLE_SOLID, then the projected line will retain the width set above.

SplitLineTint

You can modify the colour of the projected line by giving it a tint. That is a reduction in intensity of the main colour selected for the historic line set above. The default value here is 0.5 which means halve the intensity of the colour.


Stop and Target Levels

ShowPotentialTargets

When true, potential target levels are shown for each timeframe enabled using the ShowLevels settings.

ShowHitTargets

When true, if a target level has been hit it will stay on the chart until the timeframe has expired. Otherwise, once hit, potential target levels are removed.

LookbackBarsForTargets

Controls how far back in the history the system should look for target levels. Default is 50 bars.

PotentialTargetCount

This allows you to choose how many potential target levels you want to see per timeframe. Default is 3.

MinPointsBetweenTargets

Having targets too close together is not very helpful, so this setting allows you to define how many points should be between one target and the next. Calculated per timeframe.

TimeframeForPotentialStopLevels

Allows you to choose the timeframe stop loss levels should be calculated from. By default it uses the current timeframe, giving a very tight stop loss.


Descriptive Labels

ShowDescriptions

When true, descriptive labels are drawn for every level shown.

IncludePriceInDescription

When true, puts the price value of the level in the description.

IncludeRiskRewardInDescription

When true, adds the risk / reward value in the description.

DescriptionFontSize

Choose how big the descriptive labels should be.

StopLabelsToRight

When true, the labels for stop levels are drawn to the right of the stop level. Set to false, the description will be drawn to the left of the level.

TargetLabelsToRight

When true, the labels for target levels are drawn to the right of the stop level. Set to false, the description will be drawn to the left of the level.

RightSideOffsetPixels

Allows you to choose how far from the current time the stop and target labels should be drawn. Only relevant if you use StopLabelsToRight or TargetLabelsToRight.


ExtendLines

By default, this is false. When True, the lines are extended off to the right hand side of the chart.


Productos recomendados
OFFER!   OFFER ! After 3 weeks the unlimited price will be 500$ and in the future you will regret why you didn't make a purchase at this lowest price. Dear Traders, the atomic power Entries Indicator is one of the indicators that if used wisely and correctly can help you to find an edge over the market.  The indicator will work for all forex pairs, all markets and all timeframes. Still it is your duty to find the most effective timeframe for you. When the sell or buy arrow appears you will get a
The indicator scans for stop grabber (special pattern of Joe Dinapoli which gives very high probability buy / sell signals and does not repaint ) signals in multiple timeframes for the all markets filtered and shows the results on Dashboard. Key Features Dashboard can be used for all markets It can scan for stop grabber pattern on MN1, W1, D1, H4, H1, M30, M15 ,M5, M1 timeframes Parameters UseMarketWatch: Set true to copy all symbols available in market watch MarketWatchCount : Set the numbe
Magic Oscilator
REIVER YOHAN MOLINA
Oscilador basado en convergencias de datos entre el volumen y la liquidez. Se recomienda utilizarlo en pares con alto volumen y liquidez de intercambio, como el EURUSD. Preferiblemente, en TF 4H o superiores. Modo de uso:   Cuando las líneas convergen y se cruzan en SOBRECOMPRA, se recomienda vender. Cuando las líneas convergen y se cruzan en SOBREVENTA, se recomienda comprar.   Cualquier consulta, no dudes contactar conmigo por el chat para solución de dudas. Si consideras que es fake, o siente
FiboZag
Andriy Sydoruk
Indicator FiboZag - transfer the indicator to the chart and the Fibonacci levels will be built automatically on the last ZigZag turn. The main advantage lies in the correct construction of Fibonacci levels and markup of price levels. Simple, visual and effective use. The indicator is not redrawn and does not lag. Works on all currency pairs and on all timeframes.
PVSRA method MT4
Vladimir Gribachev
Método de comercio PVSRA. El sistema se basa en calcular la dirección de las posiciones de los grandes jugadores, en las que ganan posiciones. PVSRA es una abreviatura: P - Precio (Precio), V - Volumen (Volumen), S - Soporte (Soporte), R - Resistencia (Resistencia), A - Análisis (Análisis). El método PVSRA utiliza niveles de precios redondos (p. ej., 1,2000) y niveles intermedios (p. ej., 1,2250, 1,2750). La consolidación por debajo del nivel redondo es preparación para posiciones largas, l
MA Speedometer
Davit Beridze
4.71 (14)
Non standard attitude to the standard moving average indicator. The essence of the indicator is to determine the strength and speed of the price direction by determining the tilt angle of the moving average. A point is taken on the fifteenth MA candle and a point on the last closed MA candle, a straight line is drawn between them, it is movable and on a hemisphere shows an angle of inclination from 90 degrees to -90. above 30 degrees is the buying area, below -30 degrees is the selling area. abo
ZhiBiJuJi MT4
Qiuyang Zheng
4 (2)
El sistema de análisis de indicadores ZhiBiJuJi utiliza un poderoso bucle interno para llamar a sus propios indicadores externos, y luego llama al análisis antes y después del ciclo. El cálculo de los datos de este sistema de análisis de indicadores es muy complicado (llamar antes y después del ciclo), por lo que se reduce la histéresis de la señal y se logra la precisión de la predicción de avance. Este indicador se puede utilizar en todos los ciclos en MT4, y es más adecuado para 15 minutos, 3
Hot Option
Dmitriy Kashevich
Great indicator for binary options! Try what he can do! Alert is arranged in it so that you are not late with the signal! You can also customize the periods that suit you! (it is configured for currency pairs) If you want more, you can always reconfigure and use more! arrow indicator that works on several indicators, in the settings you can change the color of the arrows and the period! (repeat) Test it and see it in action!
Some informations on the chart with the single attachment. RangeBorder Buy Sell (RBBS) Non Repaint Indicator will provide trend line, buy sell arrows,reversal arrows, range channel, order exit area,high average price line and low average price line.All arrows and lines don't repaint and not lagging. Once candle closed it won't  repaint. Reading Indicator: 1. Small Stars , Indicates oversold and overbought with certain logic and price may reverse when this small star triggers. Useful to identif
Trend Rever
Vitalii Zakharuk
The Trend Rever indicator uses two lines of different colors to display buy or sell signals. The first of these lines is red and the second is blue. When changing the color of the lines, an arrow is also displayed, which indicates which deal to open, buy or sell. A simple but effective system for determining the Forex trend. The algorithm takes into account the measurement of prices, and this method also focuses on the measurement of each of the price drops - which gives more detailed informati
Maximum Directional Index (MDI) is designed for two purposes. 1. To show the direction of the trend (The blue yellow trend line) 2. To show the Overbought (Resistance) and Oversold (Support) zones for a trader to know whether the trend is about to reverse or not. It shows the maximum direction of the price trend. How it works 1. The indicator works on all time-frames but for clarity I recommend you use it on 5minutes, 15miutes, 30minutes, 1 hour and 4 hours time-frame charts. 2. The indicator
Closing Average
Yaroslav Varankin
Closing average This is a completely new indicator in technical analysis. It is based solely on mathematical calculation. about signals It’s worth going into a buy transaction when the price has crossed the indicator line from bottom to top and it is under the price it is worth entering a deal on sell when the price is below the indicator line This author’s development, he doesn’t use any indicators of technical analysis in his analysis.
Possible Price reversals levels - based on  Fibonacci + Support +  Resistance Levels Auto levels drawn based on input index (Bars Count )  ---->>> Price Over 50% Fibo line ---> UP TREND ---> BUY when price drop near Support Lines  ---->>> Price Down 50% Fibo line ---> DOWN TREND ---> SELL when price goes up  near Resistance Lines  --->>> The more close price levels ----> the more possibility for price reversals --->>> are you a scalper --> try it on M1 charts with big index like 5000 bars  or
The Best Choice compra y venta
Sandro Israel Hernandez Zamora
¿Has escuchado decir que la tendencia es tu amiga? pues nada es mas cierto en el mundo del trading. Este indicador analiza las tendencias y su fuerza para que puedas aprovecharlas y utilizamos un conjunto de indicadores como RSI, %W, MACD y EMAS para analizar el mercado y sus movimientos, por lo que podrás mantener tu gráfico limpio sabiendo que todos estos indicadores los tienes en uno solo. Este, como cualquier indicador, no representa una certeza de compra o venta definitiva, por lo siempre r
Pivot Points MT4
KEENBASE SOFTWARE SOLUTIONS
KT Pivot Points automatically plots the daily, weekly, and monthly pivot levels on a chart with the precise calculation based on the latest data. Pivot points is a widely used indicator in technical analysis, particularly in the Forex market. Features Send alerts when the price touches the pivot level.  It offers complete customization for each kind of pivot level.   Shows daily, weekly, and monthly pivot levels without any fuss. It uses minimum CPU resources for faster calculation. Compati
Others
Tatiana Savkevych
The Others indicator is a trend-type indicator. In those moments when you need to make a decision to enter a position and give the trader a direction. The indicator gives the trader the opportunity to visually determine which trend will be present at a particular time interval. These are auxiliary tools for technical analysis of the market. Recommended for use in conjunction with any of the oscillators. The main application of the Others indicator is to generate buy and sell signals. Determin
Reversal Area Indicator
Shiffolika Kapila
5 (2)
REVERSAL AREA INDICATOR  This Indicator will generate signals on top and bottom of the swings . It will check for some support and resistance found and generate the signals at such areas. There is high probability of the price moving in favorable directions as they are signals when there is support and resistance . The advantage is that the entries will have small stop loss and high risk to reward ratios as they are near tops and bottoms. 1.       This is an indicator that will provid
DMI ADX Histogram Oscillator I present you one of the most precise and powerful indicator Its made of DMI Histogram together with ADX Oscillator. It has inside arrow to show a buy or sell setup. Features  The way it works its the next one : the histogram is a difference between DMI+ and DMI-.   At the same time together we have the oscillator ADX for Market to run It can be adapted to all type of trading styles such as scalping, day trading or swing. It doesn't matter if its forex, st
Scanner and Dashboard for Cycle Sniper ATR Fibo Channels Indicator As users know indicator draws Fibonacci Channels and arrows according to the user's settings. With CS ATR Fibo Channels Scanner, you will have the ability to watch the market. - Multi Timeframe - Multi Instrument Enter your parameters to watch (as explained in Cycle Sniper ATR Fibo Channels Indicator )  - If you cho0se "Arrows by ATR Levels" , you will receive the potential reversal arrrows. - If you choose "Arrows by M
Indicador para monitoramento do rebaixamento da conta e controle automático do time frame. Muitos robôs são lucrativos em time frames menores por um período de tempo, porem em algum momento eles quebram por pegar uma forte tendência, mas se mudar a tempo para um time frame maior muitas vezes ele se salva e volta lucrar novamente. O grande problema é ficar observando o andamento do rebaixamento da conta, porque por mais que você observe atentamente sua conta o maior movimento vem quando você meno
Descubriendo el indicador de tendencia XY sin repintado: su guía definitiva para el éxito en Forex y opciones binarias En el dinámico mundo del trading de Forex y opciones binarias, mantenerse a la vanguardia es primordial. Los traders están constantemente buscando herramientas que puedan proporcionarles una ventaja competitiva, y una de esas herramientas poderosas que ha estado causando sensación en la comunidad de trading es el indicador "Non-Repainting XY Trend". Introducción: El indicador de
Max Volume
Maksim Slovakov
Подкрашивает аномально большие тиковые объёмы в красный цвет. Имеет следующие настройки: "Процент" по умолчанию "70"  (Процент на который аномальный объём должен быть больше предыдущего) "Уровень" по умолчанию "500" (Количество тиков, больше которого будем брать во внимание аномальный объём) Внимание! Данный индикатор был разработан для мелких таймфреймов M1,M5,M15. Идея в том, что на таких Таймфреймах увеличение количества тиков говорит об увеличении количество сделок, увеличения интереса к цен
Predominant
Tatiana Savkevych
The main use of the Predominant indicator is to generate buy and sell signals. The indicator tracks the market trend, ignoring sharp market fluctuations and noises around the average price. I like it, first of all, because it has a simple mechanism of work, adaptation to all time periods and trading tactics. Created on the basis of a regression channel with filters. We display the signals of the Predominant indicator on the chart of the price function using a mathematical approach. You can tr
VWAP Indicator MT4
Kyra Nickaline Watson-gordon
5 (2)
Description : VWAP (Volume-Weighted Average Price) is the ratio of the value traded to total volume traded over a particular time horizon. It is a measure of the average price at which pair is traded over the trading horizon. Read More. All Symbols and All Timeframes are supported. Indicator Inputs :     VWAP Mode : Mode of VWAP Calculation. Options can be selected : Single,Session,Daily,Weekly,Monthly     Volumes : Real Volumes,Tick Volumes     Price Type : Used price for ca
Adamant Levels Logic A
Sattiraju Kottapalli
5 (1)
Este indicador pinta niveles que son muy "adamant" y de naturaleza fuerte. Estos niveles actúan como fuertes niveles de rechazo de precios durante un tiempo de vida y nunca se vuelven a pintar. Con el fin de incorporar todos mis niveles lógicos en su sistema de negociación, están disponibles 6 meses de suscripción de todos los niveles lógicos por el precio de suscripción de 1 mes. Esperamos que esto sea útil. Descargo de responsabilidad: si está buscando un indicador elegante, co
TMoney TrendCycle
Moises Orlando Urbina Sojo
El indicador grafica la tendencia a partir de una EMA de "n" períodos y el ciclo a partir de otra EMA de "k" períodos de la EMA anterior. Esto permite que los cruces sean mucho más efectivos y la amplitud del ciclo permite verificar la fuerza de la tendencia. Este indicador debe ser utilizado como herramienta complementaria para confirmar señales de entrada a mercado. Es posible agregar tres veces el indicador aplicado a precio máximo, precio mínimo y mediana del precio en TimeFrame de una hora
Limitless MT4
Dmitriy Kashevich
El MT4 ilimitado es un indicador universal adecuado para todos los operadores principiantes y experimentados. funciona en todos los pares de divisas, criptomonedas, acciones en bruto MT4 ilimitado: ya está configurado y no requiere configuración adicional Y ahora lo principal ¿Por qué MT4 ilimitado? 1 falta total de redibujo 2 dos años de pruebas por los mejores especialistas en comercio 3 la precisión de las señales correctas supera el 80% 4 tuvo un buen desempeño en el comerci
Está diseñado para ser utilizado por cualquier persona, incluso el principiante absoluto en el comercio puede usarlo. NUNCA repintar. Las indicaciones se dan de cierre a cierre. Diseñado para usarse solo, no se requieren otros indicadores. Le brinda la tendencia y el Take Profit potencial al comienzo del día. Un gráfico específico le muestra el beneficio potencial según los datos del historial. Como funciona La solución Breakout Pro Scalper utiliza una estrategia de ruptura combinada con la
Introducción: En el mundo acelerado del trading de opciones binarias y forex, tener las herramientas y estrategias adecuadas a su disposición puede marcar la diferencia entre el éxito y el fracaso. Una de estas herramientas es el sistema de indicadores binarios Black Blue BBB, un enfoque revolucionario para el trading que aprovecha una combinación de patrones de gráficos, medias móviles y volumen de trading para ayudar a los traders a tomar decisiones informadas. En esta guía completa, profundiz
Price Action Trading is an indicator built for the "Price Action" trading strategy. The indicator shows the points of the change in the direction of price movement, the direction of the trend, the dynamics of the trend, the distance traveled in points from the beginning of the change in the trend. This information is enough to trade and get good results in Forex. The Price Action Trading indicator has proven itself very well on GBPUSD, XAUUSD, EURUSD and other major currency pairs. You can inst
Los compradores de este producto también adquieren
¡Actualmente 20% OFF ! ¡La mejor solución para cualquier novato o trader experto! Este software funciona con 28 pares de divisas. Se basa en 2 de nuestros principales indicadores (Advanced Currency Strength 28 y Advanced Currency Impulse). Proporciona una gran visión general de todo el mercado de divisas. Muestra los valores de Advanced Currency Strength, la velocidad de movimiento de las divisas y las señales para 28 pares de divisas en todos los (9) marcos temporales. Imagine cómo mejorar
TrendMaestro
Stefano Frisetti
5 (2)
note: this indicator is for METATRADER4, if you want the version for METATRADER5 this is the link: TRENDMAESTRO recognizes a new TREND in the bud, he never makes mistakes. The certainty of identifying a new TREND is priceless. DESCRIPTION TRENDMAESTRO identifies a new TREND in the bud, this indicator examines the volatility, volumes and momentum to identify the moment in which there is an explosion of one or more of these data and therefore the moment in which prices have strong probability of f
TPSpro RFI Levels
Roman Podpora
5 (13)
Reversal First Impulse levels (RFI) - are the maximum volume levels/areas that turn the market around, so they play a critical role in future trading decisions. The logic behind the movement of any chart is that the price moves from the first impulse level (RFI) to the first impulse level (RFI) of the past trend. The first impulse level (RFI) is the most powerful level during a trend reversal, which forms a reversal zone. The first impulse level from the reversal of the previous movement is also
Introduciendo       Indicador Quantum Trend Sniper   , el innovador indicador MQL5 que está transformando la forma en que identificas y negocias los cambios de tendencia. Desarrollado por un equipo de comerciantes experimentados con experiencia comercial de más de 13 años,       Indicador de francotirador de tendencia cuántica       está diseñado para impulsar su viaje comercial a nuevas alturas con su forma innovadora de identificar cambios de tendencia con una precisión extremadamente alta.
ACTUALMENTE 26% DE DESCUENTO ¡La mejor solución para cualquier operador novato o experto! Este indicador es una herramienta única, de alta calidad y asequible porque hemos incorporado una serie de características propias y una nueva fórmula. ¡Con sólo UN gráfico puede leer la Fuerza de la Divisa para 28 pares de Divisas! Imagínese cómo mejorará su operativa porque podrá señalar el punto exacto de activación de una nueva tendencia o de una oportunidad de scalping. Manual del usuario: haga
Atomic Analyst
Issam Kassas
5 (2)
First of all Its worth emphasizing here that this Trading Indicator is   Non-Repainting ,   Non-Redrawing   and   Non-Lagging   Indicator, Which makes it ideal from both manual and robot trading.  The Atomic Analyst  is a PA Price Action Indicator that uses Strength and Momentum of the price to find a better edge in the market. Equipped with Advanced filters which help remove noises and false signals, and Increase Trading Potential. Using Multiple layers of complex Indicators, the Atomic Anal
TPSproTREND PrO
Roman Podpora
5 (15)
TPSpro TRENDPRO  - is a trend indicator that automatically analyzes the market and provides information about the trend and each of its changes, as well as giving signals for entering trades without redrawing! The indicator uses each candle, analyzing them separately. referring to different impulses - up or down impulse. Exact entry points into transactions for currencies, crypto, metals, stocks, indices!  - To maximize the potential and learn how to trade using this indicator, read the full des
Quantum Breakout Indicator PRO
Bogdan Ion Puscasu
4.96 (25)
Introduciendo       Quantum Breakout PRO   , el innovador indicador MQL5 que está transformando la forma en que comercia con Breakout Zones. Desarrollado por un equipo de operadores experimentados con experiencia comercial de más de 13 años,   Quantum Breakout PRO   está diseñado para impulsar su viaje comercial a nuevas alturas con su innovadora y dinámica estrategia de zona de ruptura. El indicador de ruptura cuántica le dará flechas de señal en las zonas de ruptura con 5 zonas objetivo de
Gann Swing Structure
Kirill Borovskii
5 (1)
This indicator is based on the mathematics of the great trader W.D. Ganna. With its help, you can easily find strong levels by analyzing swings to find the optimal entry point. The indicator works on all instruments and all timeframes. The indicator is fully manual and has control buttons. All you need to do is press the NEW button, a segment will appear, which you can place on any movement, swing or even 1 candle that you want to analyze. By placing the segment, press the OK button. A grid (th
Weis Wave with Alert
Trade The Volume Waves Single Member P.C.
4.79 (19)
Rental/Lifetime Package Options and Privileges' * For optimum results the yearly or lifetime package is suggested due to live training and Discord  channel trading with the  creator! Rent Monthly Six Months   Yearly/Lifetime Weis Wave with Speed with Alert+Speed Index x x x Manual  x x x Quick Set up Video x x x Blog x x x Lifetime Updates x x x Setup and Training Material x x Free Rectangle Break Alert Tool      x Discord Access Channel "The SI traders" x 2-hour live methodology traini
Advanced Supply Demand
Bernhard Schweigert
4.92 (309)
¡Actualmente con 33% de descuento! ¡La mejor solución para cualquier tráder principiante o experto! Este indicador es una herramienta comercial única, de alta calidad y asequible, porque incorpora una serie de características patentadas y una nueva fórmula. Con esta actualización, podrá mostrar zonas de doble marco temporal. No solo podrá mostrar un marco temporal más alto, sino también mostrar ambos, el marco temporal del gráfico MÁS el marco temporal más alto: MOSTRANDO ZONAS ANIDADAS. A todos
The indicator is designed to work on any trading platform. The program is based on proprietary algorithms and W.D.Ganna's mathematics, allowing you to calculate target levels of price movement based on three points with the highest degree of certainty. It is a great tool for stock trading. The indicator has three buttons: NEW - call up a triangle for calculation. DEL - delete the selected triangle. DELS - completely remove all constructions. The probability of achieving the goals is more than 80
Scalper Inside PRO
Alexey Minkov
4.74 (54)
GET 10% OFF NOW! Last 2 copies at current price! An exclusive indicator that utilizes an innovative algorithm to swiftly and accurately determine the market trend. The indicator automatically calculates opening, closing, and profit levels, providing detailed trading statistics. With these features, you can choose the most appropriate trading instrument for the current market conditions. Additionally, you can easily integrate your own arrow indicators into Scalper Inside Pro to quickly evaluate t
FX Power MT4 NG
Daniel Stein
5 (7)
Obtenga su actualización diaria del mercado con detalles y capturas de pantalla a través de nuestro Morning Briefing aquí en mql5 y en Telegram ! FX Power MT4 NG es la nueva generación de nuestro popular medidor de fuerza de divisas, FX Power. ¿Y qué ofrece este medidor de fuerza de nueva generación? Todo lo que le encantaba del FX Power original PLUS Análisis de fuerza de ORO/XAU Resultados de cálculo aún más precisos Períodos de análisis configurables individualmente Límite de cálculo persona
How to use Pair Trading Station Pair Trading Station is recommended for H1 time frame and you can use it for any currency pairs. To generate buy and sell signal, follow few steps below to apply Pair Trading Station to your MetaTrader terminal. When you load Pair Trading Station on your chart, Pair Trading station will assess available historical data in your MetaTrader platforms for each currency pair. On your chart, the amount of historical data available will be displayed for each currency pai
Currency Strength Exotics
Bernhard Schweigert
4.88 (33)
¡ACTUALMENTE 20% DE DESCUENTO ! ¡La mejor solución para cualquier operador novato o experto! Este indicador está especializado en mostrar la fuerza de la divisa para cualquier símbolo como Pares Exóticos, Materias Primas, Índices o Futuros. Es el primero de su clase, cualquier símbolo se puede añadir a la 9 ª línea para mostrar la verdadera fuerza de la moneda de Oro, Plata, Petróleo, DAX, US30, MXN, TRY, CNH etc. Se trata de una herramienta de trading única, de alta calidad y asequible por
Owl smart levels
Sergey Ermolov
4.62 (53)
Versión MT5  |   FAQ El   Indicador Owl Smart Levels   es un sistema comercial completo dentro de un indicador que incluye herramientas de análisis de mercado tan populares como   los fractales avanzados de Bill Williams , Valable ZigZag que construye   la estructura de onda correcta   del mercado y   los niveles de Fibonacci   que marcan los niveles exactos de entrada. en el mercado y lugares para tomar ganancias. Descripción detallada de la estrategia Instrucciones para trabajar con el indi
TPA True Price Action indicator reveals the true price action of the market makers through 100% non-repainting signals (except early signals mode) strictly at the close of a candle! TPA shows entries and re-entries, every time the bulls are definitely stronger than the bears and vice versa. Not to confuse with red/green candles. The shift of power gets confirmed at the earliest stage and is ONE exit strategy of several. There are available now two free parts of the TPA User Guide for our custo
GOLD Impulse with Alert
Bernhard Schweigert
4.56 (9)
Este indicador es una super combinación de nuestros 2 productos Advanced Currency IMPULSE with ALERT  +   Currency Strength Exotics . ¡Funciona para todos los marcos de tiempo y muestra gráficamente el impulso de fuerza o debilidad para las 8 divisas principales más un Símbolo! Este Indicador está especializado en mostrar la aceleración de la fuerza de la divisa para cualquier símbolo como Oro, Pares Exóticos, Materias Primas, Índices o Futuros. Es el primero de su clase, cualquier símbol
Este es un excelente sistema de indicadores técnicos, que analiza las tendencias comerciales periódicas al alza o a la baja desde aspectos pequeños, medianos y grandes. Period1 en los parámetros es un período de tiempo pequeño, Period2 es un período de tiempo medio y Period3 es un período de tiempo grande, small_symbol es el identificador de la señal No. 1, middle_symbol es el identificador de la señal No. 2 y big_symbol es el identificador. de la señal No. 3; alerta es el interruptor del bot
Quantum Heiken Ashi PRO MT4
Bogdan Ion Puscasu
4.43 (7)
Introduciendo el       Gráficos   Quantum Heiken Ashi PRO Diseñadas para brindar información clara sobre las tendencias del mercado, las velas Heiken Ashi son reconocidas por su capacidad para filtrar el ruido y eliminar las señales falsas. Diga adiós a las confusas fluctuaciones de precios y dé la bienvenida a una representación gráfica más fluida y confiable. Lo que hace que Quantum Heiken Ashi PRO sea realmente único es su fórmula innovadora, que transforma los datos de velas tradicionales en
THISE INDICATOR NOT WORK ON FREE DEMO. there is a protocol to work it. target finder indicator is a forecast the find probably targets.up and down. to use thise indicator, there is a protocol,i explain below. first load indicator  you will see blue and red lines. on the left side look to the higher value of line ,and draw horizantal line on top it. and on the right side see the LEVEL NUMBER. Finding UP TARGET h=put that level number  m=1 b=1 pres ok. you will see on the screen ,on top right ,r
Thise indicator is up down v6  comes with tradingwiev version. purchased people contact me on mql5 or write me email adress on mql5 message to get BONUS  TradingView version. up-down indicator is no repaint and works all pairs and lower than weekly time frames charts. it is suitable also 1 m charts for all pairs. and hold long way to signal. dont gives too many signals. when red histogram cross trigger line that is up signal.and price probably will down when blue histogram cross trigger line t
Step into the realm of Forex trading with confidence and precision using XQ, a cutting-edge Forex indicator designed to elevate your trading game to unprecedented heights. Whether you're a seasoned trader or just stepping into the world of currency exchange,   XQ Forex Indicator   empowers you with the insights and signals needed to make informed trading decisions. The signal conditions are a combination of three indicators, and XQ Forex Indicator only display  medium and long-term trends . The
This is a trend indicator that automatically analyzes the market and provides information about the trend and each of its changes. As well as giving signals for entering trades without redrawing after finished drawing previous candle! I use Rangebar candles in my stategies (important) I created several strategies based on this indicator. You will also create on your trading The indicator uses each candle, analyzing them separately. Referring to different impulses - up or down impulse.
TakePropips Donchian Trend Pro
Eric John Pajarillaga Aldana
4.81 (16)
¡TakePropips Donchian Trend Pro   (MT4) es una herramienta poderosa y efectiva que detecta automáticamente la dirección de la tendencia utilizando el Canal Donchian y le proporciona señales comerciales de entrada y salida! Este indicador multifunción incluye un escáner de tendencias, señales comerciales, panel estadístico, filtro, sesiones comerciales y panel de historial de alertas. ¡Está diseñado para proporcionarle señales comerciales y ahorrarle horas analizando los gráficos! Puede descargar
All in One Trade
Alexey Minkov
4.48 (27)
GET 10% OFF NOW! The All-in-One Trade Indicator (AOTI) determines daily targets for EURUSD, EURJPY, GBPUSD, USDCHF, EURGBP, EURCAD, EURAUD, AUDJPY, GBPAUD, GBPCAD, GBPCHF, GBPJPY, AUDUSD, and USDJPY. All other modules work with any trading instruments. The indicator includes various features, such as Double Channel trend direction, Price channel, MA Bands, Fibo levels, Climax Bar detection, and others. The AOTI indicator is based on several trading strategies, and created to simplify market anal
Gold ATR MTF 4
Sergei Linskii
5 (1)
Gold ATR MTF:   este es un excelente indicador técnico de acciones. El algoritmo del indicador ATR (Average True Range) analiza el movimiento del precio del activo y refleja la volatilidad dibujando los niveles correspondientes en porcentajes específicos (%) del precio de apertura del período de tiempo especificado (D1). Los indicadores (rojo y/o azul D1 H4) de la dirección del movimiento del precio del símbolo y las señales de flecha son ayudas adicionales y esenciales para una negociación y/o
Shepherd Harmonic Pattern
Abdullah Alrai
4.68 (59)
Este indicador detectará patrones armónicos que se dibujen en el gráfico mediante métodos manuales y automáticos. Puede consultar el manual del usuario en el siguiente enlace: Agregue su opinión y contáctenos para obtenerlo Existe una versión gratuita para probar este producto en mt4. Puede utilizarlo para detectar patrones de Gartley y Nenstar: https://www.mql5.com/en/market/product/30181 Puede comprar la versión completa de MT4 en: https://www.mql5.com/en/market/product/15212 Notas El indicad
This indicator is based on the work of legendary trader William Gann, specifically using mathematical models and data from past days. It calculates potential time for a reversal based on selected parameters for the current day. The time is displayed in the future, at the opening of the day and does not change thereafter. The indicator also includes alerts when potential reversal time approaches. An algorithm for possible price movement is built into the indicator. When the time comes, an alert i
Otros productos de este autor
TheStrat Levels MT5
Robert Gerald Wood
5 (1)
This indicator draws the prior Highs and Lows for multiple timeframes, and can display potential Take Profit and Stop Loss levels. In Rob Smith's # The Strat  terms, these are potential entry points, or alternatively potential targets for open positions. I like to use them in both ways. On a lower timeframe, say 5 minutes to get a good entry on a daily or weekly level, and then as a potential target. Very small stops required giving an excellent risk/reward ratio. Key Features  - Levels from Ho
TheStrat TFC Monitor MT5
Robert Gerald Wood
5 (1)
Al operar con   The Strat   , es importante estar atento a múltiples marcos de tiempo. Este indicador mostrará el estado diario, semanal, mensual y trimestral de la vela actual para cada período de tiempo. Un icono de círculo muestra que la vela en ese período de tiempo es actualmente un Interior, o Tipo 1 en la terminología de TheStrat. Una vela Inside Day está consolidando la acción del precio y estamos buscando una ruptura del rango. Un ícono de Triángulo, apuntando hacia arriba o hacia abajo
Multi Chart Crosshairs MT5
Robert Gerald Wood
5 (7)
Este indicador está diseñado para hacer que las revisiones de muchos gráficos en diferentes escalas de tiempo sean más rápidas y fáciles de hacer. Realice un seguimiento del tiempo y el precio en varios gráficos Cambiar símbolo en un gráfico y todos los demás gráficos del mismo símbolo también se cambiarán. Fácil de usar, rápido de dominar El indicador le permite identificar el precio y la hora en la que se encuentra el puntero del mouse en el gráfico actual, en todos los demás gráficos abiertos
TheStrat Monitor
Robert Gerald Wood
3 (2)
If you've not already learnt about The Strat trading strategy , go google it now. I promise it won't be a waste of your time, and you will likely learn some new tricks whether you use it or not. OK, so now you know what TheStrat is, you will be able to understand what this indicator can do for you. Key Features In short, the Indicator will: Show Timeframe Continuity for all supported timeframes Supports two timeset views, Day trader and Swing trader Show when Full Timeframe Continuity is in pl
Este indicador dibujará una etiqueta por encima o por debajo de cada vela basada en TheStrat de Rob Smith a medida que se desarrollen con el tiempo en su gráfico. A medida que evoluciona el precio, una vela puede cambiar entre tres estados. Cuando la vela se abre por primera vez, si se encuentra completamente dentro de las velas anteriores altas y bajas, entonces comenzará como un Tipo 1. A medida que pasa el tiempo, si rompe el máximo o mínimo de la vela anterior, se producirá un tipo 2, y s
TheStrat Candles
Robert Gerald Wood
4.5 (2)
Este indicador dibujará una etiqueta encima o debajo de cada vela según       Rob Smith       El Strat       a medida que se desarrollan con el tiempo en su gráfico. A medida que evoluciona el precio, una vela puede cambiar entre tres estados. Cuando la vela se abre por primera vez, si se encuentra completamente dentro de las velas altas y bajas anteriores, comenzará como Tipo 1. A medida que pasa el tiempo, si rompe el máximo o el mínimo de la vela anterior, se convertirá en un tipo 2, y si
Multi Chart Crosshairs
Robert Gerald Wood
5 (2)
This indicator is designed to make reviews of many charts on different timescales quicker, and easier to do. Track Time and Price across multiple charts Change Symbol on one chart and all other charts of the same symbol will be changed too. Easy to use, quick to master The indicator allows you to identify the price and time where the mouse pointer is on the current chart, across all other charts open on the same Symbol. This allows you to quickly see information on multiple charts whereas normal
TheStrat Patterns
Robert Gerald Wood
This indicator will draw patterns based on Rob Smith's The Strat as they emerge in real time on your chart. As price evolves, TheStrat offers 18 distinct price action patterns that can help you get good entries in the market. Each pattern involves two or three candles, and this indicator will draw a bounding box around the candles and name the pattern. The indicator also shows when a potential setup is forming, known by stratters as an Actionable signal. Candles Each candle is defined by i
Chart Drawing Cloner
Robert Gerald Wood
5 (4)
Este script le permite copiar objetos de dibujo de cualquier tipo, como líneas de tendencia, retrocesos de Fibonachi, etc., en uno o más gráficos. De forma predeterminada, la secuencia de comandos copiará todos los objetos en el gráfico actual, es decir, el gráfico al que se aplicó la secuencia de comandos, a cualquier otro gráfico del mismo símbolo cargado actualmente. Ajustes Plazo de destino Cuando se establece en algo que no sea PERIOD_CURRENT, copiará los objetos en cualquier gráfico
FREE
Creé este indicador simple mientras aprendía sobre TheStrat de Rob Smith y lo encuentro tan útil que pensé en compartirlo con usted. Si lo encuentra útil, mire los otros indicadores que he publicado en MQL5. El indicador simplemente dibuja una sola línea en el gráfico que muestra el nivel de precio que selecciona de un marco de tiempo más alto. Con la configuración, tiene control total sobre el período de tiempo que muestra, pero de forma   predeterminada, calcula el período de tiempo más alto,
FREE
A simple script that can delete all the drawing objects on a chart, or just the objects of a specific type. Settings: DeleteObjectsOfType By default the value will be blank which means ALL drawing objects on the chart will be deleted. If you only wish to delete specific types of drawing object, change this setting to the type of object to delete. For example, Fibonacci Retracement, Text, Label or Trend Line. Please see the demonstration video for more information.
FREE
This script allows you to toggle the "Show Trade Levels" option, but for the current chart only. Normally, you can only change the setting using the Options -> Chart menu for ALL charts, but this script allows you to do it for a SINGLE chart. I'm using it when I take screenshots, because most of the time I'm not trying to show the trades, just some functionality of one of my other tools. Iif you need that functionality, then this script is very helpful! If the script helps you, please let me
FREE
TheStrat FTFC
Robert Gerald Wood
FTFC se refiere a Full Timeframe Continuity como se define en   The Strat   de Rob Smith. Este indicador dibuja dos líneas en el gráfico, una de las más altas de los niveles de apertura trimestrales, mensuales, semanales, diarias o por horas, y la segunda de las más bajas de esos valores. Esto le da un canal por encima o por debajo del cual es más probable que el comercio sea muy fuerte en una dirección. Entre líneas, la acción del precio será más agitada y es posible que desee utilizar paradas
A los mercados les encantan los números redondos y, a menudo, actúan como soporte en un mercado a la baja o como resistencia cuando el precio sube. Este indicador está diseñado para dibujar niveles de precios en valores redondos. Lo hace automáticamente, pero también tiene la opción de anularlo y determinar los niveles que desea ver. Un nivel redondo puede ser tan simple como pasos de 10, 10, 20, 30, etc. o si está trabajando con Forex, tal vez quiera ver cambios en 0.1 o 0.01. El indicador dibu
Al operar con   The Strat   , es importante estar atento a múltiples marcos de tiempo. Este indicador mostrará el estado diario, semanal, mensual y trimestral de la vela actual para cada período de tiempo. Un icono de círculo muestra que la vela en ese período de tiempo es actualmente un Interior, o Tipo 1 en la terminología de TheStrat. Una vela Inside Day está consolidando la acción del precio y estamos buscando una ruptura del rango. Un ícono de Triángulo, apuntando hacia arriba o hacia abajo
Active Pivot Levels
Robert Gerald Wood
5 (1)
Los niveles de pivote son un nivel técnico bien establecido que es reconocido en todos los mercados. Este indicador dibujará los pivotes trimestrales, mensuales, semanales, diarios y de cuatro horas actuales en el gráfico, para cualquier símbolo. También puede mostrar los niveles de soporte y resistencia para cada período y elegir cuál mostrar del nivel 1 al 4.     Elija el tipo de pivote entre: Estándar Camarilla DeMark Woody Fibonacci Tenga en cuenta que los pivotes DeMark tienen un solo nivel
ATR Extremes
Robert Gerald Wood
El rango verdadero promedio (ATR) es un indicador de uso común que mide la cantidad de movimiento en el precio durante una duración determinada. Sin embargo, el valor que da no está definido dentro de ningún tipo de límite, lo que hace que usarlo para cualquier otra cosa que no sean cálculos de stop loss o take profit, sea casi imposible. Este indicador es su indicador ATR estándar, pero hemos introducido demarcaciones percentiles para que pueda ver los extremos. Puede elegir entre percenti
Range Exhaustion
Robert Gerald Wood
El agotamiento del rango ocurre cuando el precio alcanza o supera el rango esperado para el período actual. En estos niveles, el precio comienza a perder su impulso en relación con el período anterior, por lo que es un buen punto para asegurarse de que no está tomando nuevas posiciones. Este indicador le mostrará dónde es probable que suceda esto en su gráfico, mostrando niveles para períodos diarios, semanales y mensuales. Cuando ve que el precio supera estos niveles de agotamiento, le está dic
TheStrat FTFC MT5
Robert Gerald Wood
FTFC se refiere a Full Timeframe Continuity como se define en   The Strat   de Rob Smith. Este indicador dibuja dos líneas en el gráfico, una de las más altas de los niveles de apertura trimestrales, mensuales, semanales, diarias o por horas, y la segunda de las más bajas de esos valores. Esto le da un canal por encima o por debajo del cual es más probable que el comercio sea muy fuerte en una dirección. Entre líneas, la acción del precio será más agitada y es posible que desee utilizar paradas
This indicator will draw patterns based on   Rob Smith's   The Strat   as they emerge in real time on your chart. As price evolves,   TheStrat   offers 18 distinct price action patterns that can help you get good entries in the market. Each pattern involves two or three candles, and this indicator will draw a bounding box around the candles and name the pattern. The indicator also shows when a potential setup is forming, known by stratters as an Actionable signal. Candles Each candle is de
TheStrat Monitor MT5
Robert Gerald Wood
5 (1)
Si aún no conoce   la estrategia comercial de The Strat   , búsquela en Google ahora. Te prometo que no será una pérdida de tiempo, y es probable que aprendas algunos trucos nuevos, ya sea que lo uses o no. Bien, ahora que sabe qué es TheStrat, podrá comprender lo que este indicador puede hacer por usted. Características clave En resumen, el Indicador: Mostrar la continuidad del marco de tiempo para todos los marcos de tiempo admitidos Admite dos vistas de conjuntos de tiempo, Day trader y Swi
Los niveles de pivote son un nivel técnico bien establecido que es reconocido en todos los mercados. Este indicador dibujará los pivotes trimestrales, mensuales, semanales, diarios y de cuatro horas actuales en el gráfico, para cualquier símbolo. También puede mostrar los niveles de soporte y resistencia para cada período y elegir cuál mostrar del nivel 1 al 4.     Elija el tipo de pivote entre: Estándar Camarilla DeMark Woody Fibonacci Tenga en cuenta que los pivotes DeMark tienen un solo nivel
A los mercados les encantan los números redondos y, a menudo, actúan como soporte en un mercado a la baja o como resistencia cuando el precio sube. Este indicador está diseñado para dibujar niveles de precios en valores redondos. Lo hace automáticamente, pero también tiene la opción de anularlo y determinar los niveles que desea ver. Un nivel redondo puede ser tan simple como pasos de 10, 10, 20, 30, etc. o si está trabajando con Forex, tal vez quiera ver cambios en 0.1 o 0.01. El indicador dibu
ATR Extremes MT5
Robert Gerald Wood
El rango verdadero promedio (ATR) es un indicador de uso común que mide la cantidad de movimiento en el precio durante una duración determinada. Sin embargo, el valor que da no está definido dentro de ningún tipo de límite, lo que hace que sea casi imposible usarlo para cualquier otra cosa que no sean cálculos de stop loss o take profit. Este indicador es su indicador ATR estándar, pero hemos introducido demarcaciones de percentiles para que pueda ver los extremos. Puede elegir entre percentiles
El agotamiento del rango ocurre cuando el precio alcanza o supera el rango esperado para el período actual. En estos niveles, el precio comienza a perder su impulso en relación con el período anterior, por lo que es un buen punto para asegurarse de que no está tomando nuevas posiciones. Este indicador le mostrará dónde es probable que suceda esto en su gráfico, mostrando niveles para períodos diarios, semanales y mensuales. Cuando ve que el precio supera estos niveles de agotamiento, le está dic
Filtro:
No hay comentarios
Respuesta al comentario
Versión 2.10 2021.06.18
Fix for issue where lines were not drawing for charts with not enough history data on the current timeframe.
Fix for issue where number of potential targets displayed was being restricted unintentionally.
Minor performance improvements.
Versión 2.0 2021.06.16
NEW - Version 2 of the Indicator.
Almost a complete rewrite, now includes the drawing of potential Take Profit and Stop loss levels and showing the associated Risk/Reward value for each. Pivot Machine Gun (PMG) scenarios are also identified and shown on each level with that potential.

- Levels from Hourly, Four Hourly, Daily, Weekly and Monthly timeframes
- Potential Take Profit levels
- Potential Stop Loss levels based on the current or higher timeframe
- Risk / Reward calculated continuously for each potential target level based on potential stop level
- Pivot Machine Gun identification
- Labelling for each level so you can identify what there
- Comprehensive options to make it look as you wish