Automatic Vwap Midas
- Indicadores
-
Ricardo Almeida Branco
 Comencé a seguir la bolsa de valores brasileña en 2018, en una cuenta de demostración, y encontré interesante la cantidad de configuraciones utilizadas. Tomando en serio el aprendizaje e incluso la demostración, entendí que debía comenzar a programar para validar / descartar configuraciones.
 - Versión: 1.6
- Actualizado: 22 mayo 2022
- Activaciones: 5
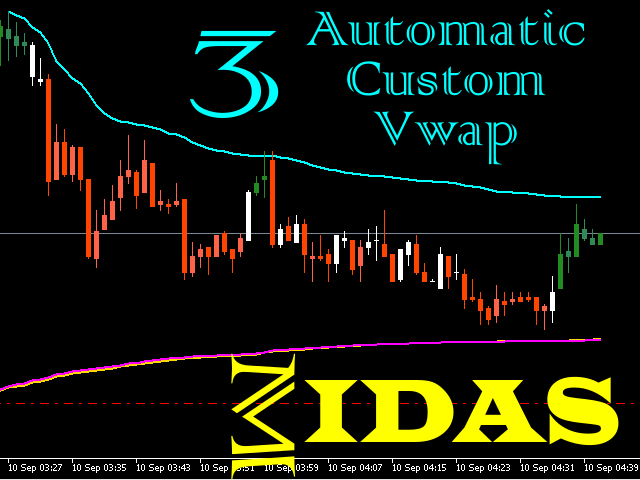
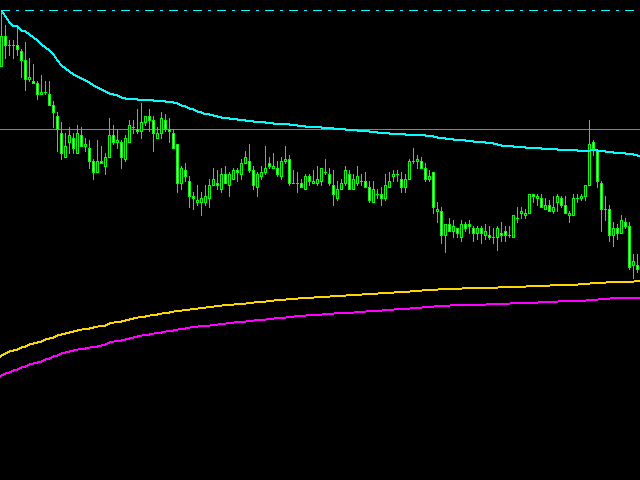
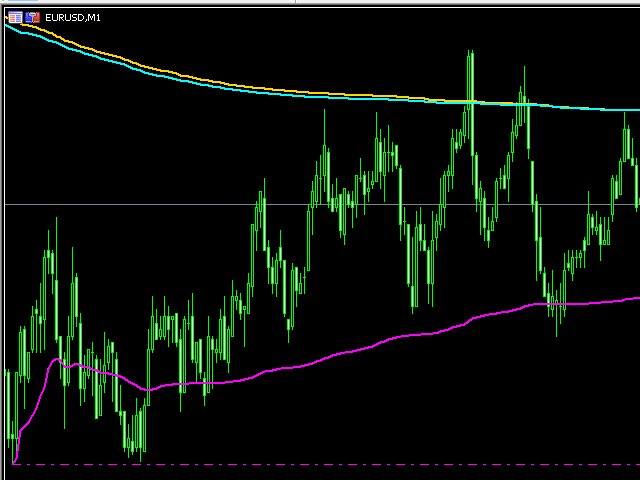
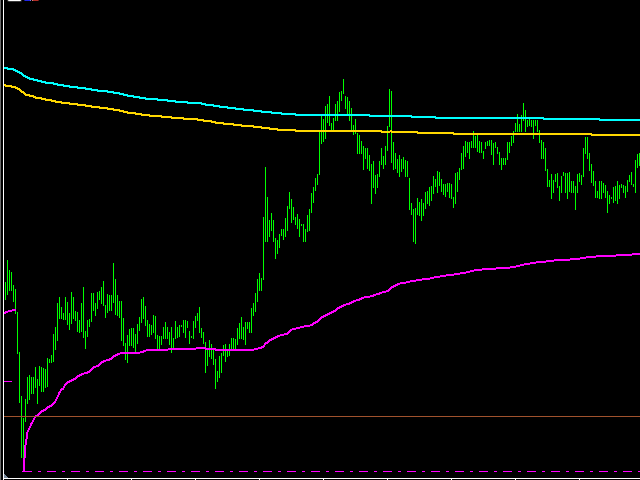
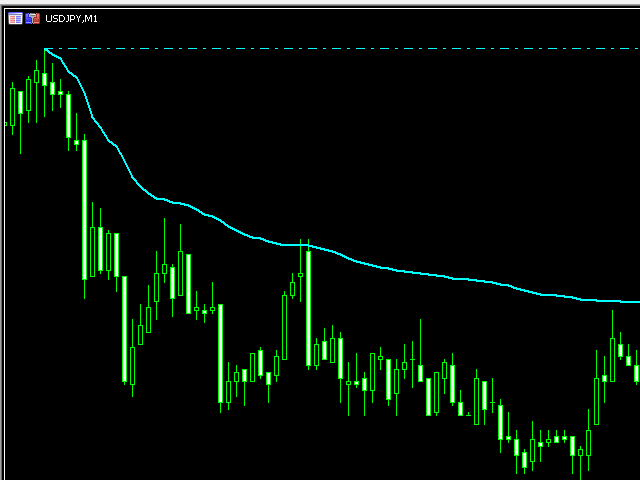
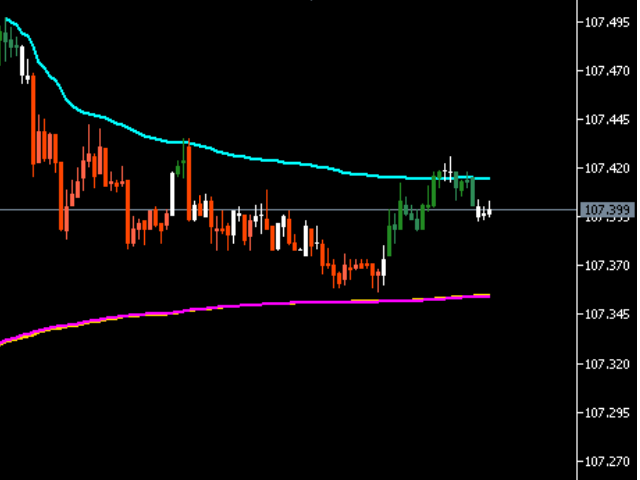
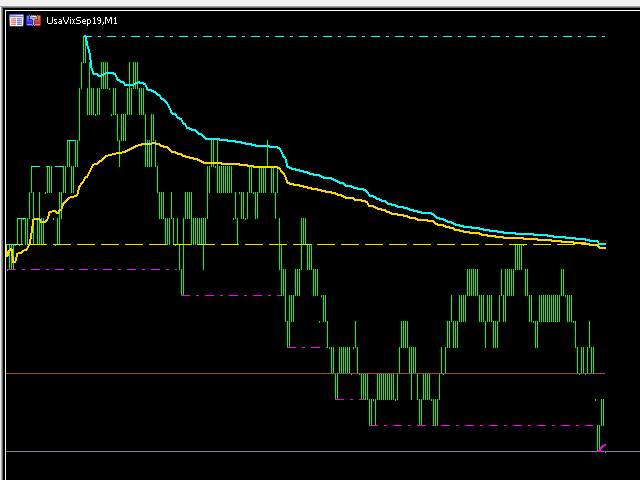
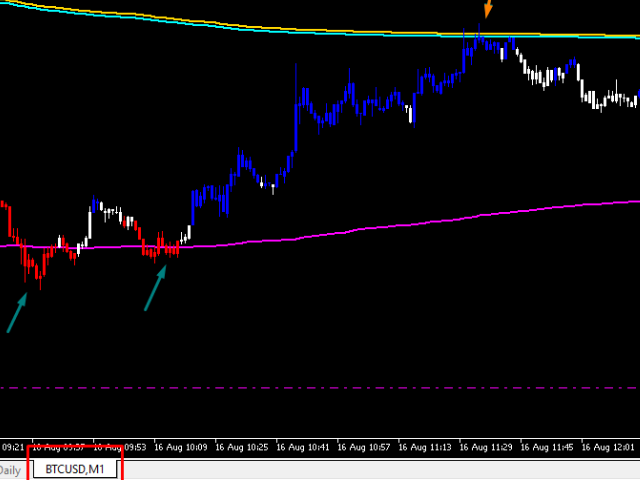
El Indicador 3 Vwap Automático (Midas) puede ser utilizado por los estudiosos del Precio y el Volumen para trazar el movimiento de los impulsores del mercado. Traza automáticamente 3 Vwaps, dos de los cuales son dinámicos y se actualizarán a lo largo del día si surgen nuevos máximos o nuevos mínimos. El tercer Vwap es diario y puede ayudar si la tendencia es alcista o bajista. Además, se insertó un indicador auxiliar que traza (también dinámico) puntos de interés con precios OHLC (Apertura, Máximo y Mínimo del día actual y Cierre del día anterior). ¡Éxito y buenas operaciones!


Very nice one. Run smoothly.