Renko Ultimate
- Indicadores
- Versión: 1.6
- Actualizado: 9 junio 2021
- Activaciones: 5

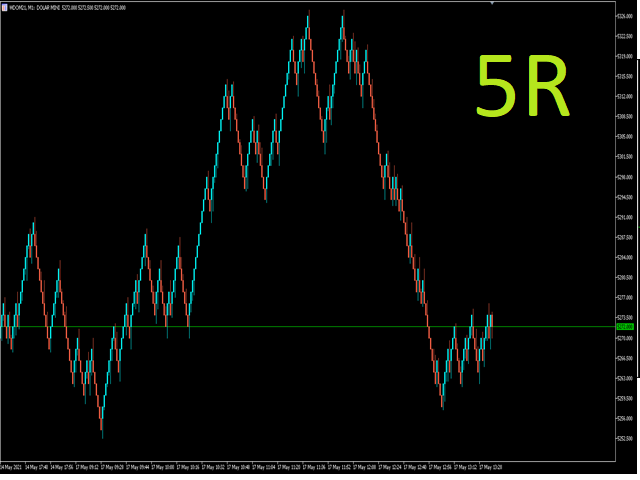
¡Este indicador crea el RENKO perfecto para que usted trabaje con tipos de Velas atemporales! ¡Debido a las características de RENKO atemporal, el indicador ajusta las flechas de negociación (de lo contrario se perderían) y las deja exactamente donde se produjo la negociación en Velas Renko! ¡Además, este indicador muestra exactamente la división entre los días, con el fin de dejar claro al usuario donde cada sesión de negociación comenzó y terminó!
Detalles importantes:
- El RENKO generado automáticamente tiene una precisión de hasta el 95% para renkos pequeños (5R) y del 100% para renkos más grandes (a partir de 10R) en comparación con las plataformas propias de RENKO (ProfitChart, TradingVIEW etc);
- ¡El RENKO generado durante las horas de negociación es 100% preciso porque utiliza los ticks de las operaciones recibidos en la plataforma del usuario como fuente de datos!
- Si desea generar un Historial REAL, sólo tiene que ir a "Probador de Estrategias" y ejecutar en "CADA TICK SE BASA EN UN TICK REAL";
- A diferencia de TODOS los demás disponibles en la MT5, este RENKO es ABSURDAMENTE RÁPIDO y FIABLE¡!
- El parámetro "BACKUP" guarda el historial de Renko para una rápida inicialización en la siguiente llamada.
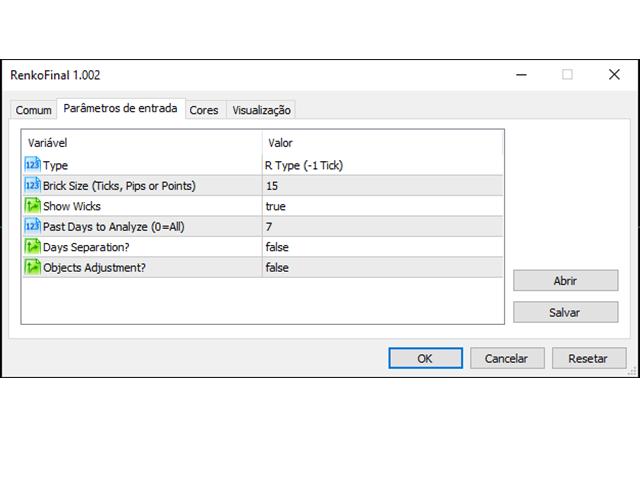
Tiene las siguientes variables:
- Tipos de Renko (Ticks, Puntos, Pips o R);
- Mostrar Mechas (sí / no);
- Tamaño de Renko;
- ¿Cuántos días de historial?
- ¿Mostrar Separación de Días?
- ¿Manejar las FLECHAS de Trading?
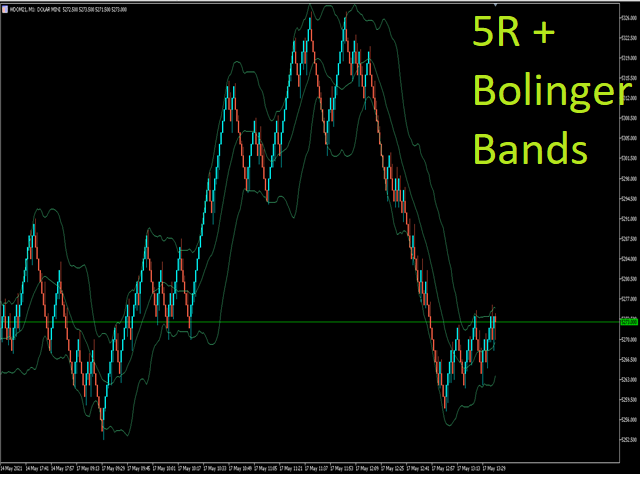
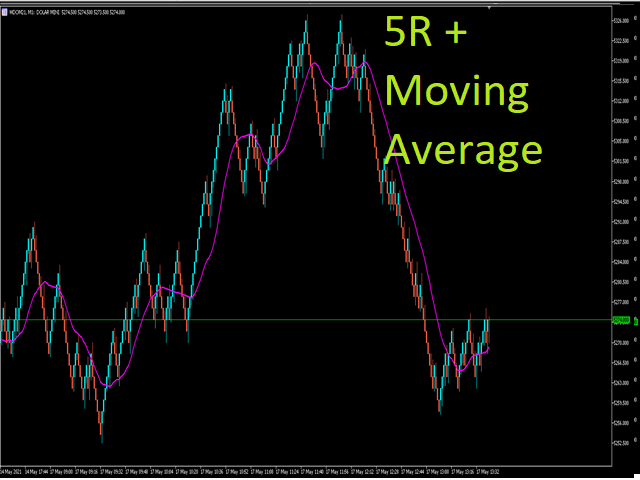
Al tratarse de un indicador, podrás llamarlo a través de la función iCustom y aplicar cualquier otro indicador que desees bajo él. Para ayudarte con la programación, aquí tienes la información principal:
- Buffer de Cierre: 0
- Buffer Máximo: 1
- Buffer mínimo: 2
- Buffer abierto: 3
- Buffer COLOR (1 = Vela Negativa y 2 = Vela Positiva): 4
- Buffer de Ticks de Volumen: 5
- Buffer Volumen Real: 6
- Buffer Fecha / Hora: 7
¡¡¡Espero que este indicador sea extremadamente útil y te ayude a tener grandes resultados en tus negociaciones !!!


Good job! The author is very responsive and friendly.