Buy Sell Signals MT4
- Indicadores
- Versión: 2.5
- Actualizado: 25 abril 2020
- Activaciones: 5

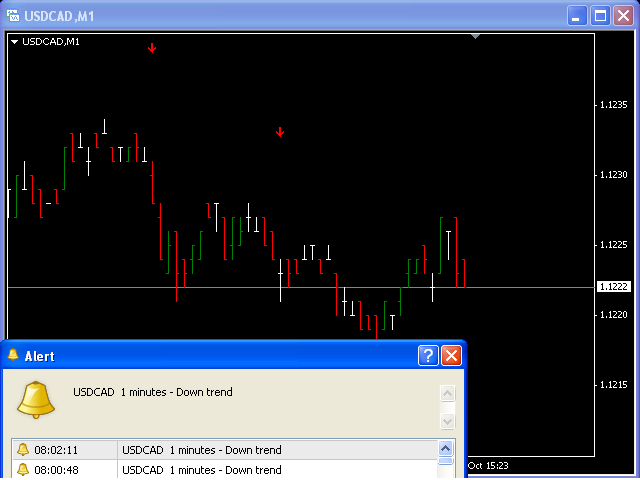
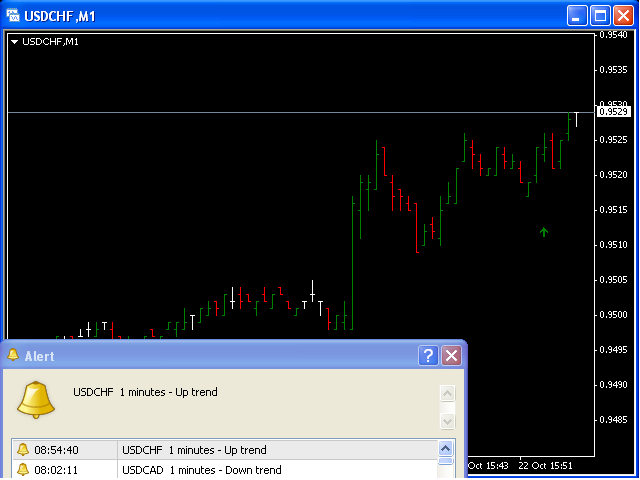
Este indicador tiene sólo un parámetro de entrada - Alertas. Si Alertas es verdadero, entonces el mensaje de Alerta aparecerá cuando la tendencia Larga o Corta comience.
Cada mensaje contiene: hora, nombre del par de divisas y el marco de tiempo actual.
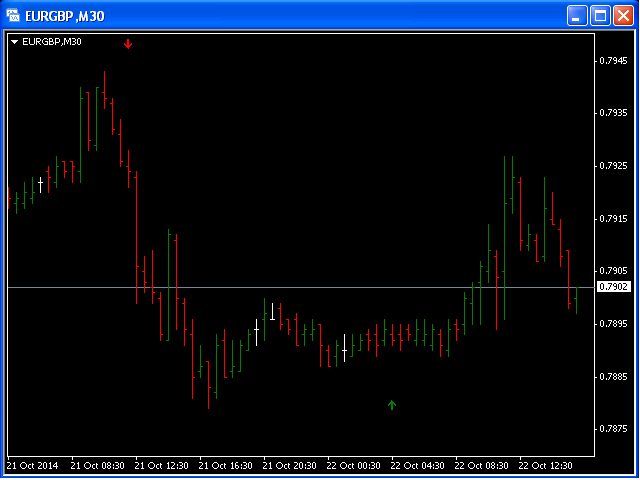
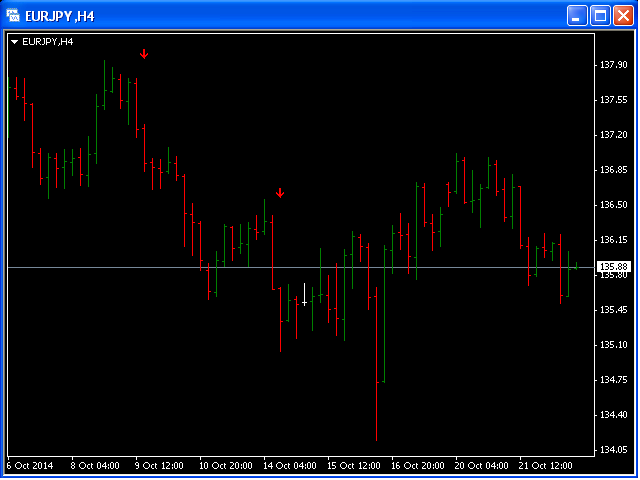
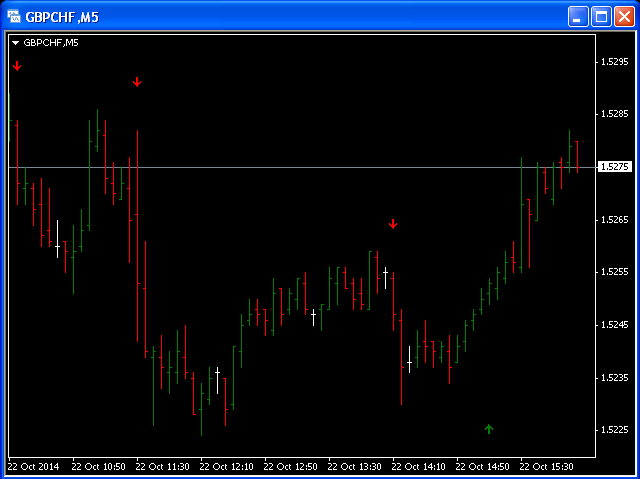
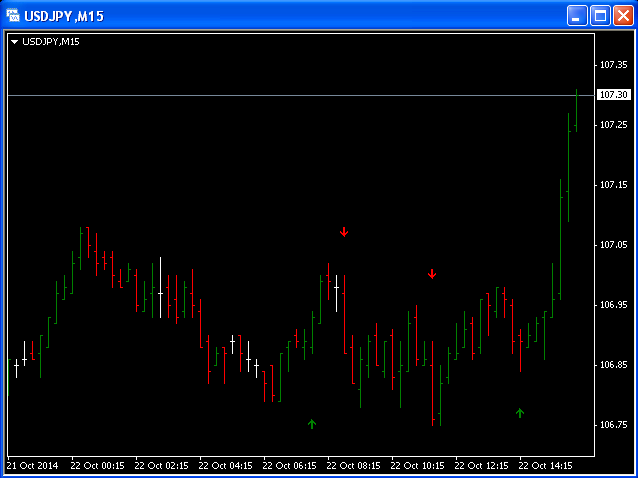
- Laflecha verde indica una tendencia alcista.
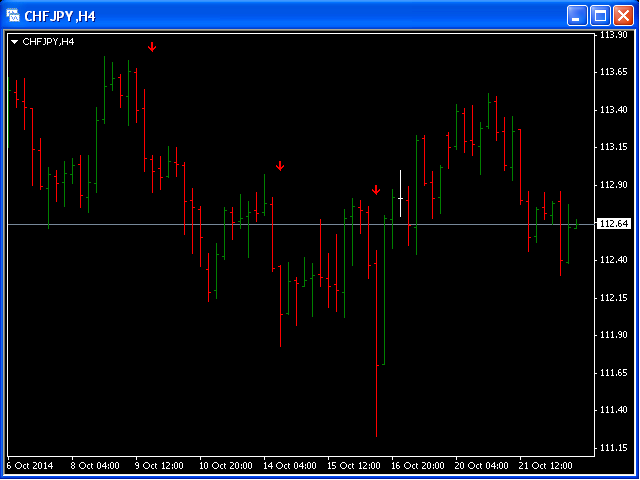
- Laflecha roja indica una tendencia a la baja.
Este indicador será útil cuando alguien esté decidiendo hacer una posición de Compra o Venta.