Nasdaq100 Power Indicator
- Indicadores
-
Teboho Edgar Rakotsoane
 5 años de experiencia en Forex, por lo que sé exactamente lo que necesita para facilitar su negociación.
 - Versión: 1.7
- Actualizado: 3 diciembre 2021
- Activaciones: 20
El Indicador NASDAQ 100 Power sirve con indicación de TENDENCIA y reversiones de tendencia usando flechas automatizadas que indican comprar o vender a ese precio y tiene incorporado un proveedor de señales a través de todos los marcos de tiempo con alertas y proporciona también el soporte y resistencia automatizados que pueden dibujar patrones de análisis técnico como doble fondo, doble techo, cabeza y hombros, etc. usando precios de cierre y apertura,
en la asistencia para si un comerciante no vio el patrón antes de su análisis técnico. El indicador ha etiquetado los niveles que ayudan con donde usted entra en el comercio y donde usted toma el estado del ímpetu del beneficio y del precio para los que scalp el mercado.
ES MUY RECOMENDABLE POR EL AUTOR PARA INTEGRAR EL INDICADOR CON SU SRATEGY PARA EL POTENCIAL COMPLETO, PERO SI USTED NO TIENE LA ESTRATEGIA AMABLEMENTE VER EL VIDEO A CONTINUACIÓN.
EL INDICADOR VIENE CON EL MANUAL DE USUARIO EN PROFUNDIDAD / GUÍA PARA LOS PRINCIPIANTES
Siempre antes de colocar la orden siga estos pasos.
Paso 1
Compruebe si los tres marcos de tiempo tienen la misma señal
Paso 2
Si la señal es fuerte de compra asegúrese de que el precio está en la parte inferior.
Si la señal es fuerte de venta asegúrese de que el precio está en la parte superior.
Paso 3
Utilice Stop loss en todo momento
Nota: el precio debe estar en la PARTE INFERIOR de los tres marcos temporales si la señal es de COMPRA fuerte
Y el precio debe estar en la PARTE SUPERIOR de los tres marcos temporales si la señal es de VENTA fuerte.
QUÉ OFRECE EL INDICADOR
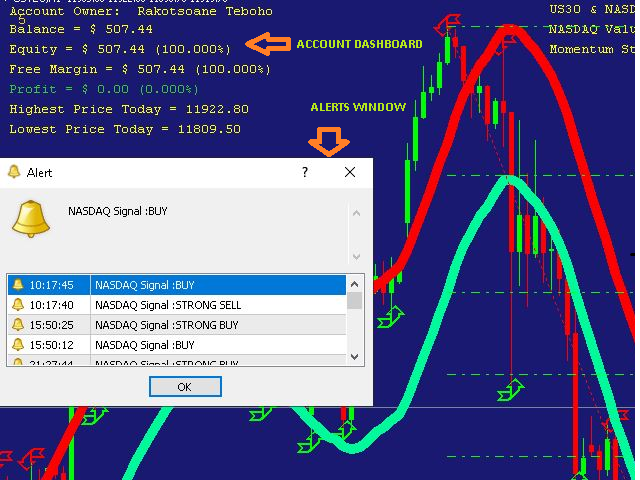
1. PROVEEDOR DE SEÑALES INTEGRADO EN TODOS LOS MARCOS TEMPORALES CON ALERTAS Y NOTIFICACIONES PUSH EN SU DISPOSITIVO ANDROID E IOS
2.INDICACIÓN DE PUNTO DE COMPRA/VENTA MEDIANTE FLECHAS AUTOMATIZADAS.
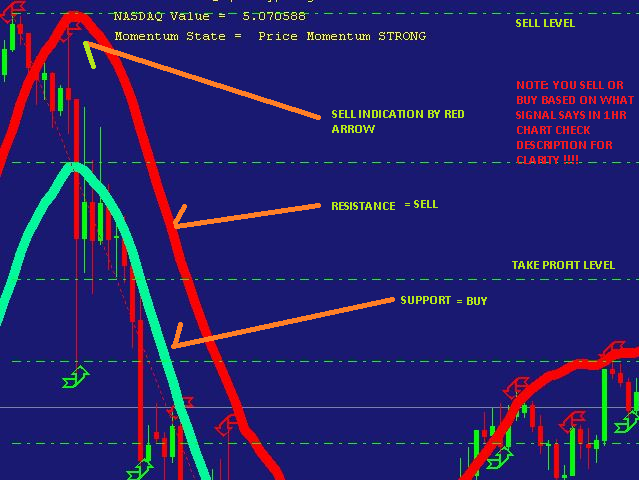
3.SOPORTE Y RESISTENCIA AUTOMATIZADOS CON CAPACIDAD DE PINTAR PATRONES TÉCNICOS UTILIZANDO EL PRECIO DE CIERRE Y APERTURA.
4.NIVELES ETIQUETADOS PARA LA ENTRADA Y SALIDA DE UNA OPERACIÓN CON NIVELES DE TAKE PROFIT DE 1-4.
5.TABLERO DE LA CUENTA CON EL PRECIO MÁS ALTO Y EL PRECIO MÁS BAJO DEL DÍA PARA MARKERTS QUE SE EXTIENDEN.
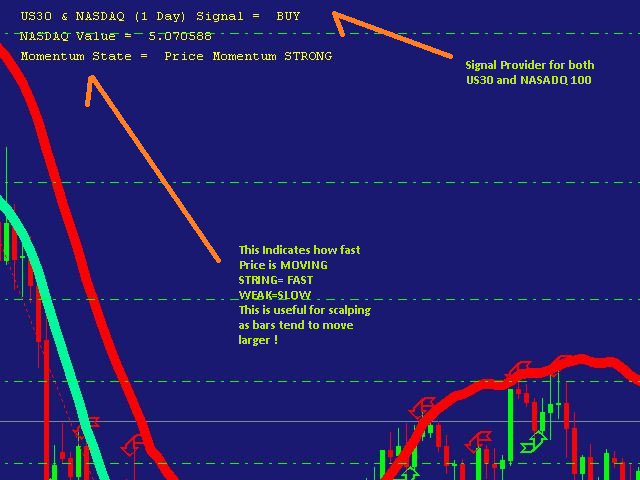
6.ESTADO DEL MOMENTO DEL PRECIO PARA SCALPING.
CÓMO FUNCIONA EL INDICADOR
Nota: Esto se aplica a scalping también.
PASOS:
1.SEÑAL- Antes de cualquier configuración que necesitamos saber lo que la señal nos dice. en primer lugar una señal que se encuentra en 1HR gráfico describe la tendencia del día
si tenemos las siguientes condiciones(i) Si la señal en el gráfico de 1HR dice FUERTE COMPRA significa que para el resto del día estamos buscando tendencia alcista por lo que cuando entramos en una operación entramos teniendo en cuenta sólo 1 dirección que es hacia ARRIBA.
(ii) Si la señal en el gráfico de 1HR dice COMPRA , significa que para el resto del día estamos buscando una tendencia alcista. tendencia alcista PERO no hay que ser agresivo ya que esto indica una posible señal de VENTA/tendencia a la baja.
(iii) Si la señal en el gráfico de 1HR diceFUERTE VENTAsignifica que para el resto del día estamos buscando tendencia bajista por lo que cuando entramos en una operación entramos teniendo en cuenta sólo 1 dirección que es hacia ABAJO.
(iv) Si la señal en el gráfico de 1HR diceSELLsignifica que para el resto del día estamos buscando tendencia bajista PERO no debe ser agresivo, ya que esto indica una posible COMPRA. tendencia alcista.
2.ENTRADA EN UNA OPERACIÓN- Después de concluir cuál es la tendencia del día, necesita saber dónde entrar en una operación. Antes de entrar en una operación deben cumplirse las siguientes condiciones. Las condiciones son (i) Usted necesita utilizar 15min Gráfico de marco de tiempo de los cuales si una tendencia es una tendencia alcista desde el PASO 1, entonces sólo entramos en el mercado subiendo y si una tendencia es alcista, entonces sólo entramos en el mercado subiendo. entrar en el mercado subiendo y si una tendencia es bajista desde el PASO 1 entonces sólo entramos bajando.
(ii) Usted hace uso de flechas automatizadas que indicarán una compra o venta al precio que automáticamente determinado automáticamente Verde-Compra, Rojo-Venta.
(iii) También puede hacer uso de los niveles etiquetados para entrar en una operación en la dirección que determinó en el PASO 1.
3.SALIDA DE UNA OPERACIÓN- Después de entrar en una operación debemos saber donde salimos y las siguientes condiciones deben cumplirse para salir de una operación.
Las condiciones son (i) Usted puede colocar su take profit al nivel más cercano i.es decir, si ha vendido, coloque la toma de beneficios en el nivel más cercano bajando y viceversa si compró.
(iii) Puede hacer uso de los niveles TP (Take profit) etiquetados y colocar su Take profit en el precio determinado. por usted.
4. 4. COLOCACION DE STOP-LOSS- Esta parte depende enteramente de un trader y su manejo de riesgo pero por conveniencia el autor aconseja que usted coloque su stop loss 20 pips por debajo de un nivel etiquetado si usted entro al mercado en direccion alcista y viceversa si usted entro al mercado en direccion bajista.
CONTACTO CON EL AUTOR
Por favor, haga uso de la dirección de correo electrónico que se encuentra en mi perfil o puede mensaje directo a mí en MQL y mt4 aplicación para preguntas sobre cualquier cosa sobre el producto.


Very good indicator for Nasdaq. Gives key buy / sell levels. Teboho very helpful.