Ara Chennel
- Indicadores
- Versión: 1.0
- Activaciones: 10

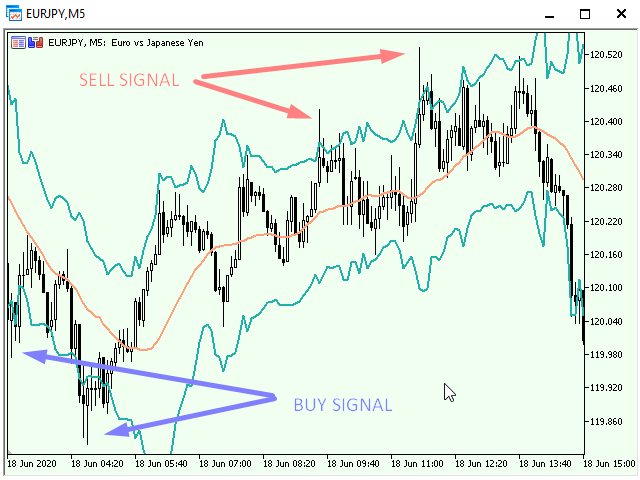
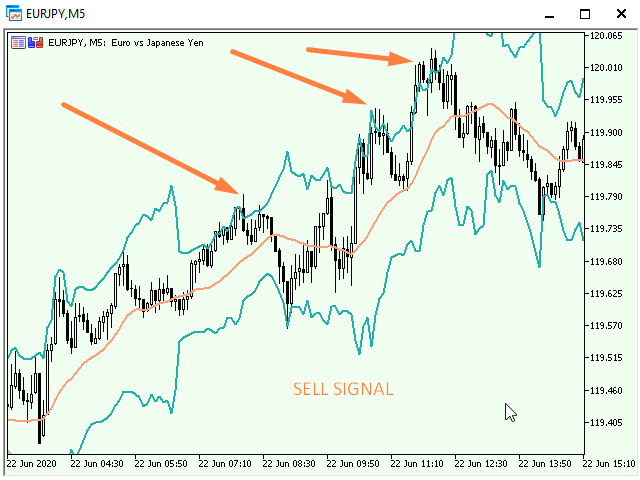
Ara Channel es un indicador de canal diseñado para ayudar a identificar probables puntos de inversión del precio. Será útil para los comerciantes que operan tanto en la tendencia y contra-tendencia.
Las señales del indicador pueden servir como totalmente independiente para el comercio, y como adicional, la confirmación.
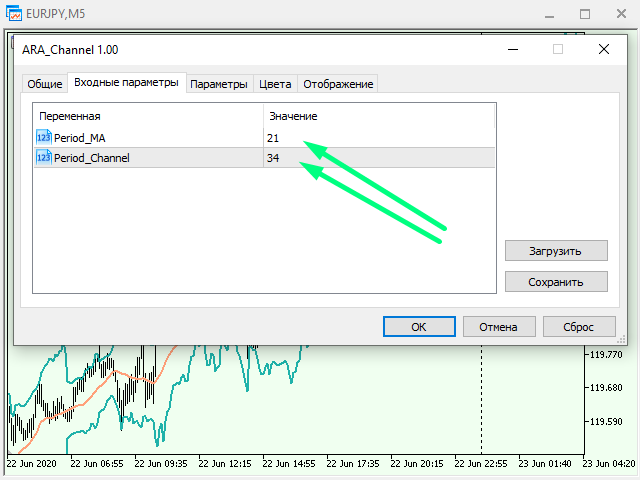
El indicador tiene sólo dos ajustes: Period_MA es una media móvil ordinaria valores recomendados de 8 a 480, Period_Channel es un período para el cálculo de los límites del canal dinámico.
Ventajas: no redibujar, fácil de configurar.
Recomendaciones: para obtener una imagen más completa de los puntos de entrada en el mercado, configure varios indicadores en un gráfico con diferentes parámetros. De esta forma verá señales sincronizadas de varios periodos.


Хороший индикатор - показывает точки входа и закрытия сделок - работаем от границ канала