Ara Chennel
- 지표
- 버전: 1.0
- 활성화: 10

Ara Channel это канальный индикатор призван помогать определять вероятные точки разворота цены. Будет полезен трейдерам торгующим как в тренд так и в контртренд.
Сигналы индикатора могут служить как полностью самостоятельными для торговли , так и как дополнительными , подтверждающими.
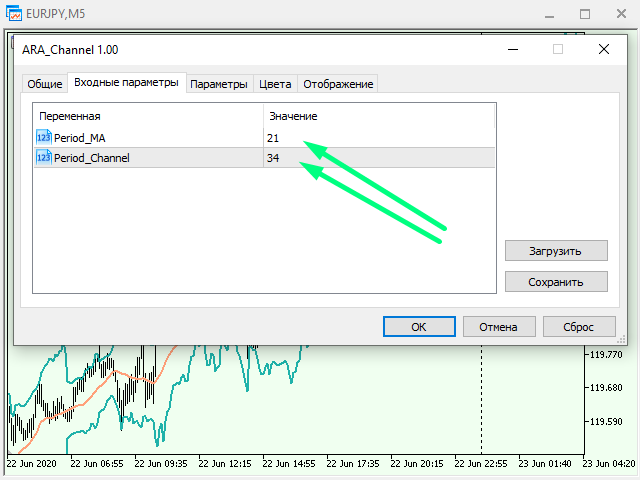
Индикатор имеет всего две настройки: Period_MA это обычная скользящая средняя рекомендуемые значения от 8 до 480, Period_Channel это период для расчёта границ динамического канала.
Преимущества : не перерисовывается, прост в настройке.
Рекомендации: для более полной картины отображения точек входа в рынок установите несколько индикаторов на один график с разными параметрами. Тем самым вы увидите синхронные сигнал с нескольких периодов.
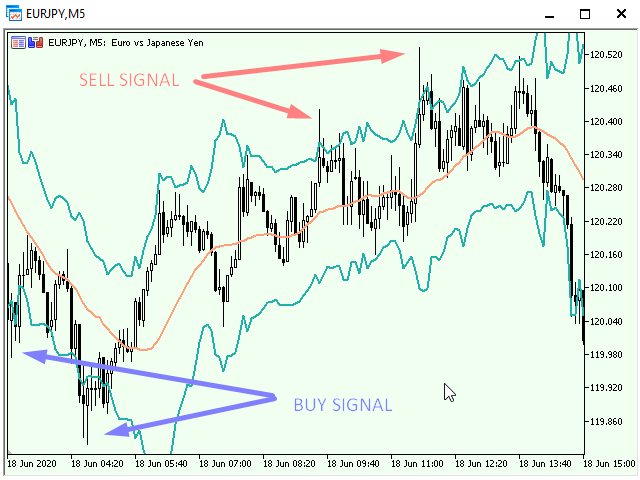

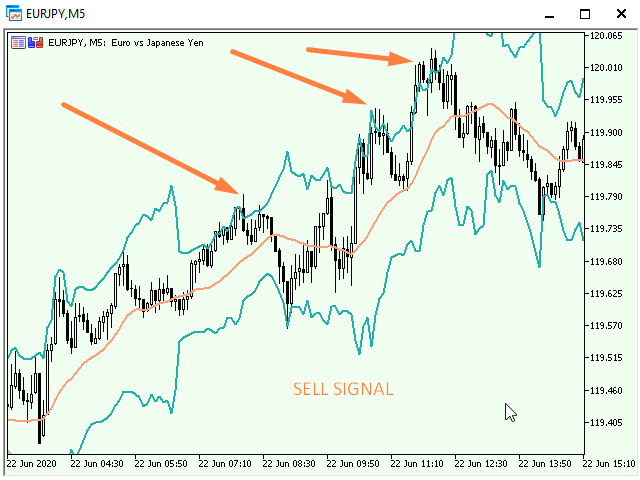

Хороший индикатор - показывает точки входа и закрытия сделок - работаем от границ канала