Trend in Colors MT5

The three basic types of trends are up, down, and sideways. An uptrend is marked by an overall increase in price. Nothing moves straight up for long, so there will always be oscillations, but the overall direction needs to be higher. A downtrend occurs when the price of an asset moves lower over a period of time.

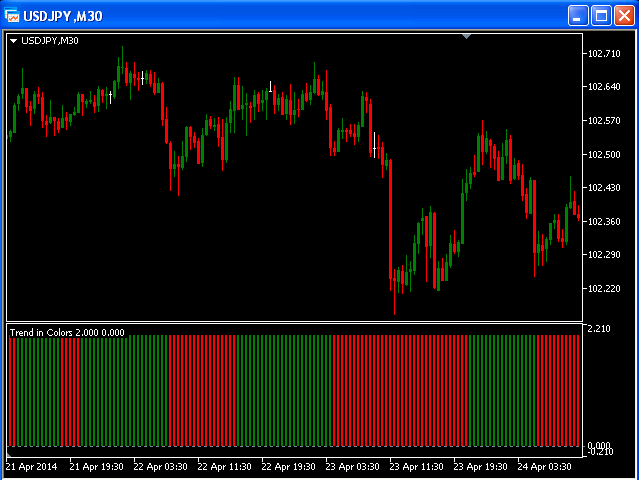
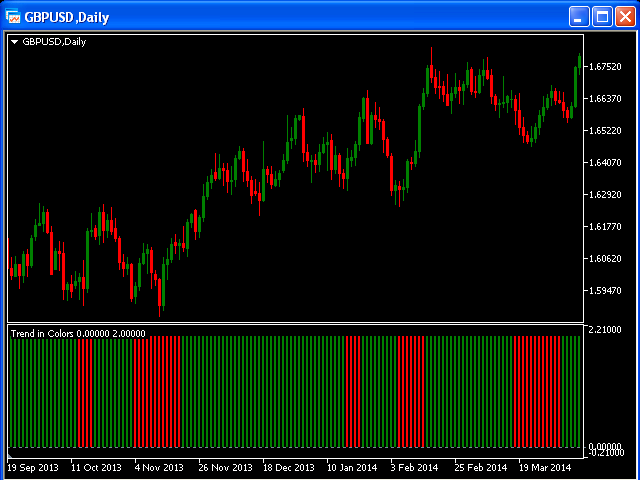
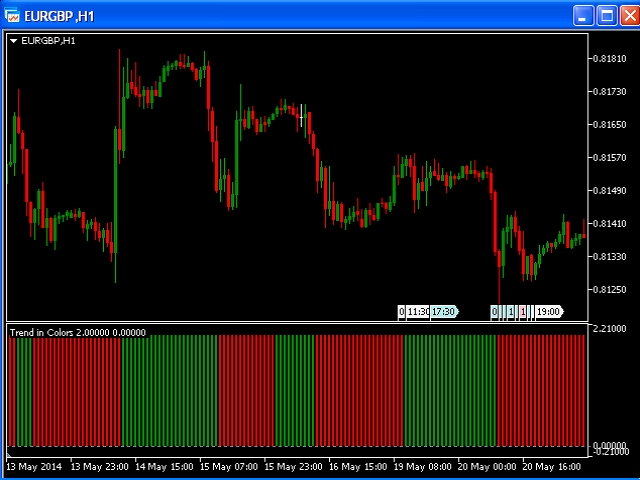
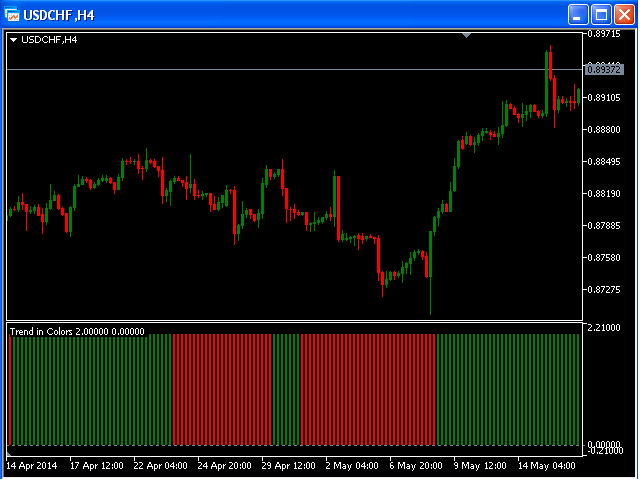
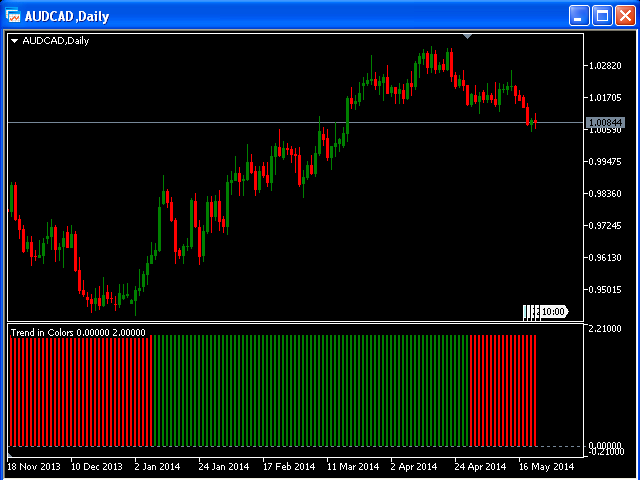
This is a separate window indicator without any input parameters.

Green Histogram is representing an Up-Trend and Red Histogram is representing a Down-Trend.

Prodotti consigliati
Indicatore RSI con bande di Bollinger: massimizza il win rate con precisione e strategie avanzate di trading. Personalizza il periodo dell'RSI, la media delle bande e la deviazione per adattare l'indicatore alle tue strategie uniche. Su richiesta, offriamo anche la possibilità di personalizzare o creare indicatori customizzati per soddisfare al meglio le tue esigenze di trading.
Simple Delta
Vincent Jose Proenca
Simple Delta – Descrizione per il cliente Simple Delta è un indicatore delta di volume pulito ed efficiente per MetaTrader 5, che mostra la pressione di acquisto e vendita normalizzata sopra ogni candela. Cosa ottieni L’indicatore analizza i dati tick in tempo reale per calcolare il delta (volume di acquisto meno volume di vendita) e mostra un unico valore normalizzato (-10 a +10) sopra ogni candela. I valori positivi indicano il predominio degli acquirenti (visualizzati nel colore di acquisto s
StructureFlow MT5
Vincent Jose Proenca
Indicatore Avanzato di Analisi della Microstruttura di Mercato Questo indicatore analizza l’azione del prezzo a livello microscopico per rilevare squilibri nascosti prima che avvengano grandi movimenti. A differenza degli indicatori tradizionali che osservano solo il prezzo, StructureFlow esamina tre dimensioni fondamentali: Analisi Principale Microstruttura delle Candele Rapporto ombra/corpo Posizione del corpo all’interno del range Rilevamento di espansione/contrazione Anomalie di volatilità i
The " Stochastic Advanced " indicator displays the signals of the 'Stochastic" indicator directly on the chart without the presence of the indicator itself at the bottom of the screen. The indicator signals can be displayed not only on the current timeframe, but also on a timeframe one level higher. In addition, we have implemented a filter system based on the Moving Average indicator. Manual (Be sure to read before purchasing) | Version for MT4 Advantages 1. Displaying the signals of the "Stoch
SMC Guardian
Mohammed Mamdouh Abdel Fattah Mohammed El Sayed
5 (3)
GUARDIAN: The Ultimate Trend & Security Indicator GUARDIAN is a sophisticated technical analysis tool designed for traders who prioritize precision and capital preservation. This indicator acts as a vigilant protector of your trades, filtering market noise and identifying high-probability trend reversals with institutional-grade accuracy. Core Features: Adaptive Trend Detection: Utilizes advanced algorithms to detect market shifts before they become obvious. Smart Risk Management: Built-in signa
FREE
Pan PrizMA
Aleksey Panfilov
The indicator builds a moving line based on interpolation by a polynomial of 1-4 powers and/or a function consisting of a sum of 1-5 sine curves. Various combinations are possible, for example, a sum of three sine curves about a second order parabola. The resulting line can be extrapolated by any of the specified functions and for various distances both as a single point at each indicator step (unchangeable line), and as a specified (re-painted) function segment for visualization. More details:
L'indicatore Forex Double Stocastic RSI è una modifica dell'oscillatore stocastico per la piattaforma MetaTrader 5. INFORMAZIONI SULL'INDICATORE L'indicatore forex Double Stocastic implementa un doppio stocastico applicato all'RSI, utilizzando livelli fluttuanti invece di quelli fissi per valutare ipervenduto e ipercomprato. Nei casi in cui il periodo RSI è <=1, si ottiene solo un doppio stocastico. È possibile utilizzare un ulteriore livellamento dei risultati (per questo viene utilizzata
Legacy of Gann for MT5
Pavel Zamoshnikov
5 (5)
The indicator very accurately determines the levels of the possible end of the trend and profit fixing. The method of determining levels is based on the ideas of W.D.Gann, using an algorithm developed by his follower Kirill Borovsky. Extremely high reliability of reaching levels (according to K. Borovsky  - 80-90%) Indispensable for any trading strategy – every trader needs to determine the exit point from the market! Precisely determines targets on any timeframes and any instruments (forex, met
FVG Imbalance Zones
Pierre Alexis Blond
Indicator Description: FVG Imbalance Zones The FVG Imbalance Zones indicator is a powerful tool designed to identify potential price imbalances on financial charts. Developed by Pierre-Alexis Blond, this innovative indicator marks regions where significant price shifts may occur, offering traders valuable insights into potential market turning points. Key Features: Imbalance Detection: FVG Imbalance Zones identifies potential price imbalances in the market, pinpointing areas where supply and de
Swing Tracer
Ely Alsedy
5 (1)
it depends on ATR period to get swing points to help make better trading decisions  blue dot and red dot is the default color scheme of course you can change it later if you'd like  you can change the following : ATR PERIOD  sending notifications number of times to send notifications  sending notifications to your smart phone that's it very simple to use just drag and drop and follow the trend 
The Oscillometer5
Francisco De A Vilar Enriquez
It is a new indicator that frames the price movement and tracks it. It consists of   oscillation channel   and its   center line   CL . For its calculation it is only necessary to introduce the   amplitude   of the channel. Because of this, it is a   non-lagging   indicator as it is not calculated based on a number of previous candlesticks. It removes any level of   noise , showing the underlying price movement cleanly via the   center line . It allows you to easily identify the   beginnings   a
Leave a review for this product, and receive another "Free" product that you choose. You can see my other products here: https://www.mql5.com/en/users/zakri/seller Trend Detective is an advanced trend detection indicator which shows accurate entry points in direction of trend. It uses smart technology in order to detect entry points, trend changing points, and TP points. It also shows hit rate for current chart using selected parameters. Hit rate for this indicator on different charts can be 8
# RSI Pro Alert - Advanced RSI Indicator A powerful professional-grade RSI indicator with intelligent alerts, scheduled snapshots, and multi-dimensional notifications to help you capture market opportunities with precision! --- ## Key Features ### Smart Signal Detection - **Precision Cross Detection** : Automatically identifies critical moments when RSI crosses overbought/oversold levels - **State Tracking Mechanism** : Real-time monitoring of market state changes (Overbought/Overso
Trend Follower LukaHo
Lukasz Mariusz Holla
TrendFollower (The Swiss Army Knife for Trends) Forget standard indicators. Discover TrendFollower – 5 strategies in one! Tired of indicators that show a buy signal when the market is long past its peak? Your moving averages are so laggy that they show last Tuesday's trend? Let's get this straightened out. I present to you TrendFollower – a powerful, modular framework (Institution-Grade) that analyzes market structure from five different perspectives. Whether you're a patient sw
RangeZone  Indicator General Overview: Global Exchange Trading from East to West World financial markets operate on the principle of continuous trading sessions, where activity moves with the sun from one financial center to another. Understanding this dynamic is key to successful trading! How Trading Moves Around the World: Asian Session   (Sydney, Tokyo): Opens first, sets the tone for daily volatility Japanese yen, Australian dollar, Asian indices Often forms key support/resistance level
Crystal Timeless Pro
Muhammad Jawad Shabir
Crystal Timeless Pro - Renko Market Structure, Signals and Risk Tool Pure price. Pure structure. No time, no noise. Crystal Timeless Pro draws clean, TradingView-style Renko bricks and maps the full market structure directly on those bricks. Because the bricks are built from price (not time), the market noise is filtered out before the structure is calculated. The result is a clear read on trend, structure shifts and high quality signals - plus a built-in manual risk calculator to plan every tra
RSI NextGen
Murtadha Majid Jeyad Al-Khuzaie
RSI NextGen Advanced RSI Indicator The RSI NextGen is an advanced and modernized version of the classic Relative Strength Index (RSI). It comes with enhanced features that deliver far more accurate and reliable signals across different market conditions. This indicator has been designed to provide traders with a dynamic and adaptive view of overbought and oversold zones, instead of relying on the static and rigid settings of the traditional RSI. Unlike the standard RSI, which is calculated us
Supertrend indicator uses a combination of a moving average and average true range to detect the trend of a trading instrument. Supertrend indicator for MetaTrader 5 easily shows the trend as a line following the price. Triple SuperTrend Histo indicator  calculate  three supertrends to show the trend as a histogram. Changing the color from red to green means you can BUY , from green to red means you can SELL . Description of the method of drawing a histogram. The price is above the EMA 200,
Flow MTF
Guillaume Jouans
This indicator takes as parameters the periods for three moving averages (Short, Long, Very_Long) and displays them for the current timeframe: - in the form of a cloud (green if Short is greater than Long, red if Short is less than Long) - as a line for the Very_Long moving average. It also allows you to display the status (BUY or SELL) of these same moving averages but for the M15, H1, H4, W1 and MN1 timeframes. This information is summarized in the window titled "TREND", where, for each timefr
SuperTrend Indicator with Alerts Overview The SuperTrend Indicator is a trend-following tool that helps traders identify market direction and potential reversals using a combination of: Commodity Channel Index (CCI): Detects momentum shifts and confirms trends. Exponential Moving Average (EMA): Acts as a trend filter to enhance signal accuracy. SuperTrend Lines: Visual trend markers for clear buy and sell signals. This indicator provides real-time alerts and visual markers to help traders reco
Advanced 4xZeovo MT5 Indicator (MetaTrader 5)   Product Description  4xZeovo is a powerful trading indicator system monitoring 24/7 financial markets. Metatrader5 tool designed to find the best buying/selling opportunities and notifies the user.    Making life easy for traders in helping with the two most difficult decisions with the use of advanced innovate trading indicators aiming to encourage users to hold the winning positions and take profit at the best times.    Equipped with a unique tra
RED ZONE Monitor Loss-Cut & Break-Even Risk Monitor for Averaging Traders (MT5) RED ZONE Monitor is a risk management indicator for traders who use averaging, scaling-in, or multiple open positions . It visually displays: The loss-cut (liquidation) risk zone The break-even price Based on current open positions, lots, and margin conditions This indicator does not provide entry signals. It does not promise profits. It shows where your account actually fails if price moves against you. What RED ZO
Indicatore Crypto_Forex "CCI con zone di ipervenduto/ipercomprato dinamiche" per MT5, senza ridisegno. - Il Commodity Channel Index (CCI) è eccellente per il trading di momentum nella direzione del trend. - È ottimo per prendere posizioni di vendita dalla zona di ipercomprato dinamica e posizioni di acquisto dalla zona di ipervenduto dinamica nella direzione del trend principale. - Questo indicatore è eccellente anche da combinare con posizioni di price action. - Zona di ipercomprato dinamica -
Basic information. To perform its work, the indicator takes data on volumes from a lower timeframe, builds Market Profiles for a higher timeframe and a histogram for the current timeframe. The indicator starts in several stages. In this case, messages like: "Build Source & Target TF. Step: …" are output to the log. The process can be accelerated by changing the input parameter Milliseconds between steps - the initialization speed. The final value of this parameter is always individual and is set
Elite Harmony Signals Pro Panoramica Elite Harmony Signals è un indicatore sofisticato di analisi tecnica che visualizza rettangoli dinamici che forniscono zone di trading chiare e segnali di conferma per decisioni migliorate. Caratteristiche Principali Zone Rettangolo Dinamiche Estensione in Tempo Reale : I rettangoli si estendono automaticamente all'azione corrente del prezzo Chiusura Intelligente : I rettangoli si chiudono solo quando appaiono segnali opposti Conferma Visiva : Zone di trading
The Moving Average Dashboard indicator allows you to see the relationship between a fast and a slow moving average. This indicator is working on multiple symbols and up to 21 timeframes. It's allows you to configure the fast and slow moving averages to whatever period, method or price is appropriate The Moving Average Dashboard saves you time as you can use the indicator to scan multiple currency pairs or other symbols in just one window. Installation Download the Indicator in your MT5 termi
Indicatore Crypto_Forex "Velocità Bande di Bollinger" per MT5, senza ridisegno. Velocità delle Bande di Bollinger - è un indicatore di tendenza unico. - Il calcolo di questo indicatore si basa su equazioni fisiche. - La velocità è la derivata prima delle Bande di Bollinger standard. - L'indicatore di velocità delle Bande di Bollinger mostra la velocità con cui la linea centrale e i bordi delle Bande di Bollinger cambiano direzione. - Per impostazione predefinita: la linea blu indica la velocit
Karoospikes v1
Francois Niel Van Wyk
Catch boom spikes like a pro – before they happen! The KarooSpikes Boom Spike Catcher is a powerful MetaTrader 5 indicator designed for traders who want to consistently catch spikes on Boom with precision and confidence. What This Indicator Does: Detects high-probability spike zones using a combination of: RSI + Stochastic crossovers Price action 50 EMA trend filter Plots clear BUY arrows on your chart when spike conditions are met Sends instant mobile + sound alerts so you never miss a
The   Trendlines Oscillator   helps traders identify trends and momentum based on the normalized distances between the current price and the most recently detected bullish and bearish trend lines. The indicator features bullish and bearish momentum, a signal line with crossings, and multiple smoothing options. USAGE The   Trendlines Oscillator   works by systematically: Identifying pivot highs and lows. Connecting pivots to form bullish (support) and bearish (resistance) trendlines. Measuring
This indicator is used to compare the relative strength of the trade on the chart against the other two selected symbols. By comparing the price movement of each traded variety based on the same base day, three trend lines of different directions can be seen, reflecting the strong and weak relationship between the three different traded varieties, so that we can have a clearer understanding of the market trend. For example, you can apply this indicator on a EurUSD chart and compare it with curre
Gli utenti di questo prodotto hanno anche acquistato
Neuro Poseidon MT5
Daria Rezueva
4.8 (54)
Neuro Poseidon is a new indicator by Daria Rezueva. It combines precise trading signals with adaptive TP/SL levels - creating best possible trades as a result! Message me and get  Neuro Poseidon Assistant  as a gift to automize your trading process! What makes it stand out? 1. Proven profitability on all assets and timeframes 2. Only confirmed BUY and SELL signals present on the chart 3. Adaptive TP & SL levels generated by the software for each trade 4. Easy to understand - suitable for al
SuperScalp Pro
Van Minh Nguyen
4.68 (28)
SuperScalp Pro –  Sistema Professionale di Scalping con Confluenza Multilivello SuperScalp Pro è un sistema di trading professionale a confluence multi-livello progettato per identificare opportunità di trading ad alta probabilità attraverso una conferma intelligente multi-fattoriale. Integrando Supertrend, VWAP, EMA, RSI, ADX, analisi dei volumi, Bande di Bollinger e divergenza MACD, il sistema filtra le configurazioni di bassa qualità, riduce i falsi segnali di breakout e migliora la precision
Cominciamo con la verità. Nessun indicatore da solo ti renderà profittevole. Se qualcuno ti dice il contrario, ti sta vendendo un sogno. Qualsiasi indicatore che mostra frecce perfette di acquisto/vendita può essere reso impeccabile — basta ingrandire la giusta sezione della storia e catturare solo i trade vincenti. Noi non lo facciamo.  SMC Intraday Formula è uno strumento. Legge la struttura del mercato per te, identifica le zone a più alta probabilità e ti mostra esattamente come appare la t
M1 Quantum MT5
Hamed Dehgani
5 (6)
Segnali di Trading Live con M1 Quantum: Segnale   (Operazione eseguita automaticamente dal Quantum Trade Assistant , incluso gratuitamente con questo prodotto.) Piano prezzi: Prezzo attuale: $149 (Offerta per i primi utenti) Prossimo prezzo previsto: $169 Prezzo al dettaglio previsto: $299 Nota dello sviluppatore: Dopo l’acquisto, contattami per ricevere il file di configurazione più recente (Set File) , consigli operativi e l’invito al gruppo VIP di supporto , dove potrai interagire con altri
Questo prodotto è stato aggiornato per il mercato 2026 e ottimizzato per le ultime build di MT5. AVVISO DI AGGIORNAMENTO PREZZO: Smart Trend Trading System è attualmente disponibile a $99 . Il prezzo aumenterà a $199 dopo i prossimi 30 acquisti . OFFERTA SPECIALE: Dopo aver acquistato Smart Trend Trading System, inviami un messaggio privato per ricevere Smart Universal EA GRATIS e trasformare i tuoi segnali Smart Trend in operazioni automatiche. Smart Trend Trading System è un sistema di tradin
Entry In The Zone and SMC Multi Timeframe is a real-time 2-in-1 market analysis tool that combines market structure analysis and a No Repaint BUY / SELL signal system into a single indicator, built on Smart Money Concepts (SMC) — a widely adopted framework used by professional traders to understand market structure. This indicator helps you see the market more clearly, make decisions based on structure rather than guesswork, and focus on high-probability zones where price is more likely to react
Power Candles MT5
Daniel Stein
5 (8)
Power Candles V3 - Indicatore di forza ad ottimizzazione automatica Power Candles V3 trasforma la forza delle valute e degli strumenti in un piano di trading attuabile su ogni grafico a cui è collegato. Invece di limitarsi a colorare le candele, esegue un'auto-ottimizzazione in tempo reale in background e ti fornisce i migliori valori di Stop Loss, Take Profit e soglia di segnale per il simbolo che hai davanti. Basta un clic per adottarlo nel trading live: i raggi di ingresso, Stop Loss e Take P
Trend Sniper X
Sarvarbek Abduvoxobov
5 (3)
Trend Sniper X è un indicatore di trend following multi-timeframe per MetaTrader 5 che aiuta i trader a identificare la direzione del trend e i potenziali punti di inversione con chiarezza e precisione. Informazioni sul prezzo: Il prezzo attuale è promozionale ed è soggetto a modifiche con il rilascio di futuri aggiornamenti e nuove funzionalità. Canale Code2Profit Padroneggia il mercato con l'analisi multi-timeframe! Specifiche tecniche Piattaforma MetaTrader 5 Tipo di indicatore Indicatore di
Divergence Bomber
Ihor Otkydach
4.9 (92)
Ogni acquirente dell’indicatore riceverà inoltre gratuitamente: L’utilità esclusiva “Bomber Utility”, che gestisce automaticamente ogni operazione, imposta i livelli di Stop Loss e Take Profit e chiude le posizioni secondo le regole della strategia I file di configurazione (set file) per adattare l’indicatore a diversi asset I set file per configurare il Bomber Utility in tre modalità: “Rischio Minimo”, “Rischio Bilanciato” e “Strategia di Attesa” Una guida video passo-passo per installare, conf
Gann Made Easy è un sistema di trading Forex professionale e facile da usare che si basa sui migliori principi del trading utilizzando la teoria di mr. WD Gann. L'indicatore fornisce segnali ACQUISTA e VENDI accurati, inclusi i livelli di Stop Loss e Take Profit. Puoi fare trading anche in movimento utilizzando le notifiche PUSH. CONTATTAMI DOPO L'ACQUISTO PER RICEVERE GRATUITAMENTE LE ISTRUZIONI DI TRADING E OTTIMI INDICATORI EXTRA! Probabilmente hai già sentito parlare molte volte dei metodi d
The Oracle Pro
Ottaviano De Cicco
The Oracle Pro: Synthetic Multi-Timeframe Bias Engine for MT5 ️ Summer Launch Offer — Get The Oracle Pro for USD 199 (early buyers). Price rises with traction; final price USD 399. The Oracle Pro is a premium multi-timeframe bias engine for MetaTrader 5, built for demanding and professional traders. It answers one question with discipline: what is the directional bias on each timeframe right now, how strong is it, and how much do the timeframes agree? Everything is computed on closed bars only
L'indicatore UZFX {SSS} Scalping Smart Signals v4.0 MT5 è un indicatore di trading ad alte prestazioni che non subisce ripaint, progettato per scalper, day trader e swing trader che necessitano di segnali accurati e in tempo reale in mercati in rapida evoluzione. Sviluppato da (UZFX-LABS), questo indicatore combina l’analisi dell’azione dei prezzi, la conferma del trend e il filtraggio intelligente per generare segnali di acquisto e vendita ad alta probabilità, segnali di allerta e opportunità d
Atomic Analyst MT5
Issam Kassas
4.26 (39)
Questo prodotto è stato aggiornato per il mercato 2026 e ottimizzato per le ultime build di MT5. AVVISO DI AGGIORNAMENTO PREZZO: Atomic Analyst è attualmente disponibile a $99 . Il prezzo aumenterà a $199 dopo i prossimi 30 acquisti . OFFERTA SPECIALE: Dopo aver acquistato Atomic Analyst, inviami un messaggio privato per ricevere Smart Universal EA GRATIS e trasformare i tuoi segnali Atomic Analyst in operazioni automatiche. Atomic Analyst è un indicatore di trading Price Action non-repainting
L’indicatore evidenzia le zone in cui viene dichiarato interesse sul mercato , per poi mostrare la zona di accumulo degli ordini . Funziona come un book degli ordini su larga scala . Questo è l’indicatore per i grandi capitali . Le sue prestazioni sono eccezionali. Qualsiasi interesse ci sia nel mercato, lo vedrai chiaramente . (Questa è una versione completamente riscritta e automatizzata – non è più necessaria un’analisi manuale.) La velocità di transazione è un indicatore concettualmente nuo
Axiom Matrix
Issam Kassas
5 (3)
AXIOM MATRIX MT5 PREZZO DI LANCIO: $99 Axiom Matrix è disponibile al prezzo di lancio di $99. Il prezzo aumenterà a $199 dopo i primi 30 acquisti. Dopo il tuo acquisto, inviami un messaggio diretto per ricevere le istruzioni e richiedere il tuo bonus regalo esclusivo. Axiom Matrix è uno scanner di mercato professionale multi-simbolo e multi-timeframe, oltre a un pannello decisionale per MetaTrader 5. Scansiona il tuo Market Watch, analizza più timeframe, legge più motori di evidenza, confronta l
GoldenX Entry MT5
Kareem Abbas
5 (14)
GoldenX Entry è un indicatore per MT5 con un algoritmo adattivo Smart Entry Trend, un sistema di scoring dei segnali, un rilevatore del regime di mercato e un filtro di volatilità. Ogni segnale include un livello di ingresso calcolato, tre livelli di Take-Profit (TP1, TP2, TP3) e un livello di Stop-Loss. È costruito su più livelli analitici progettati per adattarsi a diverse condizioni di mercato, combinando un sistema analitico multilivello con un ottimizzatore integrato e un sistema di traccia
Presentazione       Quantum Breakout PRO   , l'innovativo indicatore MQL5 che sta trasformando il modo in cui scambi le zone di breakout! Sviluppato da un team di trader esperti con un'esperienza di trading di oltre 13 anni,       Quantum Breakout PRO       è progettato per spingere il tuo viaggio di trading a nuovi livelli con la sua strategia innovativa e dinamica della zona di breakout. Quantum Breakout Indicator ti fornirà frecce di segnalazione sulle zone di breakout con 5 zone target di
FX Trend MT5 NG
Daniel Stein
5 (6)
FX Trend NG: La Nuova Generazione di Intelligenza di Trend Multi-Mercato Panoramica FX Trend NG è uno strumento professionale di analisi del trend multi-timeframe e monitoraggio dei mercati. Ti consente di comprendere la struttura completa del mercato in pochi secondi. Invece di passare tra numerosi grafici, puoi identificare immediatamente quali strumenti sono in trend, dove il momentum sta diminuendo e dove esiste un forte allineamento tra i timeframe. Offerta di Lancio – Ottieni FX Trend NG
ARIPoint
Temirlan Kdyrkhan
1 (1)
ARIPoint is a powerful trading companion designed to generate high-probability entry signals with dynamic TP/SL/DP levels based on volatility. Built-in performance tracking shows win/loss stats, PP1/PP2 hits, and success rates all updated live. Key Features: Buy/Sell signals with adaptive volatility bands Real-time TP/SL/DP levels based on ATR Built-in MA Filter with optional ATR/StdDev volatility Performance stats panel (Success, Profit/Loss, PP1/PP2) Alerts via popup, sound, push, or email Cu
FX Power MT5 NG
Daniel Stein
5 (33)
FX Power: Analizza la Forza delle Valute per Decisioni di Trading Più Intelligenti Panoramica FX Power è lo strumento essenziale per comprendere la reale forza delle principali valute e dell'oro in qualsiasi condizione di mercato. Identificando le valute forti da comprare e quelle deboli da vendere, FX Power semplifica le decisioni di trading e rivela opportunità ad alta probabilità. Che tu segua le tendenze o anticipi inversioni utilizzando valori estremi di Delta, questo strumento si adatta
Advanced Supply Demand MT5
Bernhard Schweigert
4.53 (15)
La migliore soluzione per qualsiasi principiante o trader esperto! Questo indicatore è uno strumento di trading unico, di alta qualità e conveniente perché abbiamo incorporato una serie di funzionalità proprietarie e una nuova formula. Con questo aggiornamento, sarai in grado di mostrare fusi orari doppi. Non solo potrai mostrare una TF più alta, ma anche entrambe, la TF del grafico, PIÙ la TF più alta: SHOWING NESTED ZONES. Tutti i trader di domanda di offerta lo adoreranno. :) Informazioni imp
Questo prodotto è stato aggiornato per il mercato 2026 e ottimizzato per le ultime build di MT5. AVVISO DI AGGIORNAMENTO PREZZO: Smart Price Action Concepts è attualmente disponibile a $200 . Il prezzo aumenterà a $299 dopo i prossimi 30 acquisti . OFFERTA SPECIALE: Dopo l’acquisto, inviami un messaggio privato per ricevere un bonus gratuito + regalo . Prima di tutto, vale la pena sottolineare che questo strumento di trading è un indicatore non-repainting, non-redrawing e non-lagging, il che lo
Crystal Heikin Ashi Signals
Muhammad Jawad Shabir
5 (2)
Crystal Heikin Ashi Signals - Professional Trend & Signal Detection Indicator Advanced Heikin Ashi Visualization with Intelligent Signal System for Manual & Automated Trading Final Price: $149 ---------> Price goes up $10 after every 10 sales . Limited slots available — act fast . Overview Crystal Heikin Ashi Signals is a professional-grade MetaTrader 5 indicator that combines pure Heikin Ashi candle visualization with an advanced momentum-shift detection system. Designed for both manual traders
Reversion King Indicator
Eugen-alexandru Zibileanu
5 (5)
Un nuovo Re in città - Indicatore + Gestione ordini (TP1 + TP2 + TP3) + Invio opzionale di segnali Telegram INCLUSO (GRATIS) (SISTEMA COMPLETO DI TRADING e SEGNALI) Il nostro miglior EA per l’Oro: Gold Slayer Questo indicatore include una strategia avanzata, un sistema di trading con gestione ordini personalizzabile e un sistema mean reversion che combina estensioni di envelope, supportato da molteplici filtri intelligenti di conferma come RSI per individuare ingressi di inversione ad alta proba
Quantum TrendPulse
Bogdan Ion Puscasu
5 (25)
Ecco   Quantum TrendPulse   , lo strumento di trading definitivo che combina la potenza di   SuperTrend   ,   RSI   e   Stocastico   in un unico indicatore completo per massimizzare il tuo potenziale di trading. Progettato per i trader che cercano precisione ed efficienza, questo indicatore ti aiuta a identificare con sicurezza le tendenze di mercato, i cambiamenti di momentum e i punti di entrata e uscita ottimali. Caratteristiche principali: Integrazione SuperTrend:   segui facilmente l'andame
Meridian Pro
Ottaviano De Cicco
5 (2)
Meridian Pro 2.00: Professional Multi-Timeframe Trend Matrix for MT5 Meridian Pro 2.00 is a professional adaptive trend matrix for MetaTrader 5. It combines the original Meridian trend engine, a clean chart ribbon, closed-bar signal arrows, an 8-timeframe dashboard, Fuel momentum, weighted consensus, synthetic HTF processing and chart-native higher-timeframe context lines. The goal is simple: read current trend, multi-timeframe structure, strength, momentum and EA-ready state from one discipline
Atbot
Zaha Feiz
4.69 (54)
AtBot:  Come funziona e come usarlo ### Come funziona L'indicatore "AtBot" per la piattaforma MT5 genera segnali di acquisto e vendita utilizzando una combinazione di strumenti di analisi tecnica. Integra la Media Mobile Semplice (SMA), la Media Mobile Esponenziale (EMA) e l'indice di Gamma Vero Medio (ATR) per identificare opportunità di trading. Inoltre, può utilizzare le candele Heikin Ashi per migliorare la precisione dei segnali. Lascia una recensione dopo l'acquisto e ricevi un regalo bon
Azimuth Pro
Ottaviano De Cicco
5 (7)
Azimuth Pro V2: Synthetic Fractal Structure and Confirmed Entries for MT5 Overview Azimuth Pro is a multi-level swing structure indicator by Merkava Labs . Four nested swing layers, swing-anchored VWAP, ABC pattern detection, three-timeframe structural filtering, and closed-bar confirmed entries — one chart, one workflow from micro-swings to macro-cycles. This is not a blind signal product. It is a structure-first workflow for traders who care about location, context, and timing. ️ Summer Sale
Trend Forecaster
Alexey Minkov
5 (8)
Trend Forecaster is a MetaTrader 5 indicator that combines breakout signals, possible reversal area analysis, market range data and a visual statistics panel in one chart workspace. It shows Buy and Sell signals, tracks Average Range and Current Range, and can automatically adjust Sensitivity for the current symbol and timeframe. Manual Sensitivity control is also available. The indicator can be used on Forex pairs, metals, stocks, indices and cryptocurrencies. Different timeframes are supported
Gem SIGNAL
Shengzu Zhong
5 (1)
GEM Signal Pro GEM Signal Pro è un indicatore trend-following per MetaTrader 5, progettato per i trader che desiderano segnali più chiari, configurazioni operative più strutturate e una gestione del rischio più pratica direttamente sul grafico. Invece di mostrare solo una semplice freccia, GEM Signal Pro aiuta a presentare l’intera idea di trading in modo più chiaro e leggibile. Quando le condizioni sono confermate, l’indicatore può mostrare sul grafico il prezzo di ingresso, lo stop loss e gli
Altri dall’autore
This indicator is designed for M1 timeframe and shows: Sum of points when the price goes up (Green Histogram). Sum of points when the price goes down (Red Histogram).  In other words, by the number and ratio of bullish points to bearish ones, you can do a technical analysis of the state of the market. If the green histogram prevails over the red one, you can conclude that at the moment the buyers are stronger than the sellers, and vice versa, if the red histogram prevails over the green, the se
This Multi TimeFrame indicator is based on the "Fractals" classical indicator. 2 Inputs: TimeFrame1; TimeFrame2; You can put any available TimeFrame values (from M1 (Period_M1) to MN1 (Period_MN1)) equal or greater ( >= ) than the Period of the current Time Frame. The last Fractals will shown as color lines (Dots Line) of Support and Resistance for the Price moving.
This is a Multi-Time indicator which allows to display RSI and Stochastic indicators from upper timeframes on a single chart. As an example: a single chart EURUSD M5 and RSI (blue line) and Stochastic (yellow line) from H1. Red Histogram is representing Lower trend and Green Histogram is representing Upper trend.
When you put this Multi TimeFrame Parabolic SAR indicator on the chart it will automatically use Parabolic SAR from next available 3 timeframes. Green arrow will show the beginning of Up trend and Red arrow will show the beginning of Down trend. If AlertsEnabled = true, the indicator will show the Alert (message window) with a text like this: "Price going Down on ", Symbol(), " - ", Period(), " min", " price = ", Bid; If eMailEnabled = true the Indicator will send you an eMail with the same text
The zero line is characterized the Flat trend. V-shaped impulse indicates the entrance to the opposite direction. U-shaped impulse = entry orders in the same direction. If AlertsEnabled = true, the indicator will show the Alert (message window) with a text like this: "Price going Down on ", Symbol(), " - ", Period(), " min", " price = ", Bid; If eMailEnabled = true the indicator will send you an eMail with the same text an Alert message with subject: "Trinity-Impolse" (of course you have to chec
The indicator displays the usual Moving Average with input parameters: maPeriod_1; maMethod_1; maAppPrice_1. Then it calculates and displays MA on MA1 with input parameters: maPeriod_2; maMethod_2. Then it calculates and displays MA on MA2 with input parameters: maPeriod_3; maMethod_3. If AlertsEnabled = true the Indicator will show the Alert (message window) with a text like this: "Price going Down on ", Symbol(), " - ", Period(), " min", " price = ", Bid; If eMailEnabled = true the Indicator w
Multi TimeFrame Indicator "MTF CCI Trigger" based on the Commodity Channel Index from the upper TF (input parameter "TimeFrame") yellow line. Aqua line is representing ATR envelopes from the current TF. Green and Red arrows is triggered by CCI and represented UP and DOWN trends accordingly.
The BBImpulse indicator is based on the standard Moving Average indicator. You have MA input parameters: maPeriod - Moving Average period; maMODE - Moving Average mode (0 = MODE_SMA; 1 = MODE_EMA; 2 = MODE_SMMA; 3 = MODE_LWMA); maPRICE - Applied price (0=PRICE_CLOSE; 1=PRICE_OPEN; 2=PRICE_HIGH; 3=PRICE_LOW; 4=PRICE_MEDIAN; 5=PRICE_TYPICAL; 6=PRICE_WEIGHTED). Green Histogram is representing an UP-trend, Red Histogram is representing a Down-trend.
Multi TimeFrame indicator MTF ADX with Histogram shows ADX indicator data from the TF by your choice. You may choose a TimeFrame equal or greater than current TF. Yellow line is representing a price trend from the upper TF. Green line is representing +DI from the upper TF. Red line is representing -DI from the upper TF. Green histogram is displaying an Up-trend. Red histogram is displaying a Down-trend.
This Indicator creates 2 white lines based on Exponential Moving Averag e of High and Low prices. You can regulate how many bars will be involved in the calculation with input parameter HL_Period. Red and Blue arrows are displaying the moment to go Short and Long trades accordingly.
The most common way to interpreting the price Moving Average is to compare its dynamics to the price action. When the instrument price rises above its Moving Average, a buy signal appears, if the price falls below its moving average, what we have is a sell signal. To avoid a spontaneous entries one may use this update from Moving Average Indicator = Stepper-MA.
Envelopes technical Indicator is formed with two Moving Averages one of which is shifted upward and another one is shifted downward. Envelopes define the upper and the lower margins of the price range. Signal to sell appears when the price reaches the upper margin of the band; signal to buy appears when the price reaches the lower margin. To avoid a spontaneous entries one may use this update from Envelopes Indicator = Envelopes-Stepper.
The interpretation of the Bollinger Bands is based on the fact that the prices tend to remain in between the top and the bottom line of the bands. Abrupt changes in prices tend to happen after the band has contracted due to decrease of volatility; If prices break through the upper band, a continuation of the current trend is to be expected; If the pikes and hollows outside the band are followed by pikes and hollows inside the band, a reverse of trend may occur; The price movement that has starte
Fibonacci sequence is defined by integer sequence: 0, 1, 1, 2, 3, 5, 8, 13, 34, 55, 89, 144, ... By definition, it starts from 0 and 1, the next number is calculated as a sum of two previous numbers. Instead of the standard moving average, the indicator uses the caluclation of average price in form: Bar0 + Bar1 + Bar2 + Bar3 + Bar5 + Bar8 + Bar13 +... Input parameters:  FiboNumPeriod (15) - Fibonacci period; nAppliedPrice (0) - applied price (PRICE_CLOSE=0; PRICE_OPEN=1; PRICE_HIGH=2; PRICE_LOW=
This indicator present a main Moving Average line with input parameters maPeriod_1, maMethod_1 and maAppPrice_1. The second line will be a calculation of the Moving Average data of a first line with input parameters maPeriod_2, maMethod_2. The third line will be a calculation of the Moving Average data of a second line with input parameters maPeriod_3, maMethod_3. To avoid a spontaneous entries one may use this indicator-stepper.
This indicator (as almost all others) is based on classical Moving Averages. It shows the Average Bar under the current bar colored in aqua or over the current bar colored in orange. Input Parameters: ma_Period and ma_Method. The Average Bar maybe helpful to predict where the price will move in the nearest future. Of course, this "near future" depends of the current time frame.
Buy when the market is falling and sell when the market is rising. When the market is moving down you start observing and looking for buy signals. When the market is moving up you start looking for sell signals. This indicator points to the moments to Buy (Blue arrow) and to Sell (Orange arrow). Two input parameters: barsNumber and step for optimization (depending on symbol and Time Frame).
This indicator shows: A green light in case the price goes up; A red light in case the price goes down; A yellow light in case there are a sideways trend. A sideways trend is the horizontal price movement that occurs when the forces of supply and demand are nearly equal. This typically occurs during a period of consolidation before the price continues a prior trend or reverses into a new trend
This indicator is created for M1 timeframe. It shows how many ticks has occurred during current minute and ( after the slash) the sum of points Up (aqua color) and Down (orange color). In times of a high trading activity a grow up number of ticks Up and Down will signal of a big move of the price in the near future. In times of a high trading activity a grow up number of sum of points Up and Down will signal of a big move of the price in the near future too.
Two yellow lines. This is similar to classical Envelopes but with automatic deviation. The Envelopes indicator is   a tool that attempts to identify the upper and lower bands of a trading range. Aqua line. This is a classical Commodity Channel Index added to the Envelopes on the chart, not in a separate window. The Commodity Channel Index ( CCI ) is a technical   indicator   that measures the difference between the current price and the historical average price.
Probability deals with the likelihood of an event happening.   Forex   probability indicates a possibility at a specific time. This is because the forex market is highly volatile, and predicting future events affecting it is impossible. This indicator will show a positive number above the current High or negative number under the current Low as a probability of the trend. Higher time frames usually show a higher probability, even more then 100%.
Envelopes is an excellent indicator when the market is trending. Open Long position when the ClosePrice crossed the upper Aqua band. Close Long position when the Price crossed the upper Yellow band moving down. Open Short position when the ClosePrice crossed the lower Aqua band. Close Short position when the Price crossed the lower Yellow band moving up.
Moving Average Bars is a self-explanatory indicator with one input parameter: nPeriod. When the previous Price Close is above the previous indicator Bar, the probability to go Long is very high.   When the previous Price Close is under the previous indicator Bar, the probability to go Short is very high.
This indicator is based on the same idea as https://www.mql5.com/en/market/product/2406 , but instead of Average Bars it uses series or Fibonacci sequence. When the previous Price Close is above the previous indicator Bar, the probability to go Long is very high. When the previous Price Close is under the previous indicator Bar, the probability to go Short is very high.
This indicator is based on two ideas: Correlations between 5 main currency pairs: EURUSD, GBPUSD, USDCHF, USDJPY, USDCAD; US Dollar Index = the value of the United States dollar relative to a basket of foreign currencies. The use of the indicator is the same as classical  Commodity Channel Index  (CCI) indicator. CCI is calculated with the following formula:  (Typical Price - Simple Moving Average) / (0.015 x Mean Deviation) (Typical Price - Simple Moving Average) / (0.015 x Mean Deviation)
A  tick  is a measure of the minimum upward or downward movement in the  price  of a security. A  tick  can also refer to the change in the  price  of a security from one trade to the next trade.  This indicator will show amounts of ticks when the price goes up and down. This indicator is designed for M1 time frame and shows: Sum of points when the price goes up (Green Histogram). Sum of points when the price goes down (Red Histogram). 
This indicator is a combination of 2 classical indicators MA and RVI. The Relative Vigor Index (RVI) is a momentum indicator used in technical analysis that measures the strength of a trend by comparing a security's closing price to its trading range while smoothing the results using a simple moving average   The input parameter  counted_bars  determines how many bars the indicator's lines will be visible. The input parameter MaRviPeriod  is used for MA and RVI calculation.
This indicator is a combination of 2 classical indicators: MA and Force Index. The input parameter  counted_bars  determines on how many bars the indicator lines will be visible. The input parameter  MaForcePeriod  is used for MA and Force calculation. You may go Long if the current price crossed Up the Ribbon (HISTOGRAM)  and you may go Short if the current price crossed Down the Ribbon (HISTOGRAM)
This indicator is a combination of 2 classical indicators: MA and CCI. Two moving averages form Upper and Lower bands. The input parameter  counted_bars  determines on how many bars the indicator's lines will be visible. The input parameter  barsNum  is used for MA and CCI calculation.
This indicator is using 2 classical indicators: Commodity Channel Index from the higher TF (which you may change using input parameter TimeFrame ) and Average True Range from the current TF. The Green ribbon indicates the upper trend and the Red ribbon indicates the down trend. Buy when the Yellow line crosses the Upper bound (Aqua line). Sell when the Yellow line crossover the Lower bound (Aqua line).
Filtro:
Nessuna recensione
Rispondi alla recensione