Opposite Prices CD LTB
- Indicadores
- Versión: 1.32
- Actualizado: 24 julio 2024
- Activaciones: 7

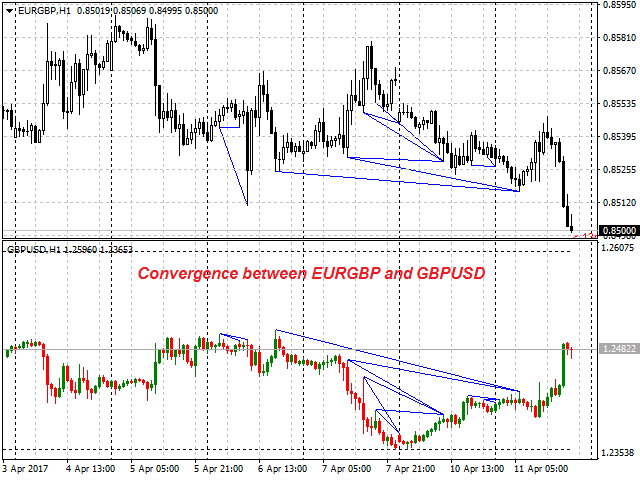
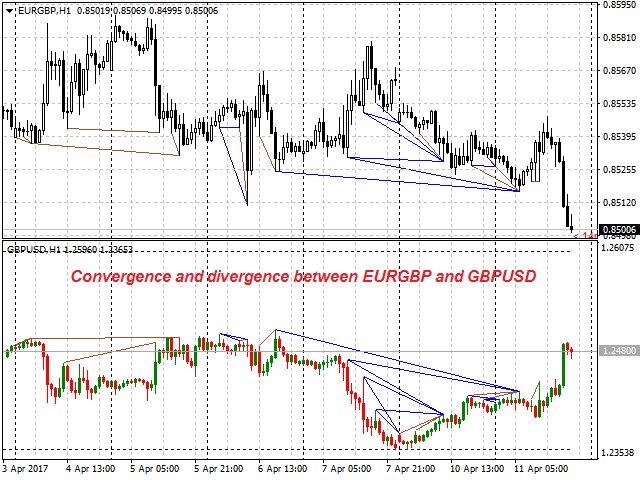
OP CD LTB (Opposite Prices Convergence/Divergence Low Top Bottom) es un indicador de convergencia/divergencia del sentimiento alcista entre los instrumentos financieros reflejados. El indicador es la segunda de las dos versiones posibles (LBT y LTB) de los orígenes de convergencia/divergencia alcista.
El uso múltiple del indicador permite encontrar convergencias/divergencias entre el precio del instrumento financiero principal y cualquier otro instrumento financiero simultáneamente.
Los usuarios pueden seleccionar el símbolo gráfico de venta y su anchura, así como el color de las líneas de convergencia/divergencia.
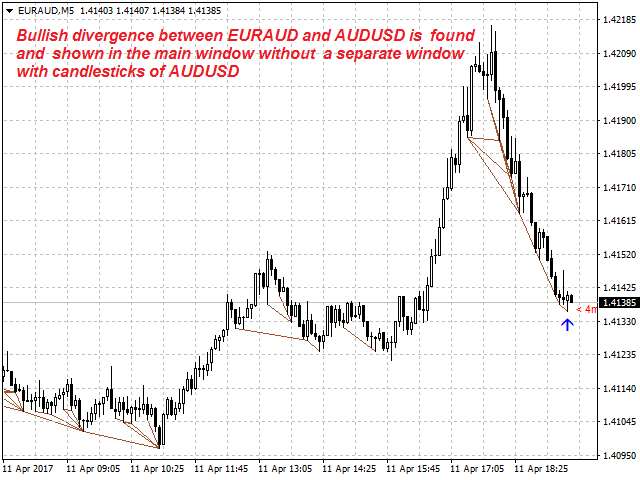
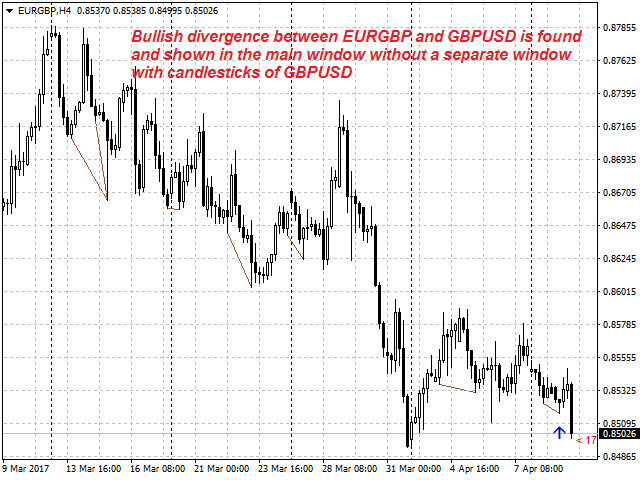
El indicador no es retardado. Funciona por ticks y es capaz de mostrar la convergencia/divergencia en la ventana del símbolo incluso si no hay una ventana separada con un instrumento financiero diferente utilizado para la búsqueda. Esto le permite abrir ventanas adicionales con cualquier otro indicador para un análisis conjunto.
Como opción, el indicador puede notificar una nueva señal utilizando el símbolo gráfico de venta en lugar de las líneas de convergencia/divergencia.
En la mayoría de los casos, la convergencia/divergencia se considera confirmada si adopta la forma de una línea con un símbolo gráfico que permanece en el gráfico.
¡La búsqueda de una convergencia/divergencia en un instrumento financiero significa encontrar los niveles de soporte/resistencia!
Atención: Dado que el indicador se descarga, los símbolos gráficos se muestran en la ventana principal sólo después de que aparezca una nueva señal de convergencia/divergencia (a diferencia de las líneas de convergencia/divergencia). Los símbolos gráficos no se muestran para los periodos pasados (antes de que se descargara el indicador).
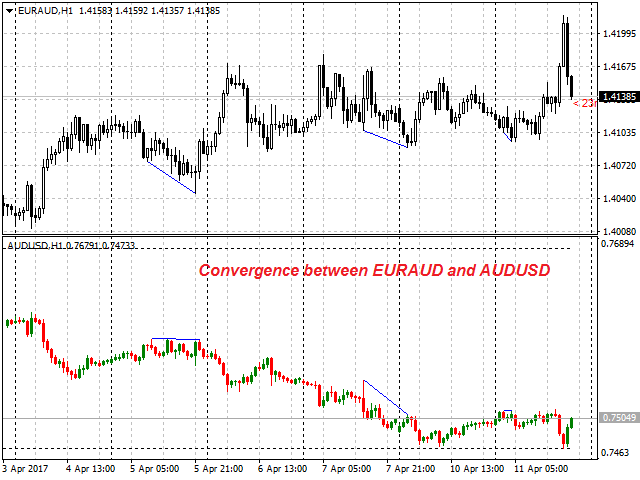
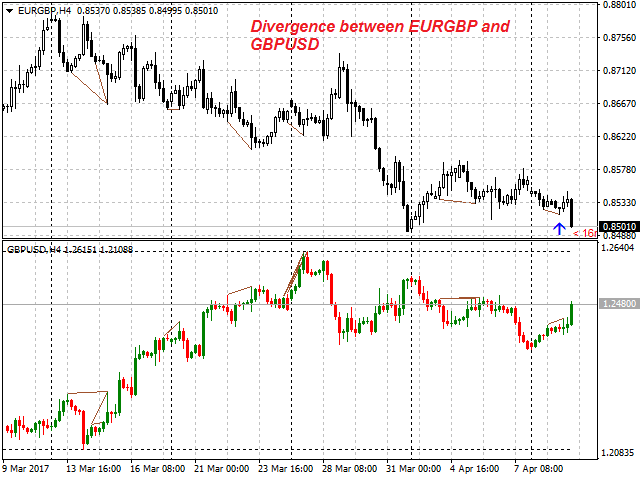
Para trazar las líneas de convergencia/divergencia en la ventana adicional, el indicador identifica cualquiera de los once indicadores personalizados (véanse los parámetros de entrada), si los hay.
El indicador puede notificar la aparición de una señal formada reproduciendo una señal de audio o enviando un correo electrónico.
Ejemplo de notificación por correo electrónico:
- Asunto: Señal CD LTB de precios opuestos;
- Mensaje: Señal,H1 - Divergencia alcista entre EURAUD y AUDUSD - 2014.08.17 10:25:00.
Propósito
El indicador se puede utilizar para el comercio manual o automatizado dentro de un Asesor Experto. Para el trading automatizado, utilice el búfer del indicador de tipo doble:
- Señal de venta - buffer 0, no debe ser cero.
Parámetros de entrada
- Currency_Name - nombre del instrumento financiero;
- Bars_Number - número de barras para el cálculo;
- Base_Indicator - código del indicador base(este parámetro se activa sólo si hay un indicador personalizado):
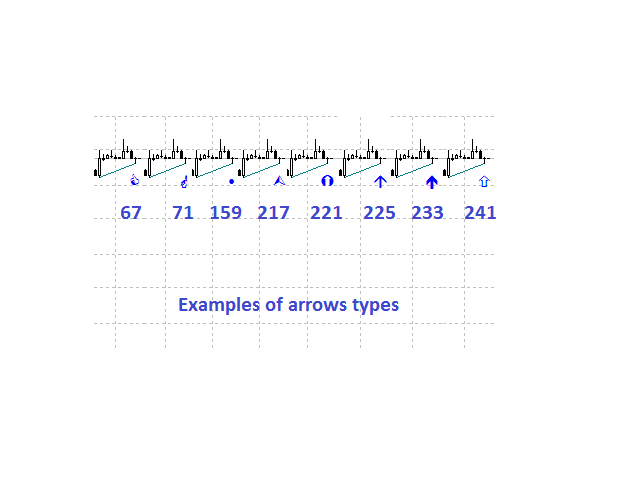
- Arrow_Symbol - tipo de símbolo gráfico de venta (reconoce uno de los ocho símbolos, véase la captura de pantalla);
- Arrow_Width - ancho del símbolo gráfico (valores permitidos - 1, 2, 3, 4, 5);
- Sound_Mail_Numbers - número de notificaciones de audio y correo electrónico en las dos últimas barras;
- DrawLine - visualización de la línea de convergencia/divergencia.
- true - dibuja las líneas (por defecto);
- false - no dibujar las líneas.
- Convergencia - cálculo de la convergencia o divergencia:
- true - convergencia (por defecto);
- false - divergencia.
- Ideal_Searching - búsqueda de convergencia/divergencia en condiciones no ideales:
- true - condiciones de búsqueda ideales (por defecto);
- false - condiciones de búsqueda no ideales.
- Play_Sound - habilitar las notificaciones de sonido;
- Show_Time - mostrar el tiempo restante hasta la formación de la barra actual;
- Send_Mail - enviar una notificación por correo electrónico;
- ConvLevelColor_1 - color de la línea de convergencia en la ventana principal;
- ConvLevelColor_2 - color de la línea de convergencia en la ventana adicional;
- DivLevelColor_1 - color de la línea de divergencia en la ventana principal;
- DivLevelColor_2 - color de la línea de divergencia en la ventana adicional.
Recomendaciones
Antes de utilizar el indicador, es necesario actualizar los datos históricos de los instrumentos financieros.