Moving Envelopes MT5
- Indicadores
- Versión: 2.5
- Actualizado: 19 noviembre 2021
- Activaciones: 5

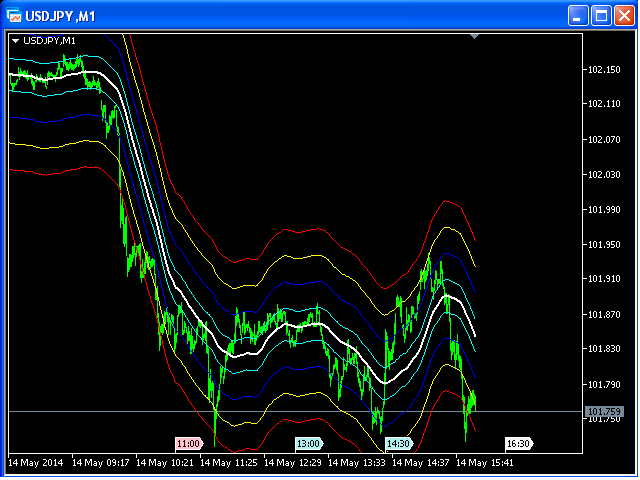
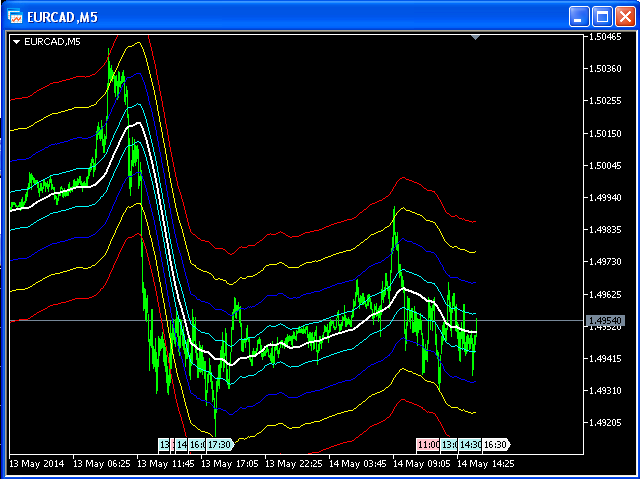
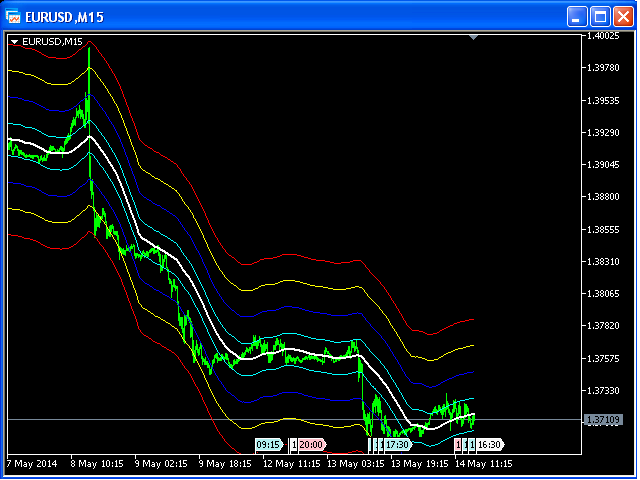
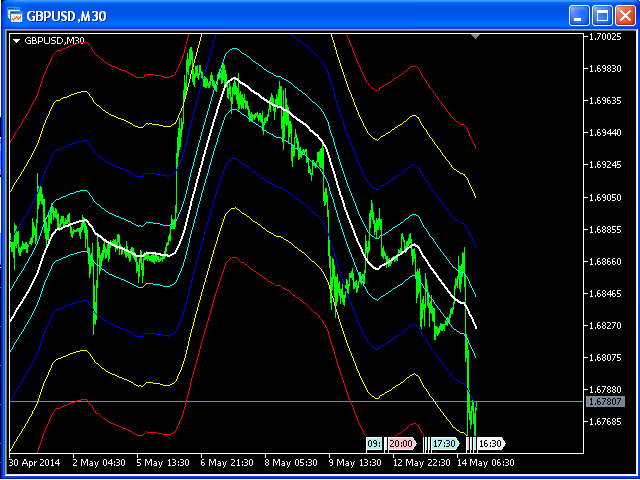
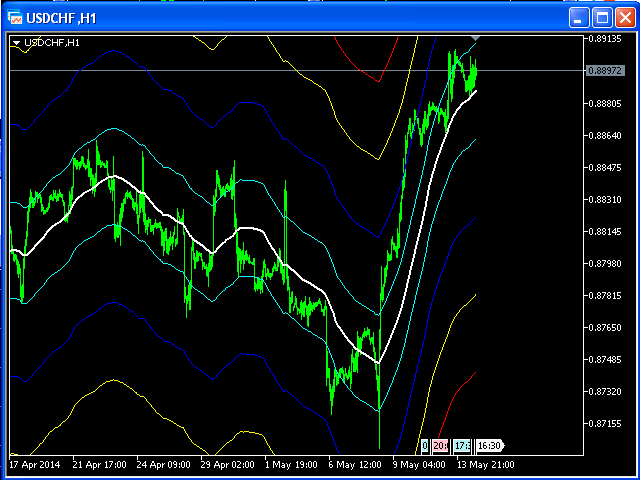
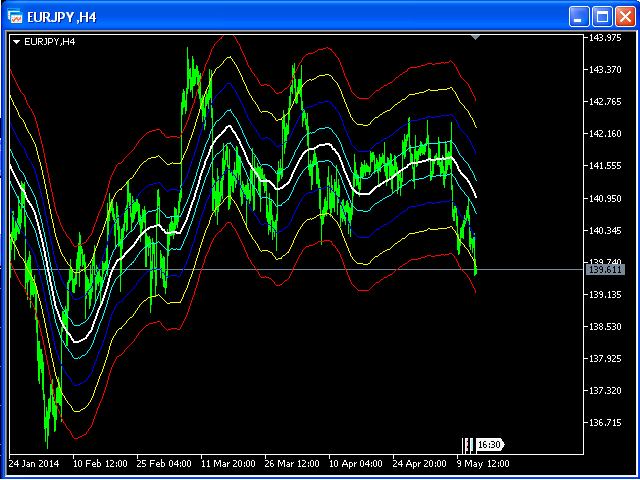
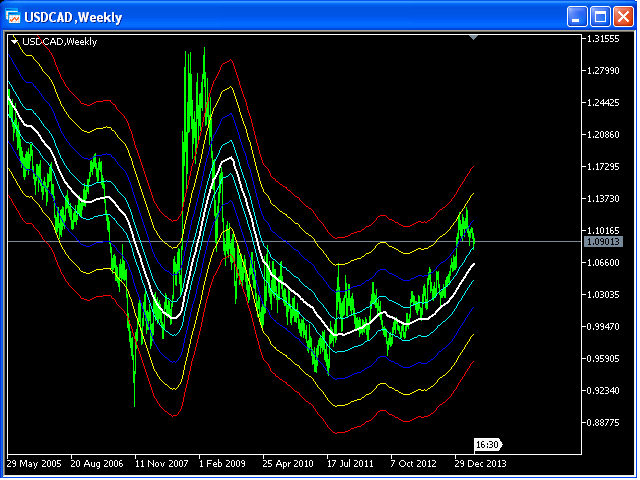
Un operador optimista puede entrar en el mercado cuando el precio cruce la línea azul.
Una entrada más fiable será cuando el precio cruce la línea amarilla.
Cuando el precio vuelva y cruce la línea roja, podrá abrir una posición en el curso de los movimientos del precio.
Si el precio se mueve entre las líneas aqua, manténgase fuera del mercado.