Four Bands
- Indicadores
- Versión: 4.5
- Actualizado: 20 noviembre 2021
- Activaciones: 5

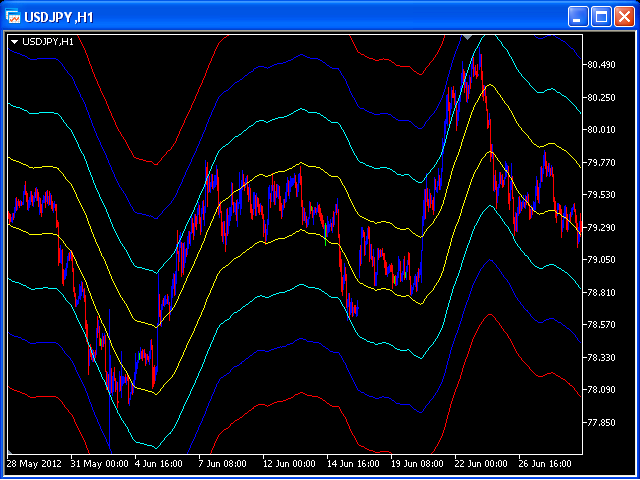
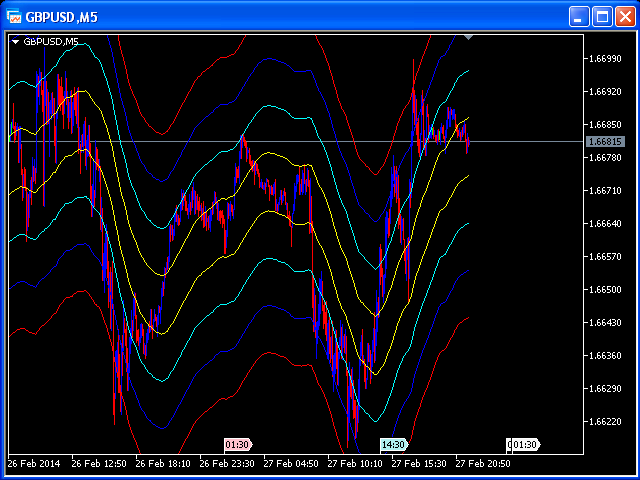
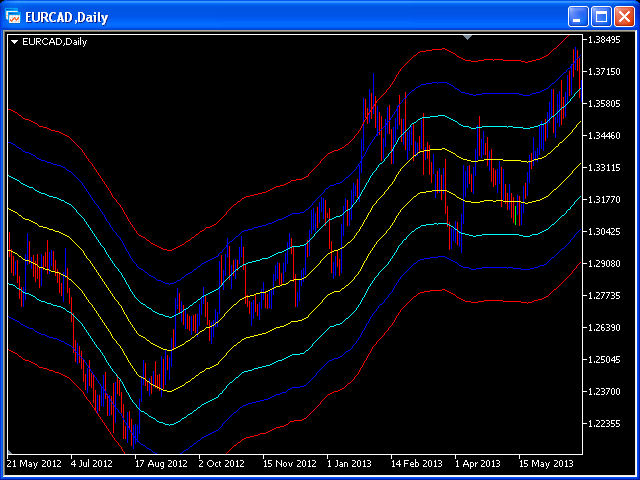
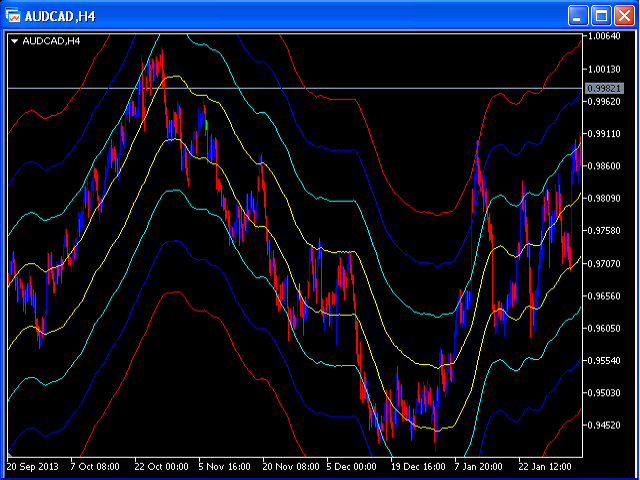
Un operador optimista puede entrar en el mercado cuando el precio cruce la línea Aqua.
Una entrada más fiable será cuando el precio cruce la línea Azul.
Cuando el precio vuelva y cruce la línea Roja, podrá abrir una posición en el curso de los movimientos del precio.