Moving Envelopes MT5
- Indikatoren
- Version: 2.5
- Aktualisiert: 19 November 2021
- Aktivierungen: 5

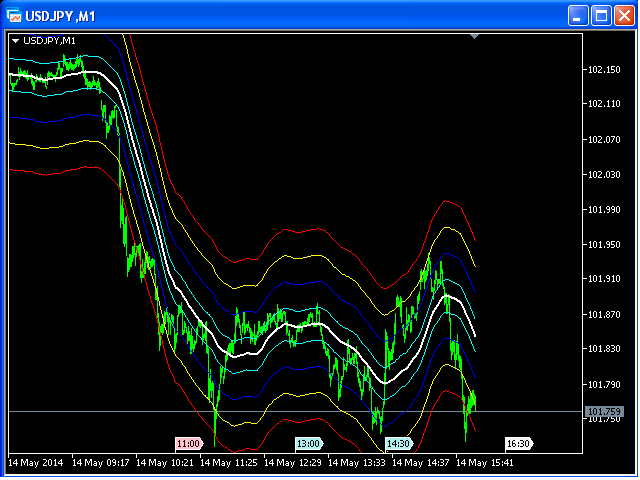
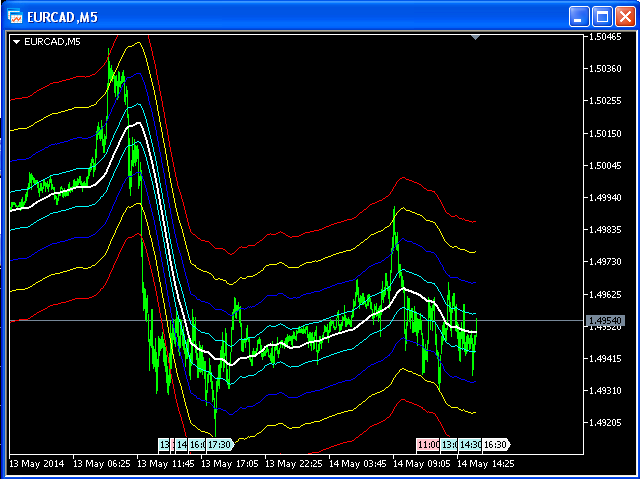
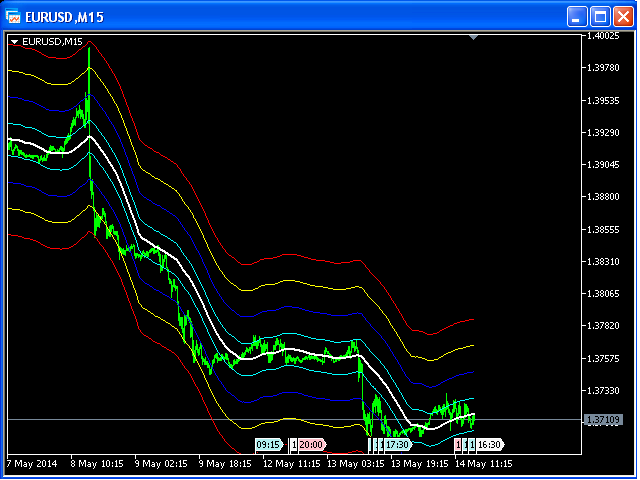
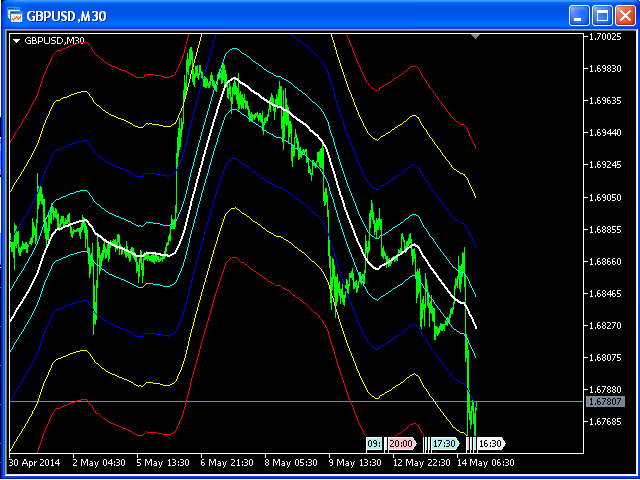
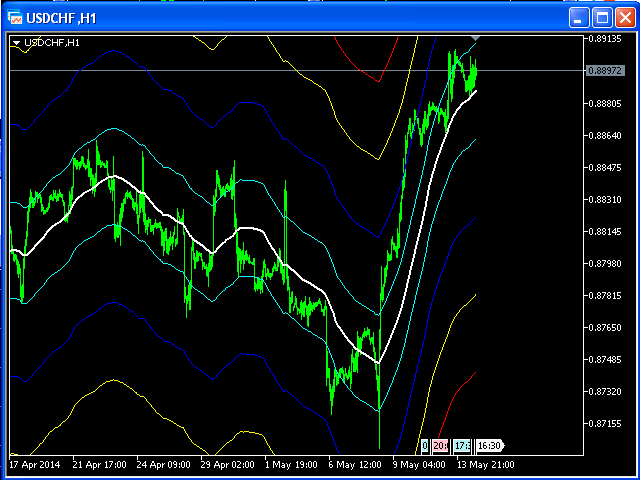
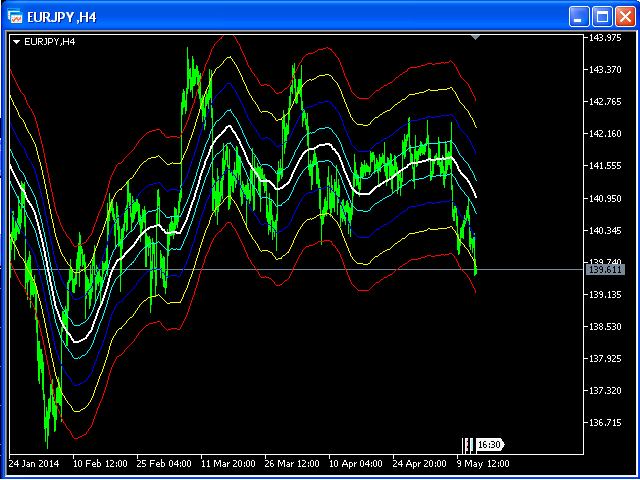
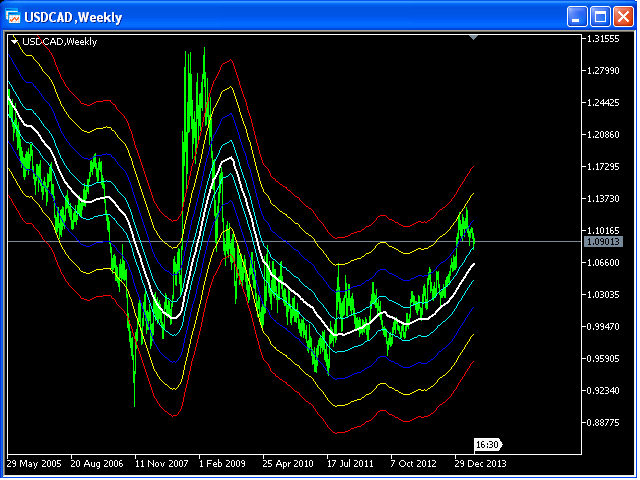
Optimistische Händler können in den Markt einsteigen, wenn der Kurs die blaue Linie überschreitet.
Zuverlässiger ist der Einstieg, wenn der Kurs die gelbe Linie überquert.
Wenn der Kurs zurückkommt und die rote Linie überquert, können Sie im Zuge der Kursbewegungen eine Position eröffnen.
Bewegt sich der Kurs zwischen den blauen Linien, sollten Sie sich vom Markt fernhalten.