Quantum Currency Matrix Indicator
- Indicadores
- Versión: 5.0
- Actualizado: 6 enero 2025
- Activaciones: 5

De los cuatro principales mercados de capitales, el mundo de las operaciones con divisas es el más complejo y difícil de dominar, a menos que se disponga de las herramientas adecuadas. La razón de esta complejidad no es difícil de entender.
En primer lugar, las divisas se negocian por pares. Cada posición es un juicio de las fuerzas que mueven dos mercados independientes. Si el GBP/USD, por ejemplo, es alcista, ¿se debe a la fortaleza de la libra o a la debilidad del dólar estadounidense? Imaginemos que tuviéramos que hacer lo mismo con las acciones, por ejemplo. Pensemos en Google frente a Amazon. Si este "par" subiera, ¿se debería a la fortaleza de Google o a la debilidad de Amazon? Casi imposible de analizar.
Para agravar este problema, cada divisa puede comprarse o venderse contra una miríada de otras divisas. Si el GBP/USD vuelve a ser alcista, ¿está la libra esterlina fuerte frente a las demás divisas principales, como el GBP/JPY, el GBP/CAD, el EUR/GBP, etc.? Si es así, entonces esto es claramente una señal de que la libra esterlina está siendo comprada universalmente en el mercado. Del mismo modo, en el caso del dólar estadounidense, si se vende universalmente en pares como el USD/CAD, el USD/JPY y otros, entonces podemos suponer que el GBP/USD está subiendo como resultado de la fuerte compra de la libra esterlina a nivel universal y de la fuerte venta del dólar estadounidense en todo el mercado.
Por último, llegamos al tercer problema, que es tratar de evaluar la fuerza de esta compra o venta. Después de todo, una divisa puede estar sobrecomprada (fuerte) o sobrevendida (débil), pero ¿cuán fuerte es fuerte y cuán débil es débil?
Considere esto por un momento. Supongamos que ha decidido comprar GBP/USD y dispone de la siguiente información para ayudarle en su análisis:
- Si la GBP también se está comprando en todos los demás pares de divisas cruzados.
- Si el USD también se está vendiendo en todos los demás pares de divisas principales
- La fuerza relativa de compra en el par GBP/USD
El éxito en las operaciones consiste en evaluar el riesgo y la probabilidad de éxito en cada operación. ¿Esta información le daría una posición de riesgo alto, medio o bajo? Y la respuesta......... es una oportunidad de negociación de bajo riesgo. Después de todo, ahora está tomando una posición basada en una visión del mercado.
- En primer lugar, si está basando su decisión en la compra o venta universal de una divisa, entonces está operando con todo el peso del mercado, y no sólo en el análisis de un par de divisas: es de bajo riesgo.
- En segundo lugar, si conoce la fuerza relativa de esta compra o venta frente a todos los demás pares de divisas, entonces esto le da la imagen completa - si es fuerte, entonces de nuevo - es de bajo riesgo.
- En tercer y último lugar, si usted sabe lo que la moneda de contrapartida también está haciendo en términos de fuerte o débil, a continuación, una vez más, si es fuerte - es de bajo riesgo.
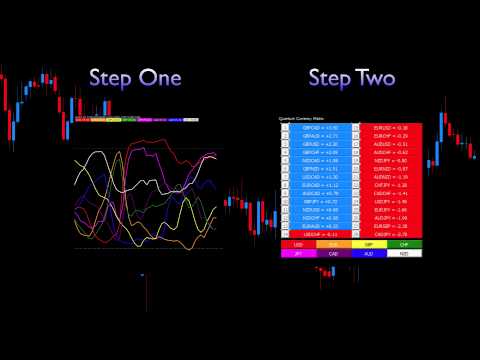
Aquí es donde entra en juego la matriz de divisas Quantum. Proporciona la solución a los tres problemas en un indicador elegante, y es un indicador complementario al indicador de fuerza de divisas Quantum. Le muestra el panorama completo de todo el mercado en una matriz sencilla, que funciona en todos los plazos, desde 1 minuto hasta 1 mes.
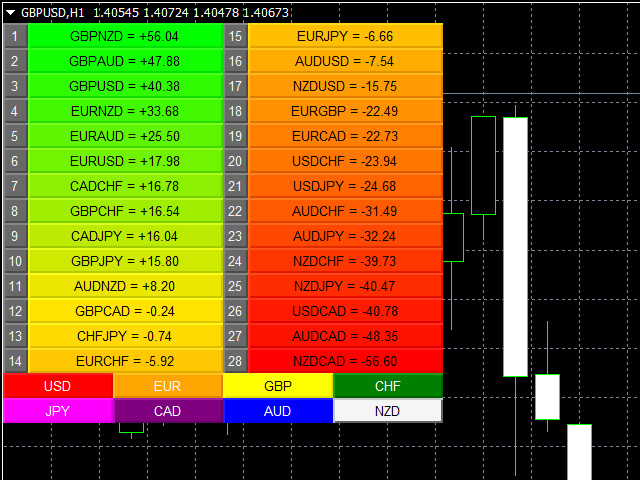
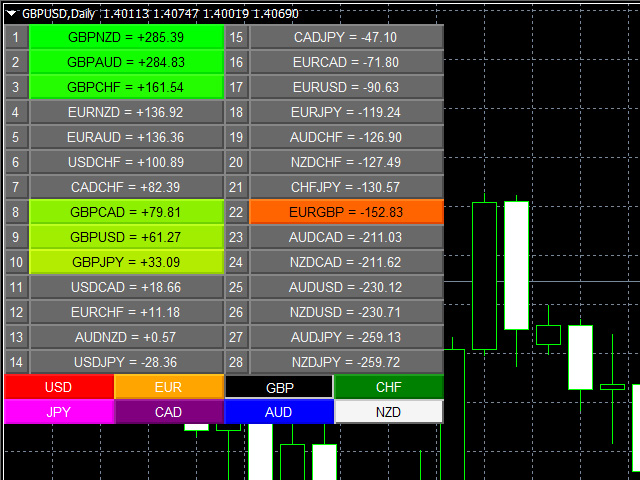
De las ocho divisas principales surgen los 28 pares de divisas que se muestran en una tabla, con sus puntuaciones de fuerza relativa, actualizadas segundo a segundo y minuto a minuto. Una puntuación superior a 0,00 indica un impulso alcista y se muestra en tonos verdes, mientras que una puntuación inferior a 0,00 indica un impulso bajista y se muestra en tonos rojos.
Cada divisa puede aislarse para mostrar los 7 pares asociados y sus puntuaciones relativas. Si todos los pares asociados están mostrando una fuerza similar (ya sea alcista o bajista), entonces es un buen momento para unirse al movimiento o, alternativamente, puede ser una oportunidad para esperar un cambio de tendencia, ya que el par se vuelve sobrecomprado o sobrevendido.
La matriz de divisas Quantum le proporciona la herramienta para ver las complejidades del mercado de divisas en tiempo real a través de todos los pares relacionados, junto con la fuerza de la compra y la venta. Si bien es posible hacer esto manualmente utilizando múltiples gráficos, lo que una matriz manual no proporcionará es ninguna medida de la fuerza relativa. El indicador lo hace por usted de forma automática, considerando la acción del precio en todos los pares de divisas relacionados y, a continuación, derivando las puntuaciones de fuerza relativa en consecuencia.
El usuario no ha dejado ningún comentario para su valoración