Wedge Breakage Signaling
- Indicateurs
- Version: 4.10
- Mise à jour: 29 décembre 2020
- Activations: 5

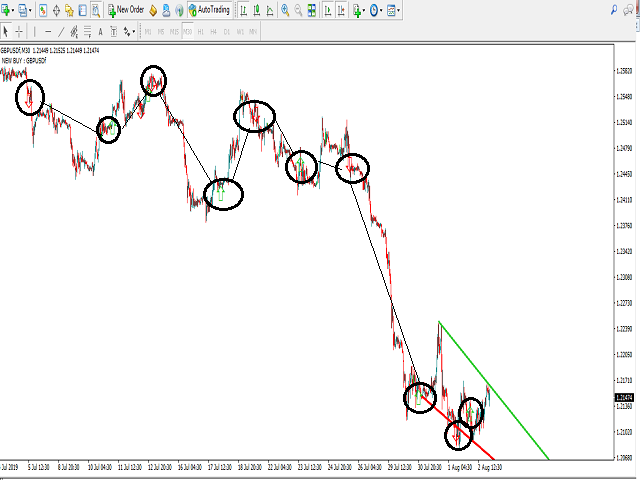
Automatic redrawing of Trend Supports and resistances levels and Possible Wedge pattern formation
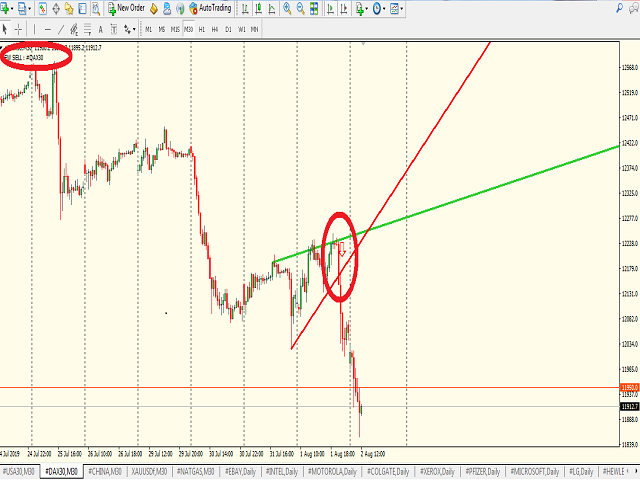
to indicate price breaking of Rising Wedge (signal SELL)
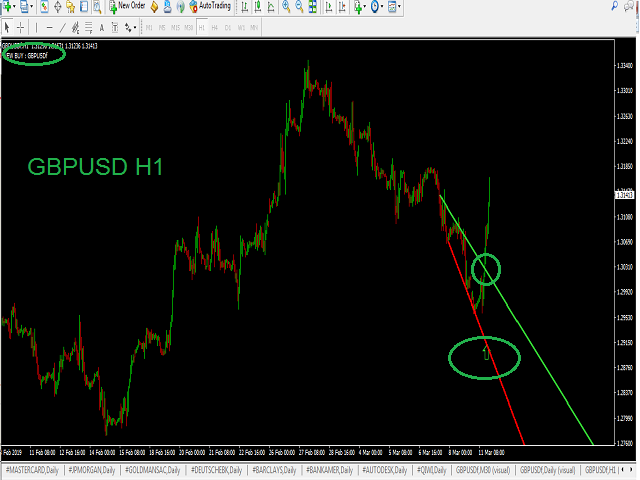
or price breaking of falling Wedge (signal BUY)
Very simple and smart indicator
ALERTS AND MOBILE NOTIFICATIONS availavle !!!
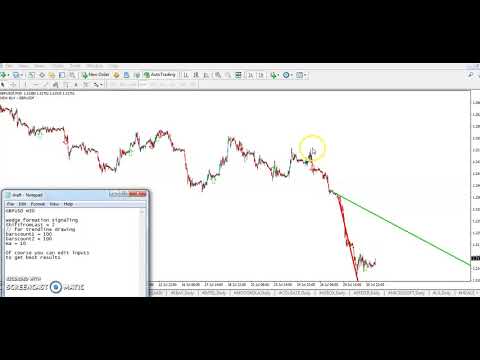
you can edit the calculation bars of the bars count for formation of the trend lines and the initial shift from current price
Smaller values for bars /shift inputs when using Higher Time frames (D1-H4) and the reverse higher values for lower time frames (M30-M5)
Also a comment displayed on to corner of chart indicating Sell/Buy possibilities and
an Arrow UP/Down in case of Bear/Bull market opportunities
also disable/enable comments
indicating the numbers of count up to tick volume for redrawn with current candle in case you are using high frame H1 or higher and need to redraw fast
MY FAVOURITE SETTINGS:
D1: Bars shift= 1; Trend bars count x = 2;Trend bars count y = 4; Trend Moving Average = 5;
H1: Bars shift= 13; Trend bars count x = 25;Trend bars count y = 40; Trend Moving Average = 50;
M30: Bars shift= 25 ; Trend bars count x = 50 ;Trend bars count y = 75; Trend Moving Average = 100;
M5 : Bars shift= 200; Trend bars count x = 300;Trend bars count y = 450; Trend Moving Average = 600;