Dapitrend Non Repaint Indicator
- Indicadores
-
Wartono
 No body knows. No Big Boy. BUY-SELL is only the wave. Everything will be back to nature.
 - Versión: 2.20
- Actualizado: 16 marzo 2020
- Activaciones: 10
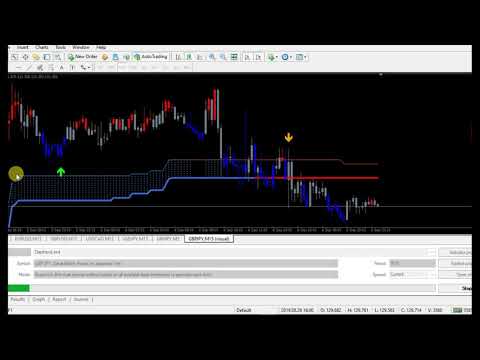
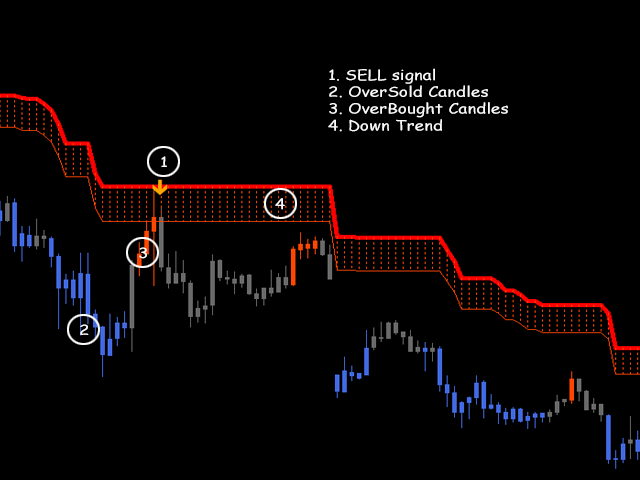
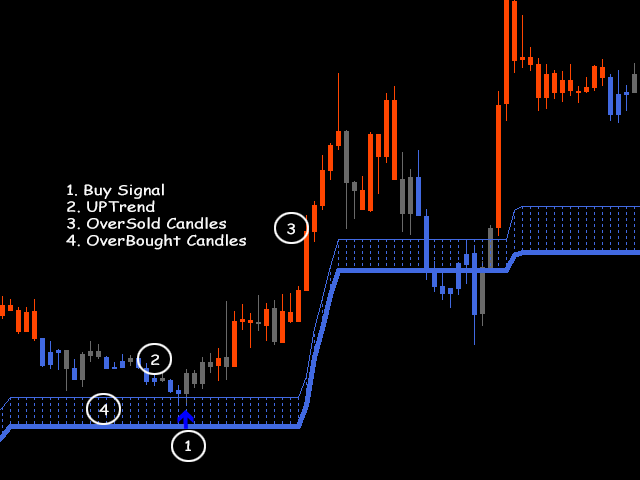
Velas de sobreventa y sobrecompra, líneas de tendencia y flechas de COMPRA-VENTA en un único indicador. Construido a partir de 8 Indicadores MT4 por defecto. Estocástico, RSI, SAR, CCI, RVI, DeMarker, WPR y MA.
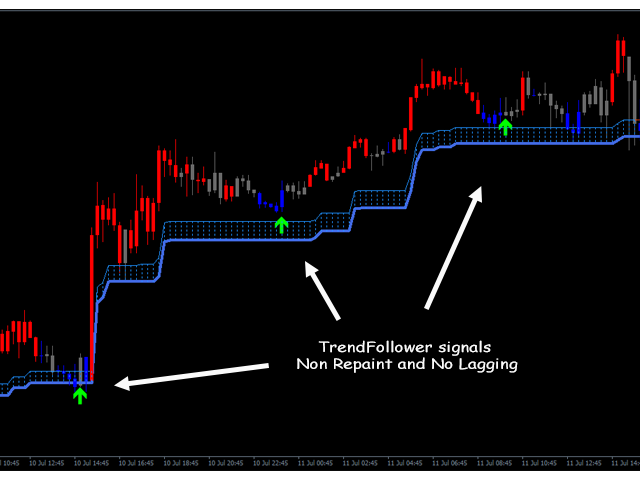
Es un indicador " NON REPAINT ". Todos los buffers no se repintan.
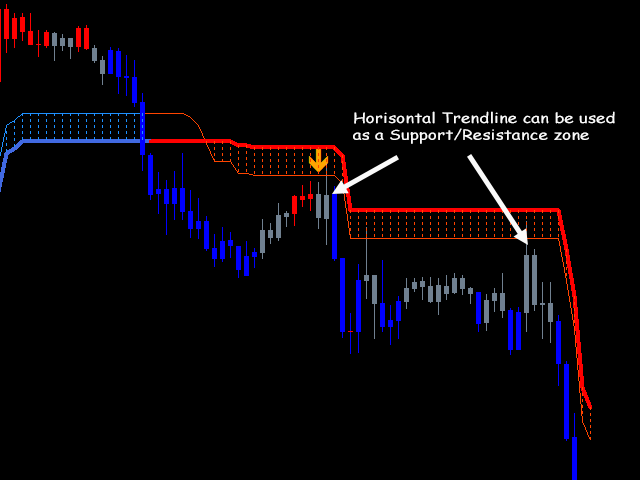
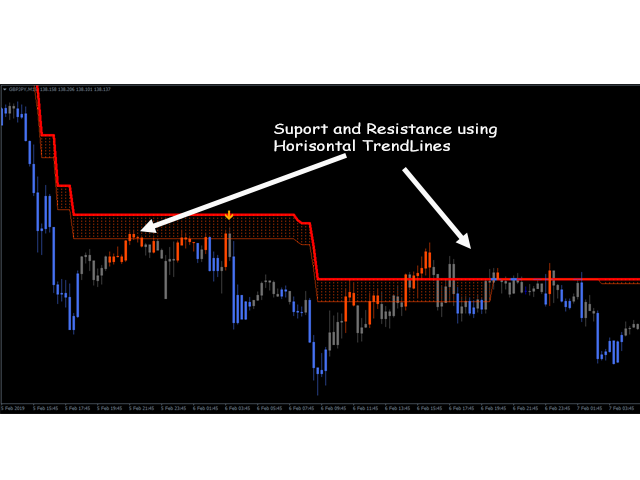
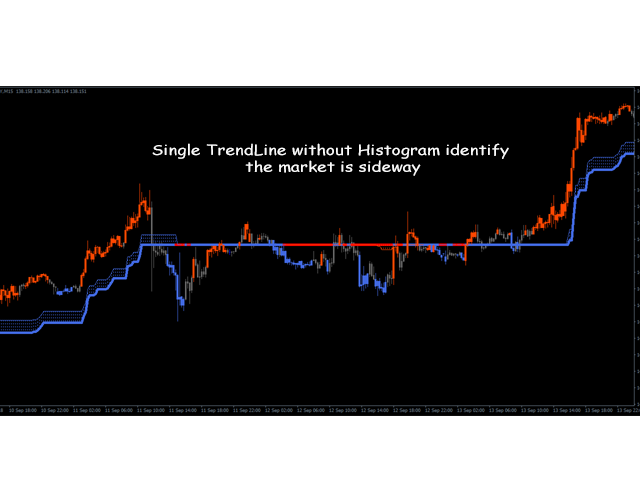
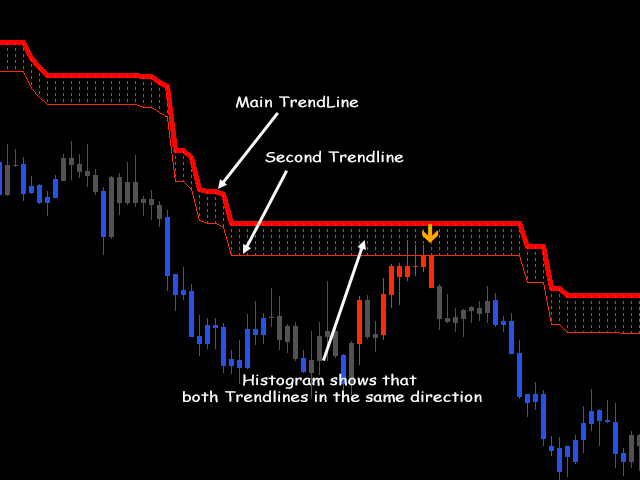
Doble Trendline tampones que también se puede utilizar para identificar el mercado lateral y la zona de resistencia de apoyo.
Cualquier marco de tiempo y cualquier par de divisas.
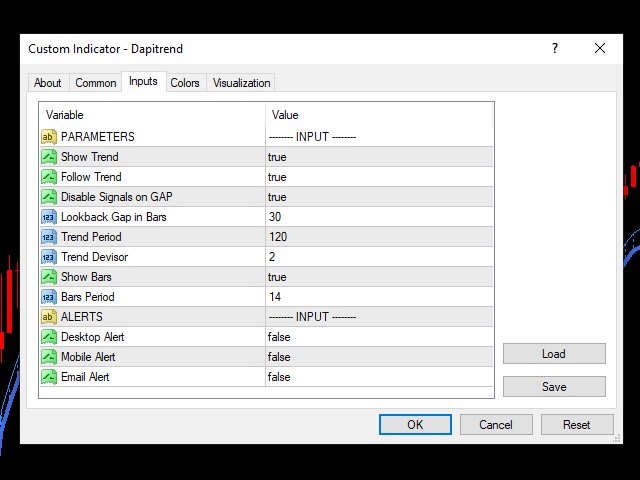
Parámetros:
- Mostrar Tendencia. TRUE/FALSE para mostrar las líneas de tendencia en el gráfico.
- Seguir Tendencia. Si es TRUE , Dapitrend mostrará sólo las flechas de la tendencia actual. La tendencia es identificada por los buffers TrendLine.
- Desactivar Señales en GAP. Si es verdadero, Dapitrend deshabilitará las flechas que todavía están por debajo del rango del precio actual a Lookback Gap in Bars.
- Lookback Gap in Bars. Número de barras entre la señal y el GAP.
- Periodo de Tendencia. Es un periodo de Líneas de Tendencia Principales.
- Desviador de Tendencia. Es un Devisor del Periodo de Tendencia y el resultado es un segundo TrendLines
- Mostrar Barras. Es una opción para mostrar las barras de las velas u ocultarlas. Si es true, Dapitrend mostrará Velas de Sobrecompra y Sobreventa.
- Periodo de Barras. Es el periodo de las Velas.
- Alertas. Incluye Alertas Dekstop, Notificación Móvil y Alertas por Email.