MACD Scanner Dashboard
- Indicadores
-
Wartono
 No body knows. No Big Boy. BUY-SELL is only the wave. Everything will be back to nature.
 - Versión: 1.8
- Actualizado: 30 abril 2023
- Activaciones: 5
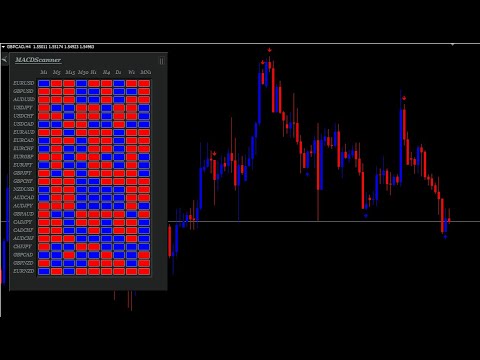
MACD Scanner proporciona múltiples símbolos y marcos temporales de señales MACD. Es útil para el comerciante para encontrar la idea de comercio de forma rápida y sencilla. Fácil de usar, visualmente limpio, colorido y legible.
Visualización dinámica del tablero de instrumentos que se puede ajustar a través de la configuración de entrada externa. Total de Timeframes y Total de símbolos, así como el total deseado de filas/panel, por lo que puede maximizar la eficiencia del uso del espacio del gráfico.
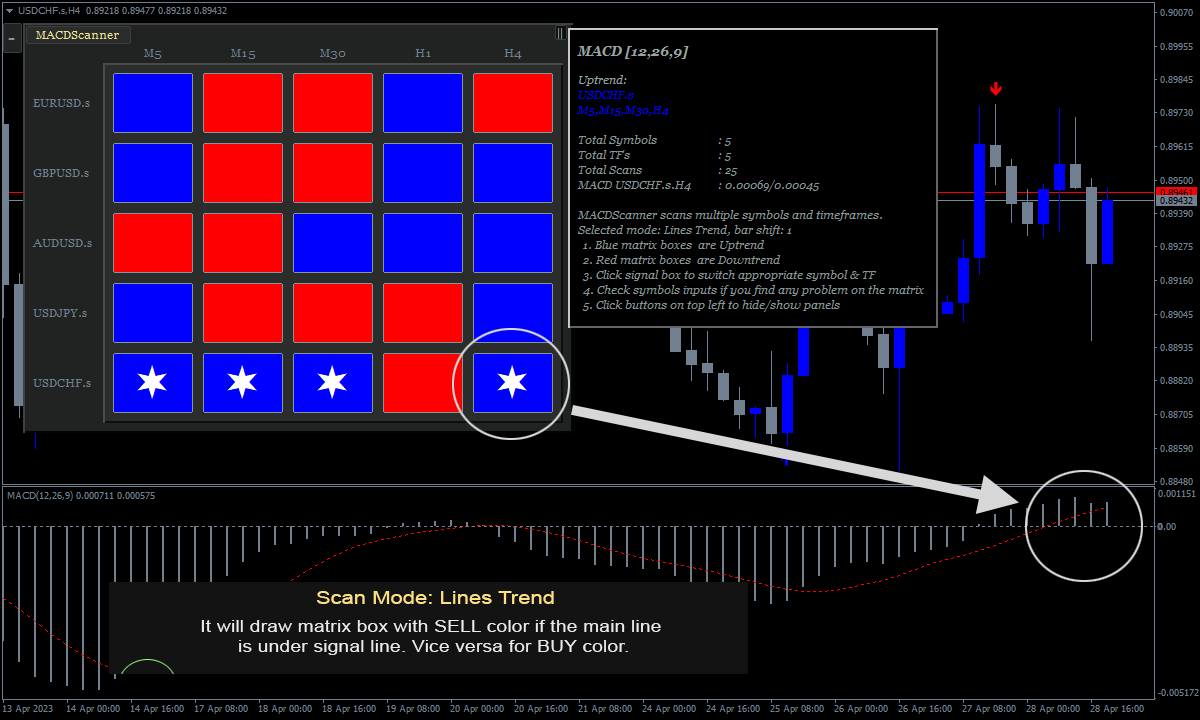
Las Estrellas Resaltadas en la línea de ciertos cuadros de matriz basados en el Modo de Escaneo seleccionado que también es seguido por alerta. Esta característica puede ser útil para el trader para encontrar el símbolo más potencial rápidamente para tomar la decisión de negociación.
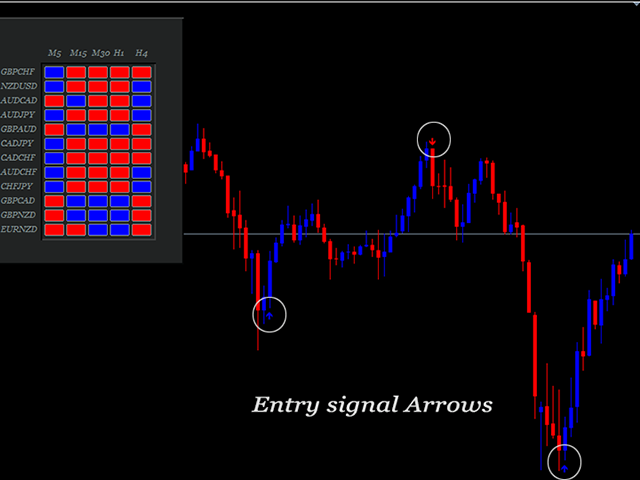
Incluye flechas de señal adicionales en el gráfico para apoyar las señales MACD en el panel.
Consta de 5 modos de escaneo:
- Líneas de Tendencia. Si la Línea MACD está por encima de la Línea de Señal entonces el color de la caja de la matriz es Azul. Y a la inversa si la Línea MACD está por debajo de la Línea de Señal entonces el color es Rojo.
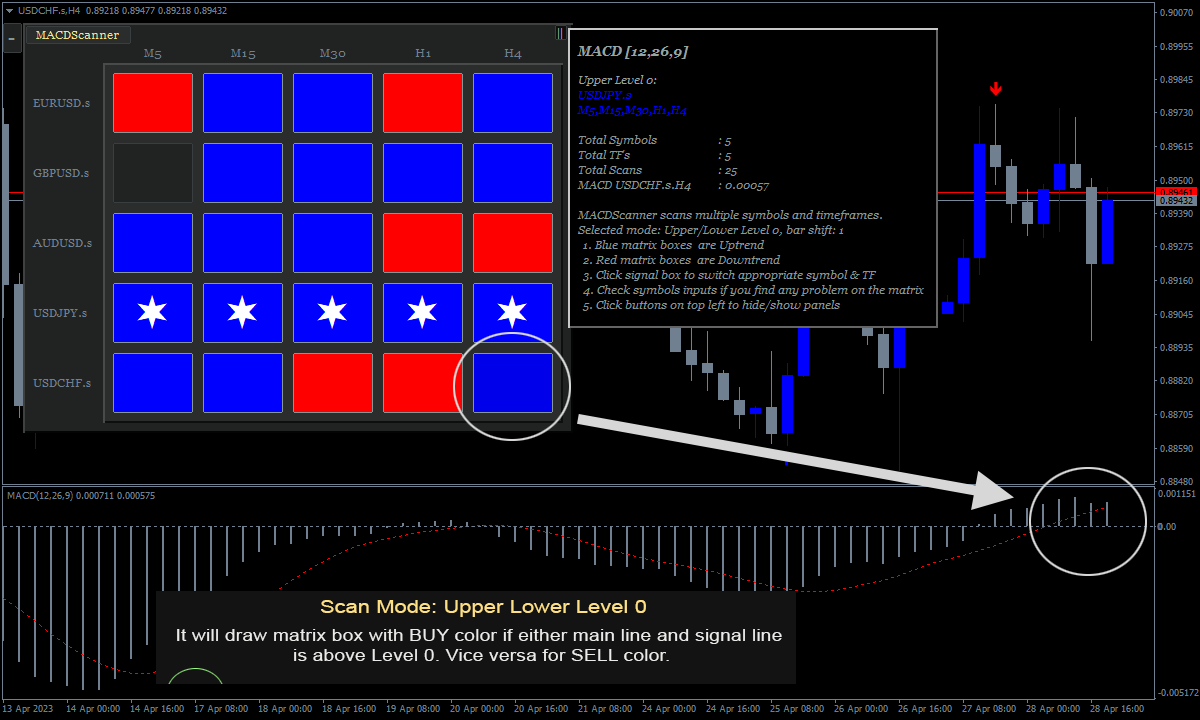
- Nivel Superior/Inferior 0. Si la Línea MACD y la Línea de Señal están por encima del nivel 0 entonces el color de la caja de la matriz es Azul. Y si la Línea MACD y la Línea de Señal están por debajo del nivel 0 entonces el color es Rojo.
- Nivel 0 Superior/Inferior y Tendencia de Líneas. Esta es la combinación de los modos anteriores 1 y 2. Si la Línea MACD está por encima de la Línea de Señal y la Línea MACD y la Línea de Señal están por encima del nivel 0 entonces el color del cuadro de la matriz es Azul. Y si la Línea MACD por debajo de la Línea de Señal y la Línea MACD y la Línea de Señal están por debajo del nivel 0 entonces el color es Rojo.
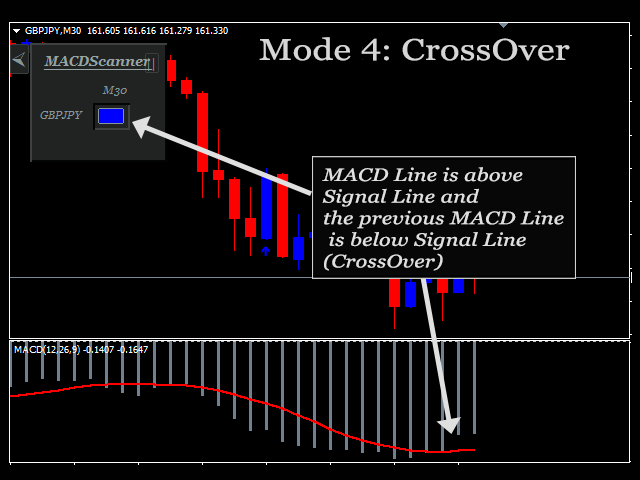
- Líneas de Cruce. Este es el cruce arriba/abajo entre las dos líneas del MACD. Si la Línea MACD actual está por encima de la Línea de Señal y la Línea MACD anterior está por debajo de la Línea de Señal entonces el color de la caja de la matriz es Azul. Y si la Línea MACD actual está por debajo de la Línea de Señal y la Línea MACD anterior está por encima de la Línea de Señal entonces el color es Rojo.
- Nivel de cruce 0. Similar al Modo 4. Pero este es el cruce arriba/abajo del nivel 0. Si la línea de señal cruza hacia arriba el nivel 0 entonces el color de la matriz es Azul y si cruza hacia abajo el nivel 0, el color es Rojo.
El color Azul/Rojo de arriba es ajustable a través de la entrada de parámetros. Puede cambiar el color a su gusto.
Parámetros:
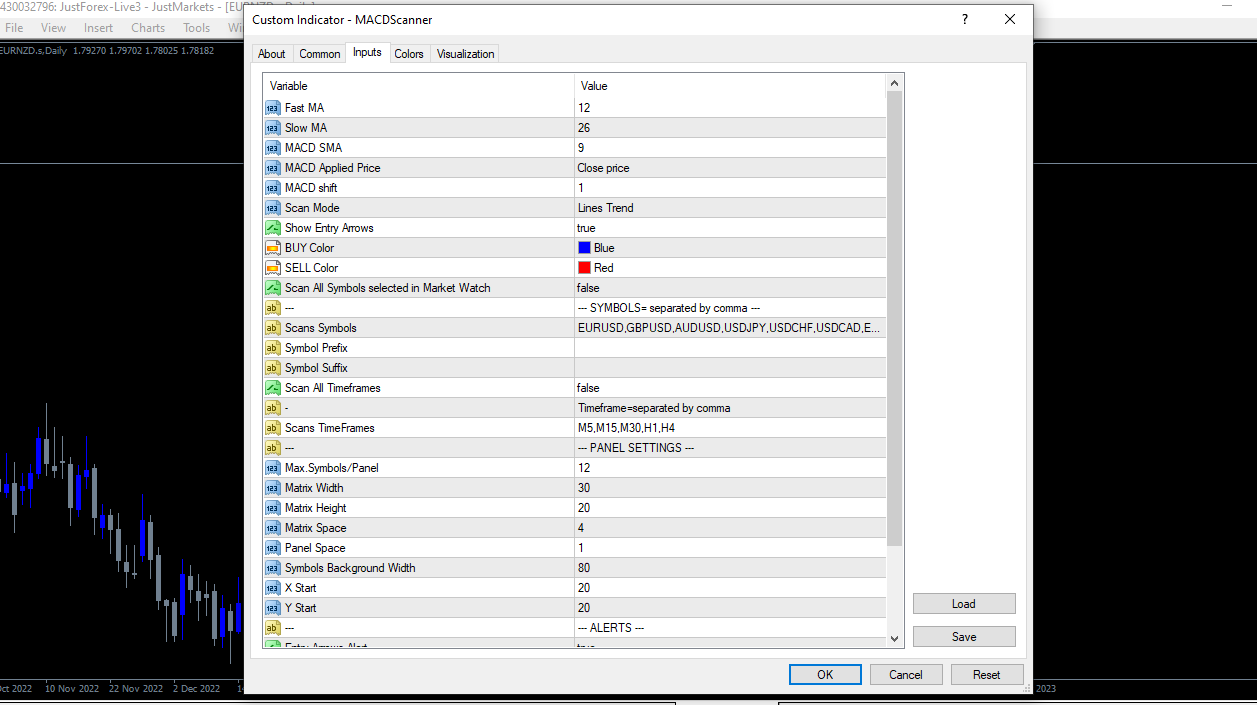
- Fast MA: Esta es la configuración MACD.
- Slow MA: Esta es la configuración MACD.
- MACD SMA: Esta es la configuración MACD.
- MACD Precio Aplicado: Esta es la configuración MACD.
- Desplazamiento MACD: Esta es la configuración del MACD, desplazamiento de la barra del MACD a ser escaneada, contada de derecha a izquierda. Ejemplo: si el valor=1, entonces el indicador escaneará los valores de las señales MACD en la barra 1 de los marcos de tiempo y símbolos seleccionados.
- Modo de Escaneo: Hay 4 modos de escaneo; Líneas de tendencia, Nivel 0 superior/inferior, Nivel 0 superior/inferior y Líneas de tendencia, y CrossOver. Explicado en la parte anterior.
- Mostrar Flechas de Entrada: Si es verdadero, el indicador MACD Scanner mostrará flechas en el gráfico. De lo contrario, falso
- Color de COMPRA: El color de las señales de flecha de COMPRA y de los cuadros de matriz en el panel.
- Color de VENTA: Color de las flechas de VENTA y de los cuadros de matriz del panel.
- Escanear Todos los Símbolos seleccionados en Observación del Mercado: Si es verdadero, el Indicador MACD Scanner escaneará todos los símbolos disponibles en la vigilancia del mercado. Haga clic en la pestaña Ver - Observación del Mercado para comprobar todos los símbolos disponibles.
- Escanea Símbolos: En caso de que Scan All Symbol sea falso entonces especifique los símbolos aquí. Separados por coma.
- Prefijo del símbolo: Prefijo del símbolo si está disponible. Es el carácter que precede al símbolo.
- Sufijo del símbolo: Sufijo del símbolo, si existe. Es el carácter después del símbolo.
- Escanear Todos los Plazos: Si es true, el MACD Scanner escaneará todos los Timeframes disponibles en la MT4. Desde 1 Minuto hasta Mensual.
- Escanea TimeFrames: En caso de que Scan All Timeframes sea falso entonces especifica los timeframes aquí. Separados por comas sin espacio. Puede utilizar los formatos Timeframe aceptados a continuación y puede ser una combinación de ellos:
M1,M5,M15,M30,H1,H4,D1,W1,MN1
m1,m5,m15,m30,h1,h4,d1,w1,mn1
1,5,15,30,60,240,1440,10080,43200
- Símbolos máx./panel: Es el número máximo de filas del panel. Ejemplo: Usted escanea 10 símbolos y su Max.Símbolos/Panel = 5 entonces habrá 5 símbolos en cada panel. Total = 2 paneles.
- Ancho de la Matriz= este es el valor del ancho en píxeles de las cajas de la matriz en el panel.
- Altura de la Matriz = este es el valor de la altura en píxeles de las cajas de la matriz en el panel.
- Espacio de la matriz = el espacio en píxeles entre las cajas de la matriz.
- Espacio Panel = el espacio horizontal en píxeles entre panel.
- Ancho de Fondo de Símbolos = Este es el ancho de fondo de los símbolos, esto se proporciona para adaptarse al nombre largo del símbolo si está disponible.
- Inicio X = El inicio del panel en píxeles, contado desde la izquierda.
- Inicio Y = El inicio del panel en píxeles, desde arriba.
- Alerta de Flechas de Entrada: Si es verdadero, MACDScanner enviará una alerta si la flecha de señal se dispara en caso de que 'Mostrar Flechas de Entrada' sea verdadero.
- Total mínimo de TFs para alertar/símbolo: Este es el mínimo total de TFs para que el indicador envíe una notificación de alerta. Ejemplo: Si el valor de entrada= 3 y M5, M15, y M30 son Azules entonces el Indicador enviará una notificación. Esto no está relacionado con las Flechas de Señal sino con las señales de matriz en el panel. Los parámetros a continuación deben ser convertidos a verdadero para obtener alertas.
- Alerta emergente Alerta móvil
- Alerta por Email
Cómo funcionan las Alertas
El indicador buscará símbolos que tengan el mayor número de señales totales en la misma dirección y más de ' Total mínimo de TFs para alertar/símbolo'. Si se encuentra más de un símbolo con la misma fuerza de señal total, el indicador buscará el símbolo con la menor dirección de señales opuestas. De lo contrario, enviará una alerta y dibujará estrellas resaltadas en la matriz. Si se encuentra más de un símbolo, el indicador buscará el símbolo con la actualización más reciente.
Esto significa que el símbolo con estrellas resaltadas en la matriz es el símbolo más potencial basado en el Modo de Escaneo MACD seleccionado.
Flechas de Señal
Las Flechas de Señal se dibujan en el gráfico actual. No se repintan ni se retrasan. Esta es una característica adicional de MACDScanner. Con la esperanza de que pueda ayudar más al trader a obtener beneficios. Las flechas trabajan basadas en el indicador RSI. Esto significa que pueden ser interpretadas como señales de sobreventa/sobrecompra. El uso de la señal depende del modo de MACDScanner utilizado y de la estrategia de trading. Se puede utilizar como punto de salida y también como punto de entrada.
Por ejemplo
1. Modo Scan: Crossover Nivel 0 y usted hace una entrada de COMPRA cuando recibe una alerta de COMPRA del escáner. Luego puede salir cuando encuentre una flecha de venta en la vela. O puede utilizar las flechas para comenzar a seguir su posición en el nivel de precio determinado.
2. Modo Scan: Líneas de Tendencia y obtendrá alertas de COMPRA desde el escáner en marcos de tiempo: M15,H1,H4. Entonces usted puede esperar la flecha de COMPRA en el marco de tiempo inferior, digamos el marco de tiempo M5 o M15, para enviar la Orden de Compra.
La función principal del indicador MACDScanner es proporcionar una matriz de señales MACD en el panel. En caso de que no desee utilizar las señales de flecha, puede ocultar desde el gráfico. La entrada de parámetros está disponible para hacerlo.
MT5 Versión se puede encontrar aquí.